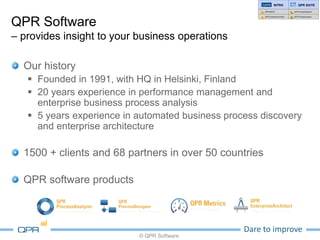
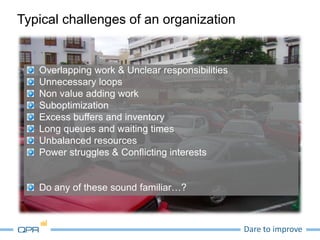
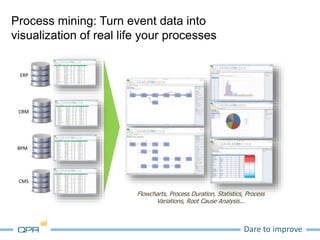
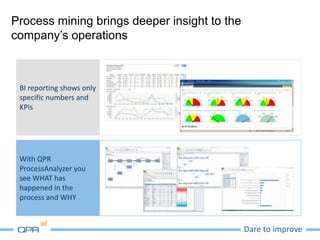
Dare to improve
Jani Heino
QPR Software Plc.
Dare to improve
QPR Software
– provides insight to your business operations
Our history
 Founded in 1991, with HQ in Helsinki, Finland
 20 years experience in performance management and
enterprise business process analysis
 5 years experience in automated business process discovery
and enterprise architecture
1500 + clients and 68 partners in over 50 countries
QPR software products
© QPR Software
INTRO QPR SUITE
QPR Metrics
QPR EnterpriseArchitect
QPR ProcessDesigner
QPR ProcessAnalyzer
Dare to improve
Selected international analyst recognitions
Copyright (C) QPR Software Plc
• Business Intelligence, Analytics and Performance Management Market and Vendor Guide Cross-Reference Tool,
2014 (August 2015)
• Hype Cycle for Enterprise Architecture 2015 (June 2015)
• Hype Cycle for Business Process Management 2015 (June 2015)
• Market Guide for Enterprise Business Process Analysis (March 2015)
• Magic Quadrant for Enterprise Architecture tools 2014 (September 2014)
• MarketScope for Enterprise Business Process Analysis (November 2013)
• Hype Cycle for Business Process Management, 2014 (July 2014)
• Hype Cycle for Business Process Management, 2013 (July 2013)
• Identify ABPD's Business Benefits and Understand Vendor Strength (May 2013)
• Business Intelligence, Analytics and Performance Management Market and Vendor Guide Cross-Reference Tool,
2012 (May 2013)
• Hype Cycle for Performance Management, 2012 (August 2012)
• Hype Cycle for Analytic Applications, 2012 (August 2012)
• Hype Cycle for Business Process Management, 2012 (July 2012)
• Magic Quadrant for Corporate Performance Management Suites 2012 (March 2012)
• Magic Quadrant for Business Process Analysis tools 2011 (December 2011)
• Two QPR customers entered the Balanced Scorecard Hall of Fame in 2014
• Several customers entering the Balanced Scorecard Hall of Fame during earlier years
• Corporate performance management value matrix (May 2015)
• Corporate performance management value matrix (June 2014)
• Corporate performance management value matrix (June 2013)
• Business Process Management radar (May 2013)
• Numerous of our customers have won the EFQM award
• Overall Performance Management Leadership Award (2010)
Dare to improve
Typical challenges of an organization
Overlapping work & Unclear responsibilities
Unnecessary loops
Non value adding work
Suboptimization
Excess buffers and inventory
Long queues and waiting times
Unbalanced resources
Power struggles & Conflicting interests
Do any of these sound familiar…?
Dare to improve
Ref. Laatuhaaste, VM, Kuntaliitto
Organization thinking vs. Process thinking
Organization thinking Process thinking
Who made a mistake? What enabled this mistake?
Fix errors Eliminate root causes
Experts define quality Customers define quality
Problem is in attitudes of people Problem is in work processes
Assess employees Assess the process
There are better employees Process can be improved
I can do my job I understand my part in the process
Dare to improve
So, you have modeled your processes…
Dare to improve
But is your organization really following the
process...
You can design the process… But reality might be different
Dare to improve
Process mining: Turn event data into
visualization of real life your processes
Flowcharts, Process Duration, Statistics, Process
Variations, Root Cause Analysis...
CRM
BPM
CMS
ERP
Dare to improve
Process mining brings deeper insight to the
company’s operations
BI reporting shows only
specific numbers and
KPIs
With QPR
ProcessAnalyzer you
see WHAT has
happened in the
process and WHY
Dare to improve
Business benefits are obvious
With the Process Intelligence –solution, our customers are:
Outperforming competitors
 Substantial improvements in delivery accuracy and customer satisfaction
Improving productivity
 Boosted cash flow through improvements in the process
Cutting down costs
 Significant savings in working capital costs through lower working capital levels
 Cutting down operational costs through removing non value adding work
Making faster decisions and improving quality of operations
 Useful metrics system to identify problems and monitor progress
 Unified measurement and common understanding of the real operational
problems
Right information, to right people, for right decisions!
© QPR Software
Process Improvement
Process Improvement

Process Improvement

  • 1.
    Dare to improve JaniHeino QPR Software Plc.
  • 2.
    Dare to improve QPRSoftware – provides insight to your business operations Our history  Founded in 1991, with HQ in Helsinki, Finland  20 years experience in performance management and enterprise business process analysis  5 years experience in automated business process discovery and enterprise architecture 1500 + clients and 68 partners in over 50 countries QPR software products © QPR Software INTRO QPR SUITE QPR Metrics QPR EnterpriseArchitect QPR ProcessDesigner QPR ProcessAnalyzer
  • 3.
    Dare to improve Selectedinternational analyst recognitions Copyright (C) QPR Software Plc • Business Intelligence, Analytics and Performance Management Market and Vendor Guide Cross-Reference Tool, 2014 (August 2015) • Hype Cycle for Enterprise Architecture 2015 (June 2015) • Hype Cycle for Business Process Management 2015 (June 2015) • Market Guide for Enterprise Business Process Analysis (March 2015) • Magic Quadrant for Enterprise Architecture tools 2014 (September 2014) • MarketScope for Enterprise Business Process Analysis (November 2013) • Hype Cycle for Business Process Management, 2014 (July 2014) • Hype Cycle for Business Process Management, 2013 (July 2013) • Identify ABPD's Business Benefits and Understand Vendor Strength (May 2013) • Business Intelligence, Analytics and Performance Management Market and Vendor Guide Cross-Reference Tool, 2012 (May 2013) • Hype Cycle for Performance Management, 2012 (August 2012) • Hype Cycle for Analytic Applications, 2012 (August 2012) • Hype Cycle for Business Process Management, 2012 (July 2012) • Magic Quadrant for Corporate Performance Management Suites 2012 (March 2012) • Magic Quadrant for Business Process Analysis tools 2011 (December 2011) • Two QPR customers entered the Balanced Scorecard Hall of Fame in 2014 • Several customers entering the Balanced Scorecard Hall of Fame during earlier years • Corporate performance management value matrix (May 2015) • Corporate performance management value matrix (June 2014) • Corporate performance management value matrix (June 2013) • Business Process Management radar (May 2013) • Numerous of our customers have won the EFQM award • Overall Performance Management Leadership Award (2010)
  • 4.
    Dare to improve Typicalchallenges of an organization Overlapping work & Unclear responsibilities Unnecessary loops Non value adding work Suboptimization Excess buffers and inventory Long queues and waiting times Unbalanced resources Power struggles & Conflicting interests Do any of these sound familiar…?
  • 5.
    Dare to improve Ref.Laatuhaaste, VM, Kuntaliitto Organization thinking vs. Process thinking Organization thinking Process thinking Who made a mistake? What enabled this mistake? Fix errors Eliminate root causes Experts define quality Customers define quality Problem is in attitudes of people Problem is in work processes Assess employees Assess the process There are better employees Process can be improved I can do my job I understand my part in the process
  • 7.
    Dare to improve So,you have modeled your processes…
  • 8.
    Dare to improve Butis your organization really following the process... You can design the process… But reality might be different
  • 10.
    Dare to improve Processmining: Turn event data into visualization of real life your processes Flowcharts, Process Duration, Statistics, Process Variations, Root Cause Analysis... CRM BPM CMS ERP
  • 12.
    Dare to improve Processmining brings deeper insight to the company’s operations BI reporting shows only specific numbers and KPIs With QPR ProcessAnalyzer you see WHAT has happened in the process and WHY
  • 13.
    Dare to improve Businessbenefits are obvious With the Process Intelligence –solution, our customers are: Outperforming competitors  Substantial improvements in delivery accuracy and customer satisfaction Improving productivity  Boosted cash flow through improvements in the process Cutting down costs  Significant savings in working capital costs through lower working capital levels  Cutting down operational costs through removing non value adding work Making faster decisions and improving quality of operations  Useful metrics system to identify problems and monitor progress  Unified measurement and common understanding of the real operational problems Right information, to right people, for right decisions! © QPR Software