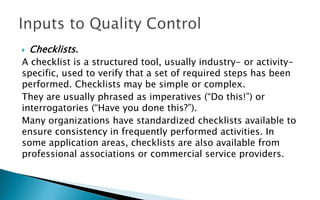
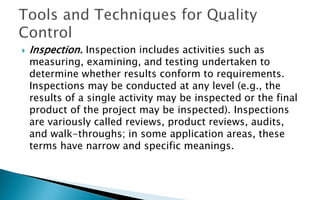
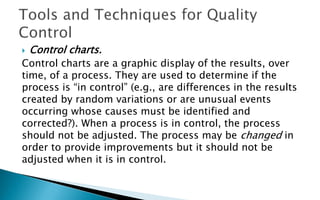
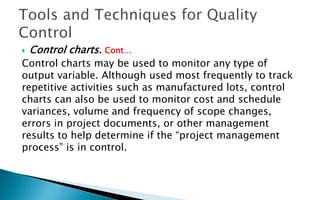
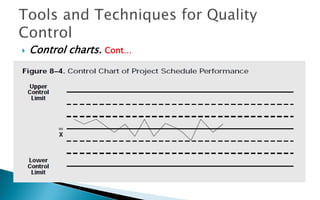
QUALITY CONTROL
Compiled and Illustrated by
MJLADO
 Quality control involves monitoring specific project
results to determine if they comply with relevant quality
standards and identifying ways to eliminate causes of
unsatisfactory results. It should be performed
throughout the project.
 Project results include both product results such as
deliverables and management results such as cost and
schedule performance.
 Quality control is often performed by a Quality Control
Department or similarly titled organizational unit, but it
does not have to be.
 The project management team should have a working
knowledge of statistical quality control, especially
sampling and probability, to help them evaluate quality
control outputs. Among other subjects, they should
know the differences between:
 • Prevention (keeping errors out of the process) and
inspection (keeping errors out of the hands of the
customer).
 • Attribute sampling (the result conforms or it does
not) and variables sampling (the result is rated on a
continuous scale that measures the degree of
conformity).
 • Special causes (unusual events) and random causes
(normal process variation).
 • Tolerances (the result is acceptable if it falls within
the range specified by the tolerance) and control limits
(the process is in control if the result falls within the
control limits).
 Work results.
Work results include both process results and product
results. Information about the planned or expected
results (from the project plan) should be available along
with information about the actual results.
 Quality management plan.
The quality management plan should describe how the
project management team will implement its quality
policy. In ISO 9000 terminology, it should describe the
project quality system: “the organizational structure,
responsibilities, procedures, processes, and resources
needed to implement quality management”.
 Operational definitions.
An operational definition describes, in very specific terms,
what something is, and how it is measured by the quality
control process. For example, it is not enough to say that
meeting the planned schedule dates is a measure of
management quality; the project management team must
also indicate whether every activity must start on time, or
only finish on time; whether individual activities will be
measured or only certain deliverables, and if so, which ones.
Operational definitions are also called metrics in some
application areas.
 Checklists.
A checklist is a structured tool, usually industry- or activity-
specific, used to verify that a set of required steps has been
performed. Checklists may be simple or complex.
They are usually phrased as imperatives (“Do this!”) or
interrogatories (“Have you done this?”).
Many organizations have standardized checklists available to
ensure consistency in frequently performed activities. In
some application areas, checklists are also available from
professional associations or commercial service providers.
 Inspection. Inspection includes activities such as
measuring, examining, and testing undertaken to
determine whether results conform to requirements.
Inspections may be conducted at any level (e.g., the
results of a single activity may be inspected or the final
product of the project may be inspected). Inspections
are variously called reviews, product reviews, audits,
and walk-throughs; in some application areas, these
terms have narrow and specific meanings.
 Control charts.
Control charts are a graphic display of the results, over
time, of a process. They are used to determine if the
process is “in control” (e.g., are differences in the results
created by random variations or are unusual events
occurring whose causes must be identified and
corrected?). When a process is in control, the process
should not be adjusted. The process may be changed in
order to provide improvements but it should not be
adjusted when it is in control.
 Control charts. Cont…
Control charts may be used to monitor any type of
output variable. Although used most frequently to track
repetitive activities such as manufactured lots, control
charts can also be used to monitor cost and schedule
variances, volume and frequency of scope changes,
errors in project documents, or other management
results to help determine if the “project management
process” is in control.
 Control charts. Cont…
 Pareto diagrams.
A Pareto diagram is a histogram, ordered by frequency of
occurrence, that shows how many results were generated
by type or category of identified cause. Rank ordering is
used to guide corrective action—the project team should
take action to fix the problems that are causing the
greatest number of defects first. Pareto diagrams are
conceptually related to Pareto’s Law, which holds that a
relatively small number of causes will typically produce a
large majority of the problems or defects.
Pareto diagrams
 Statistical sampling.
Statistical sampling involves choosing part of a
population of interest for inspection (e.g., selecting ten
engineering drawings at random from a list of 75).
Appropriate sampling can often reduce the cost of
quality control. There is a substantial body of knowledge
on statistical sampling; in some application areas, it is
necessary for the project management team to be
familiar with a variety of sampling techniques.
 Flowcharting.
Flowcharting is described in Flowcharting is used in
quality control to help analyze how problems occur.
 Trend analysis.
Trend analysis involves using mathematical techniques
to forecast future outcomes based on historical results.
Trend analysis is often used to monitor:
• Technical performance—how many errors or defects
have been identified, how many remain uncorrected.
• Cost and schedule performance—how many activities
per period were completed with significant variances.
 Quality improvement.
Quality improvement includes taking action to increase
the effectiveness and efficiency of the project to provide
added benefits to the project stakeholders. In most
cases, implementing quality improvements will require
preparation of change requests or taking of corrective
action and will be handled according to procedures for
overall change control.
 Acceptance decisions.
The items inspected will be either accepted or rejected.
Rejected items may require rework.
 Rework.
Rework is action taken to bring a defective or non-
conforming item into compliance with requirements or
specifications. Rework, especially unanticipated rework,
is a frequent cause of project overruns in most
application areas. The project team should make every
reasonable effort to minimize rework.
 Completed checklists.
When checklists are used, the completed checklists
should become part of the project’s records.
 Process adjustments.
Process adjustments involve immediate corrective or
preventive action as a result of quality control
measurements. In some cases, the process adjustment
may need to be handled according to procedures for
overall change control.
 The purpose of presentation is to provide leaders and
team members of projects, committees or task forces
with advanced techniques and practical skills for
initiating, planning, tracking, controlling and evaluating
any kind or size of project.
 On time
 On budget
 Meeting the goals that have been agreed upon
A project is an activity that :
 is temporary having a start and end date
 is unique
 brings about change
 has unknown elements, which therefore create risk
 Deliverables: Tangible ‘things’ that the project
produces
 Milestones: Dates by which major activities are
performed.
 Tasks: Also called Actions. Activities undertaken during
the project
 Risks: Potential problems that may arise
 Issues: Risks that have happened
 Gantt Chart: A specific type of chart showing time and
tasks. Usually created by a Project Management
program like MS Project.
 Stakeholder: Any person or group of people who may
be affected by your project
WBS
 Hierarchy of tasks required to complete project
 Each task is broken into smaller tasks that can be
managed and estimated
◦ Define task dependencies Some tasks must begin at the same
time, some must end at the same time and some cannot start until
the other tasks have finished.
 Estimate task durations and cost
 May be inputted into project management software
 Final WBS plan is called baseline WBS
Risks:
 Plan is not approved after first round of feedback
 Resources are not available at the required time
 Plan is not given consent
 For each of the above, you should have a contingency
plan, or do some activity that may prevent it happening
in the first place.
 Issues:
If any of the above actually happens, then it becomes an
issue to solve.
 Gantt Chart:
 Stakeholder:
House owner, Builder, Council, ???
 A successful Project Manager must simultaneously
manage the four basic elements of a project:
Resources, time, money, and most importantly, scope.
All these elements are interrelated. Each must be
managed effectively. All must be managed together if the
project is to be a success. The resource that can be
leveraged to the greatest extent in all projects is the
people involved.
A person with a diverse set of skills –management,
leadership, technical, conflict management, and
customer relationship – who is responsible for:
 initiating,
 planning,
 executing,
 controlling,
 monitoring,
 and closing down a project .
Quality Control

Quality Control

  • 1.
    QUALITY CONTROL Compiled andIllustrated by MJLADO
  • 2.
     Quality controlinvolves monitoring specific project results to determine if they comply with relevant quality standards and identifying ways to eliminate causes of unsatisfactory results. It should be performed throughout the project.
  • 3.
     Project resultsinclude both product results such as deliverables and management results such as cost and schedule performance.  Quality control is often performed by a Quality Control Department or similarly titled organizational unit, but it does not have to be.
  • 4.
     The projectmanagement team should have a working knowledge of statistical quality control, especially sampling and probability, to help them evaluate quality control outputs. Among other subjects, they should know the differences between:
  • 5.
     • Prevention(keeping errors out of the process) and inspection (keeping errors out of the hands of the customer).  • Attribute sampling (the result conforms or it does not) and variables sampling (the result is rated on a continuous scale that measures the degree of conformity).
  • 6.
     • Specialcauses (unusual events) and random causes (normal process variation).  • Tolerances (the result is acceptable if it falls within the range specified by the tolerance) and control limits (the process is in control if the result falls within the control limits).
  • 7.
     Work results. Workresults include both process results and product results. Information about the planned or expected results (from the project plan) should be available along with information about the actual results.
  • 8.
     Quality managementplan. The quality management plan should describe how the project management team will implement its quality policy. In ISO 9000 terminology, it should describe the project quality system: “the organizational structure, responsibilities, procedures, processes, and resources needed to implement quality management”.
  • 9.
     Operational definitions. Anoperational definition describes, in very specific terms, what something is, and how it is measured by the quality control process. For example, it is not enough to say that meeting the planned schedule dates is a measure of management quality; the project management team must also indicate whether every activity must start on time, or only finish on time; whether individual activities will be measured or only certain deliverables, and if so, which ones. Operational definitions are also called metrics in some application areas.
  • 10.
     Checklists. A checklistis a structured tool, usually industry- or activity- specific, used to verify that a set of required steps has been performed. Checklists may be simple or complex. They are usually phrased as imperatives (“Do this!”) or interrogatories (“Have you done this?”). Many organizations have standardized checklists available to ensure consistency in frequently performed activities. In some application areas, checklists are also available from professional associations or commercial service providers.
  • 11.
     Inspection. Inspectionincludes activities such as measuring, examining, and testing undertaken to determine whether results conform to requirements. Inspections may be conducted at any level (e.g., the results of a single activity may be inspected or the final product of the project may be inspected). Inspections are variously called reviews, product reviews, audits, and walk-throughs; in some application areas, these terms have narrow and specific meanings.
  • 12.
     Control charts. Controlcharts are a graphic display of the results, over time, of a process. They are used to determine if the process is “in control” (e.g., are differences in the results created by random variations or are unusual events occurring whose causes must be identified and corrected?). When a process is in control, the process should not be adjusted. The process may be changed in order to provide improvements but it should not be adjusted when it is in control.
  • 13.
     Control charts.Cont… Control charts may be used to monitor any type of output variable. Although used most frequently to track repetitive activities such as manufactured lots, control charts can also be used to monitor cost and schedule variances, volume and frequency of scope changes, errors in project documents, or other management results to help determine if the “project management process” is in control.
  • 14.
  • 15.
     Pareto diagrams. APareto diagram is a histogram, ordered by frequency of occurrence, that shows how many results were generated by type or category of identified cause. Rank ordering is used to guide corrective action—the project team should take action to fix the problems that are causing the greatest number of defects first. Pareto diagrams are conceptually related to Pareto’s Law, which holds that a relatively small number of causes will typically produce a large majority of the problems or defects.
  • 16.
  • 17.
     Statistical sampling. Statisticalsampling involves choosing part of a population of interest for inspection (e.g., selecting ten engineering drawings at random from a list of 75). Appropriate sampling can often reduce the cost of quality control. There is a substantial body of knowledge on statistical sampling; in some application areas, it is necessary for the project management team to be familiar with a variety of sampling techniques.
  • 18.
     Flowcharting. Flowcharting isdescribed in Flowcharting is used in quality control to help analyze how problems occur.
  • 19.
     Trend analysis. Trendanalysis involves using mathematical techniques to forecast future outcomes based on historical results. Trend analysis is often used to monitor: • Technical performance—how many errors or defects have been identified, how many remain uncorrected. • Cost and schedule performance—how many activities per period were completed with significant variances.
  • 20.
     Quality improvement. Qualityimprovement includes taking action to increase the effectiveness and efficiency of the project to provide added benefits to the project stakeholders. In most cases, implementing quality improvements will require preparation of change requests or taking of corrective action and will be handled according to procedures for overall change control.
  • 21.
     Acceptance decisions. Theitems inspected will be either accepted or rejected. Rejected items may require rework.
  • 22.
     Rework. Rework isaction taken to bring a defective or non- conforming item into compliance with requirements or specifications. Rework, especially unanticipated rework, is a frequent cause of project overruns in most application areas. The project team should make every reasonable effort to minimize rework.
  • 23.
     Completed checklists. Whenchecklists are used, the completed checklists should become part of the project’s records.
  • 24.
     Process adjustments. Processadjustments involve immediate corrective or preventive action as a result of quality control measurements. In some cases, the process adjustment may need to be handled according to procedures for overall change control.
  • 26.
     The purposeof presentation is to provide leaders and team members of projects, committees or task forces with advanced techniques and practical skills for initiating, planning, tracking, controlling and evaluating any kind or size of project.
  • 27.
     On time On budget  Meeting the goals that have been agreed upon
  • 28.
    A project isan activity that :  is temporary having a start and end date  is unique  brings about change  has unknown elements, which therefore create risk
  • 29.
     Deliverables: Tangible‘things’ that the project produces  Milestones: Dates by which major activities are performed.  Tasks: Also called Actions. Activities undertaken during the project  Risks: Potential problems that may arise
  • 30.
     Issues: Risksthat have happened  Gantt Chart: A specific type of chart showing time and tasks. Usually created by a Project Management program like MS Project.  Stakeholder: Any person or group of people who may be affected by your project
  • 32.
    WBS  Hierarchy oftasks required to complete project  Each task is broken into smaller tasks that can be managed and estimated ◦ Define task dependencies Some tasks must begin at the same time, some must end at the same time and some cannot start until the other tasks have finished.  Estimate task durations and cost  May be inputted into project management software  Final WBS plan is called baseline WBS
  • 33.
    Risks:  Plan isnot approved after first round of feedback  Resources are not available at the required time  Plan is not given consent  For each of the above, you should have a contingency plan, or do some activity that may prevent it happening in the first place.
  • 34.
     Issues: If anyof the above actually happens, then it becomes an issue to solve.
  • 35.
  • 36.
     Stakeholder: House owner,Builder, Council, ???
  • 37.
     A successfulProject Manager must simultaneously manage the four basic elements of a project: Resources, time, money, and most importantly, scope. All these elements are interrelated. Each must be managed effectively. All must be managed together if the project is to be a success. The resource that can be leveraged to the greatest extent in all projects is the people involved.
  • 38.
    A person witha diverse set of skills –management, leadership, technical, conflict management, and customer relationship – who is responsible for:  initiating,  planning,  executing,  controlling,  monitoring,  and closing down a project .