![Properties in the Literature
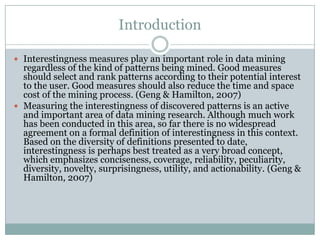
Properties of i(XY) = f(n, nx, ny, nxy)
[Piatetsky-Shapiro 1991] (strong rules):
(P1) =0 if X and Y are independent
(P2) increases with examples nxy
(P3) decreases with premise nx (or conclusion ny)(?)
[Major & Mangano 1993]:
(P4) increases with nxy when confidence is constant (nxy/nx)
[Freitas 1999]:
(P5) asymmetry (i(XY)/=i(YX))
Small disjunctions (nuggets)
[Tan et al. 2002], [Hilderman & Hamilton 2001] and [Gras et al. 2004]](https://image.slidesharecdn.com/probabilisticinterestingnessmeasures-130531012250-phpapp01/85/Probabilistic-Interestingness-Measures-An-Introduction-with-Bayesian-Belief-Networks-9-320.jpg)
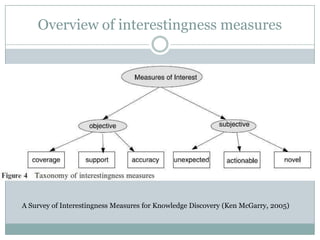
![Selected Properties
Inclusion and equiprobability
0, interval of security
Independence
0, interval of security
Bounded maximum value
Comparability, global threshold, inclusion
Non linearity
Noise Resistance, interval of security for independence and
equiprobability
Sensibility
N (nuggets), dilation (likelihood)
Frequency p(X) cardinal nx
Reinforcement by similar rules (contra-positive, negative
rule,…)
[Smyth & Goodman 1991][Kodratoff 2001][Gras et al 2001][Gras et al. 2004]](https://image.slidesharecdn.com/probabilisticinterestingnessmeasures-130531012250-phpapp01/85/Probabilistic-Interestingness-Measures-An-Introduction-with-Bayesian-Belief-Networks-10-320.jpg)
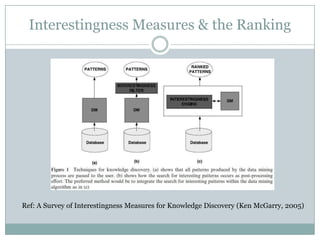
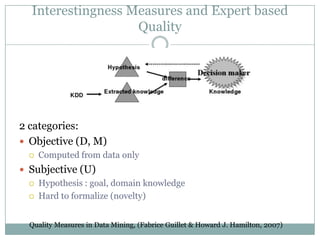
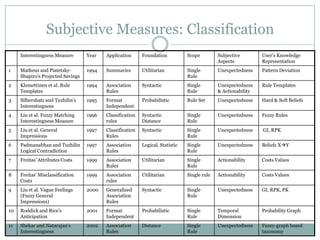
![Interestingness Measure Classifying Criteria
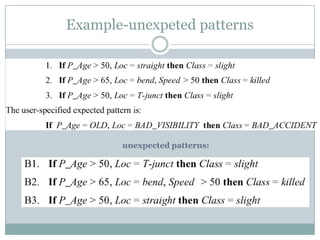
Subjective Measure: A subjective measure takes into
account both the data and the user of these data. To define a
subjective measure, access to the user’s domain or
background knowledge about the data is required. This access
can be obtained by interacting with the user during the data
mining process or by explicitly representing the user’s
knowledge or expectations. In the latter case, the key issue is
the representation of the user’s knowledge, which has been
addressed by various frameworks and procedures for data
mining [Liu et al. 1997, 1999; Silberschatz and Tuzhilin 1995,
1996; Sahar 1999]. Novelty and surprisingness depend on the
user of the patterns, as well as the data and patterns
themselves, and hence can be considered subjective.](https://image.slidesharecdn.com/probabilisticinterestingnessmeasures-130531012250-phpapp01/85/Probabilistic-Interestingness-Measures-An-Introduction-with-Bayesian-Belief-Networks-12-320.jpg)
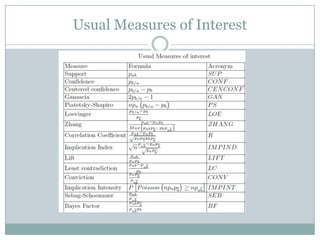
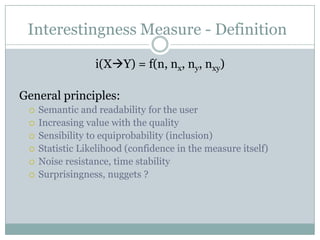
![Interestingness Measure Classifying Criteria
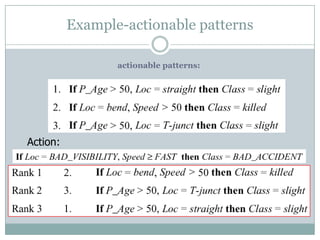
Semantic Measure: A semantic measure considers the semantics and
explanations of the patterns. Because semantic measures involve domain
knowledge from the user, some researchers consider them a special type of
subjective measure [Yao et al. 2006]. Utility and actionability depend on
the semantics of the data, and thus can be considered semantic. Utility-
based measures, where the relevant semantics are the utilities of the
patterns in the domain, are the most common type of semantic measure.
To use a utility-based approach, the user must specify additional
knowledge about the domain. Unlike subjective measures, where the
domain knowledge is about the data itself and is usually represented in a
format similar to that of the discovered pattern, the domain knowledge
required for semantic measures does not relate to the user’s knowledge or
expectations concerning the data. Instead, it represents a utility function
that reflects the user’s goals. This function should be optimized in the
mined results. For example, a store manager might prefer association rules
that relate to high-profit items over those with higher statistical
significance.](https://image.slidesharecdn.com/probabilisticinterestingnessmeasures-130531012250-phpapp01/85/Probabilistic-Interestingness-Measures-An-Introduction-with-Bayesian-Belief-Networks-13-320.jpg)
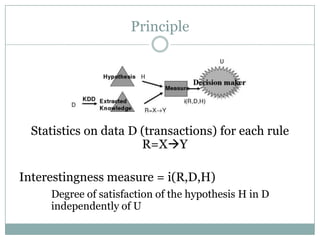
![Conciseness
A pattern is concise if it contains relatively few
attribute-value pairs, while a set of patterns is
concise if it contains relatively few patterns. A
concise pattern or set of patterns is relatively easy to
understand and remember and thus is added more
easily to the user’s knowledge (set of beliefs).
Accordingly, much research has been conducted to
find a minimum set of patterns, using properties
such as monotonicity [Padmanabhan and Tuzhilin
2000] and confidence invariance [Bastide et al.
2000].](https://image.slidesharecdn.com/probabilisticinterestingnessmeasures-130531012250-phpapp01/85/Probabilistic-Interestingness-Measures-An-Introduction-with-Bayesian-Belief-Networks-16-320.jpg)
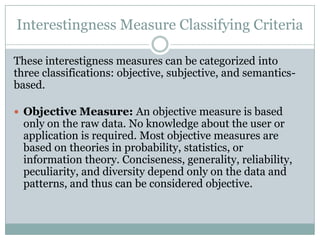
![Generality/Coverage
A pattern is general if it covers a relatively large subset of a dataset.
Generality (or coverage) measures the comprehensiveness of a pattern, that
is, the fraction of all records in the dataset that matches the pattern. If a
pattern characterizes more information in the dataset, it tends to be more
interesting [Agrawal and Srikant 1994; Webb and Brain 2002]. Frequent
itemsets are the most studied general patterns in the data mining literature.
An itemset is a set of items, such as some items from a grocery basket. An
itemset is frequent if its support, the fraction of records in the dataset
containing the itemset, is above a given threshold [Agrawal and Srikant
1994].
The best known algorithm for finding frequent itemsets is the Apriori
algorithm [Agrawal and Srikant 1994]. Some generality measures can form
the bases for pruning strategies; for example, the support measure is used
in the Apriori algorithm as the basis for pruning itemsets. For classification
rules, Webb and Brain [2002] gave an empirical evaluation showing how
generality affects classification results. Generality frequently coincides with
conciseness because concise patterns tend to have greater coverage.](https://image.slidesharecdn.com/probabilisticinterestingnessmeasures-130531012250-phpapp01/85/Probabilistic-Interestingness-Measures-An-Introduction-with-Bayesian-Belief-Networks-17-320.jpg)
![Reliability
A pattern is reliable if the relationship described by
the pattern occurs in a high percentage of applicable
cases. For example, a classification rule is reliable if
its predictions are highly accurate, and an
association rule is reliable if it has high confidence.
Many measures from probability, statistics, and
information retrieval have been proposed to measure
the reliability of association rules [Ohsaki et al.
2004; Tan et al. 2002].](https://image.slidesharecdn.com/probabilisticinterestingnessmeasures-130531012250-phpapp01/85/Probabilistic-Interestingness-Measures-An-Introduction-with-Bayesian-Belief-Networks-18-320.jpg)
![Peculiarity
A pattern is peculiar if it is far away from other
discovered patterns according to some distance
measure. Peculiar patterns are generated from
peculiar data (or outliers), which are relatively few in
number and significantly different from the rest of
the data [Knorr et al. 2000; Zhong et al. 2003].
Peculiar patterns may be unknown to the user, hence
interesting.](https://image.slidesharecdn.com/probabilisticinterestingnessmeasures-130531012250-phpapp01/85/Probabilistic-Interestingness-Measures-An-Introduction-with-Bayesian-Belief-Networks-19-320.jpg)
![Diversity
A pattern is diverse if its elements differ significantly from
each other, while a set of patterns is diverse if the patterns in
the set differ significantly from each other. Diversity is a
common factor for measuring the interestingness of
summaries [Hilderman and Hamilton 2001]. According to a
simple point of view, a summary can be considered diverse if
its probability distribution is far from the uniform
distribution. A diverse summary may be interesting because
in the absence of any relevant knowledge, a user commonly
assumes that the uniform distribution will hold in a summary.
According to this reasoning, the more diverse the summary is,
the more interesting it is. We are unaware of any existing
research on using diversity to measure the interestingness of
classification or association rules.](https://image.slidesharecdn.com/probabilisticinterestingnessmeasures-130531012250-phpapp01/85/Probabilistic-Interestingness-Measures-An-Introduction-with-Bayesian-Belief-Networks-20-320.jpg)
![Novelty
A pattern is novel to a person if he or she did not know it
before and is not able to infer it from other known patterns.
No known data mining system represents everything that a
user knows, and thus, novelty cannot be measured explicitly
with reference to the user’s knowledge. Similarly, no known
data mining system represents what the user does not know,
and therefore, novelty cannot be measured explicitly with
reference to the user’s ignorance. Instead, novelty is detected
by having the user either explicitly identify a pattern as novel
[Sahar 1999] or notice that a pattern cannot be deduced from
and does not contradict previously discovered patterns. In the
latter case, the discovered patterns are being used as an
approximation to the user’s knowledge.](https://image.slidesharecdn.com/probabilisticinterestingnessmeasures-130531012250-phpapp01/85/Probabilistic-Interestingness-Measures-An-Introduction-with-Bayesian-Belief-Networks-21-320.jpg)
![Surprisingness
A pattern is surprising (or unexpected) if it contradicts a
person’s existing knowledge or expectations [Liu et al.
1997, 1999; Silberschatz and Tuzhilin 1995, 1996]. A
pattern that is an exception to a more general pattern
which has already been discovered can also be
considered surprising [Bay and Pazzani 1999; Carvalho
and Freitas 2000]. Surprising patterns are interesting
because they identify failings in previous knowledge and
may suggest an aspect of the data that needs further
study. The difference between surprisingness and novelty
is that a novel pattern is new and not contradicted by any
pattern already known to the user, while a surprising
pattern contradicts the user’s previous knowledge or
expectations.](https://image.slidesharecdn.com/probabilisticinterestingnessmeasures-130531012250-phpapp01/85/Probabilistic-Interestingness-Measures-An-Introduction-with-Bayesian-Belief-Networks-22-320.jpg)
![Utility
A pattern is of utility if its use by a person
contributes to reaching a goal. Different people may
have divergent goals concerning the knowledge that
can be extracted from a dataset. For example, one
person may be interested in finding all sales with
high profit in a transaction dataset, while another
may be interested in finding all transactions with
large increases in gross sales. This kind of
interestingness is based on user-defined utility
functions in addition to the raw data [Chan et al.
2003; Lu et al. 2001; Yao et al. 2004; Yao and
Hamilton 2006].](https://image.slidesharecdn.com/probabilisticinterestingnessmeasures-130531012250-phpapp01/85/Probabilistic-Interestingness-Measures-An-Introduction-with-Bayesian-Belief-Networks-23-320.jpg)
![Actionability
A pattern is actionable (or applicable) in some
domain if it enables decision making about future
actions in this domain [Ling et al. 2002;Wang et al.
2002]. Actionability is sometimes associated with a
pattern selection strategy. So far, no general method
for measuring actionability has been devised.
Existing measures depend on the applications. For
example, Ling et al. [2002], measured actionability
as the cost of changing the customer’s current
condition to match the objectives, whereas Wang et
al. [2002], measured actionability as the profit that
an association rule can bring.](https://image.slidesharecdn.com/probabilisticinterestingnessmeasures-130531012250-phpapp01/85/Probabilistic-Interestingness-Measures-An-Introduction-with-Bayesian-Belief-Networks-24-320.jpg)
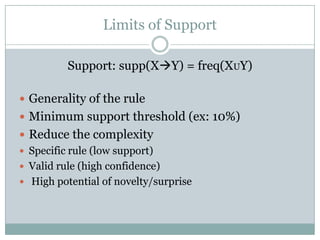
![Limits of Confidence
Confidence: conf(XY) = P(Y|X) = freq(XUY)/freq(X)
Validity/logical aspect of the rule (inclusion)
Minimal confidence threshold (ex: 90%)
Reduces the amount of extracted rules
Interestingness /= validity
No detection of independence
Independence:
X and Y are independent: P(Y|X) = P(Y)
If P(Y) is high => nonsense rule with high support
Ex: Couches beer (supp=20%, conf=90%) if supp(beer)=90%
[Guillaume et al. 1998], [Lallich et al. 2004]](https://image.slidesharecdn.com/probabilisticinterestingnessmeasures-130531012250-phpapp01/85/Probabilistic-Interestingness-Measures-An-Introduction-with-Bayesian-Belief-Networks-28-320.jpg)
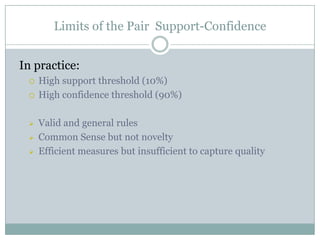
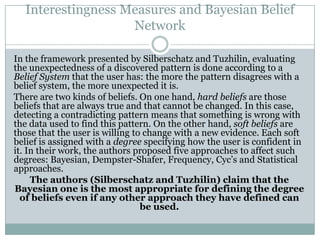
![Subjective interestingness measures
General impression
gi(<S1, …, Sm>) [support, confidence]
↓
Reasonably precise concept
rpc(<S1, …, Sm → V1, …, Vg>) [support, confidence]
↓
Precise knowledge
pk(<S1, …, Sm → V1, …, Vg>) [support, confidence]
Analyzing the Subjective Interestingness of Association Rules
Bing Liu et al., 2000](https://image.slidesharecdn.com/probabilisticinterestingnessmeasures-130531012250-phpapp01/85/Probabilistic-Interestingness-Measures-An-Introduction-with-Bayesian-Belief-Networks-31-320.jpg)
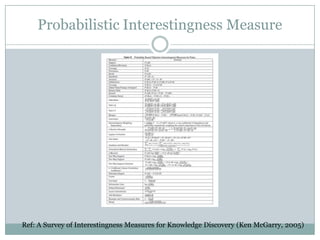
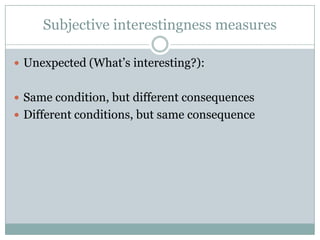
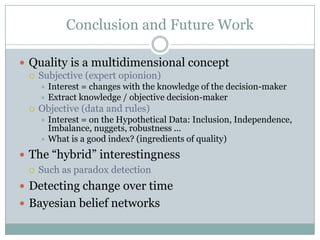
![Objective Measures: Examples of Quality Criteria
Criteria of interestingness [Hussein 2000]:
Objective:
Generality : (ex: Support)
Validity: (ex: Confidence)
Reliability: (ex: High generality and validity)
Subjective:
Common Sense: reliable + known yet
Actionability : utility for decision
Novelty: previously unknown
Surprise (Unexpectedness): contradiction ?](https://image.slidesharecdn.com/probabilisticinterestingnessmeasures-130531012250-phpapp01/85/Probabilistic-Interestingness-Measures-An-Introduction-with-Bayesian-Belief-Networks-33-320.jpg)
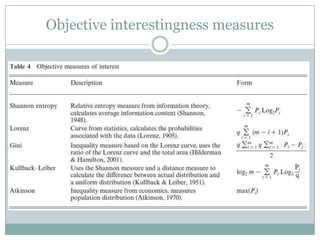
![Association Rules
Association rules [Agrawal et al. 1993]:
Market-basket analysis
Non supervised learning
Algorithms + 2 measures (support and confidence)
Problems:
Enormous amount of rules (rough rules)
Few semantic on support and confidence measures
Need to help the user select the best rules](https://image.slidesharecdn.com/probabilisticinterestingnessmeasures-130531012250-phpapp01/85/Probabilistic-Interestingness-Measures-An-Introduction-with-Bayesian-Belief-Networks-34-320.jpg)
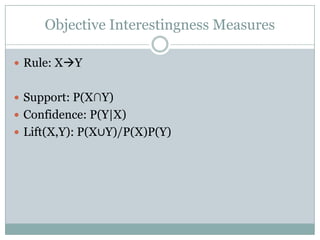
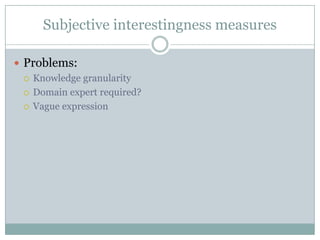
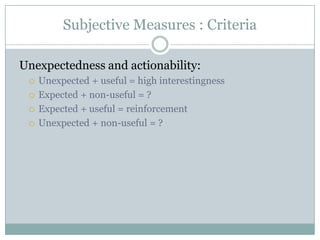
![Subjective Measures: Criteria
User-oriented measures (U)
Quality : interestingness:
Unexpectedness [Silberschatz 1996]
Unknown or contradictory rule
Actionability (Usefulness) [Piatesky-shapiro 1994]
Usefulness for decision making, gain
Anticipation [Roddick 2001]
Prediction on temporal dimension](https://image.slidesharecdn.com/probabilisticinterestingnessmeasures-130531012250-phpapp01/85/Probabilistic-Interestingness-Measures-An-Introduction-with-Bayesian-Belief-Networks-37-320.jpg)
![Subjective Measures: Other Subjective Measures
Projected Savings (KEFIR system’s interestingness)
[Matheus & Piatetsky-Shapiro 1994]
Fuzzy Matching Interestingness Measure [Lie et al. 1996]
General Impression [Liu et al. 1997]
Logical Contradiction [Padmanabhan & Tuzhilin’s 1997]
Misclassification Costs [Frietas 1999]
Vague Feelings (Fuzzy General Impressions) [Liu et al.
2000]
Anticipation [Roddick and rice 2001]
Interestingness [Shekar & Natarajan’s 2001]](https://image.slidesharecdn.com/probabilisticinterestingnessmeasures-130531012250-phpapp01/85/Probabilistic-Interestingness-Measures-An-Introduction-with-Bayesian-Belief-Networks-39-320.jpg)
![List Of Interestingness Measures (cont)
Monodimensional e+, e-
Support [Agrawal et al. 1996]
Ralambrodrainy [Ralambrodrainy, 1991]
Bidimensional - Inclusion
Descriptive-Confirm [Yves Kodratoff, 1999]
Sebag et Schoenauer [Sebag, Schoenauer, 1991]
Examples neg examples ratio (*)
Bidimensional – Inclusion – Conditional Probability
Confidence [Agrawal et al. 1996]
Wang index [Wang et al., 1988]
Laplace (*)
Bidimensional – Analogous Rules
Descriptive Confirmed-Confidence [Yves Kodratoff, 1999] (*)](https://image.slidesharecdn.com/probabilisticinterestingnessmeasures-130531012250-phpapp01/85/Probabilistic-Interestingness-Measures-An-Introduction-with-Bayesian-Belief-Networks-41-320.jpg)
![List Of Interestingness Measures (cont.)
Tridimensional – Analogous Rules
Causal Support [Kodratoff, 1999]
Causal Confidence [Kodratoff, 1999] (*)
Causal Confirmed-Confidence [Kodratoff, 1999]
Least contradiction [Aze & Kodratoff 2004] (*)
Tridimensional – Linear - Independent
Pavillon index [Pavillon, 1991]
Rule Interest [Piatetsky-Shapiro, 1991] (*)
Pearl index [Pearl, 1988], [Acid et al., 1991] [Gammerman, Luo, 1991]
Correlation [Pearson 1996] (*)
Loevinger index [Loevinger, 1947] (*)
Certainty factor [Tan & Kumar 2000]
Rate of connection[Bernard et Charron 1996]
Interest factor [Brin et al., 1997]
Top spin(*)
Cosine [Tan & Kumar 2000] (*)
Kappa [Tan & Kumar 2000]](https://image.slidesharecdn.com/probabilisticinterestingnessmeasures-130531012250-phpapp01/85/Probabilistic-Interestingness-Measures-An-Introduction-with-Bayesian-Belief-Networks-42-320.jpg)
![List Of Interestingness Measures (cont.)
Tridimensional – Nonlinear – Independent
Chi squared distance
Logarithmic lift [Church & Hanks, 1990] (*)
Predictive association [Tan & Kumar 2000] (Goodman & Kruskal)
Conviction [Brin et al., 1997b]
Odd’s ratio [Tan & Kumar 2000]
Yule’Q [Tan & Kumar 2000]
Yule’s Y [Tan & Kumar 2000]
Jaccard [Tan & Kumar 2000]
Klosgen [Tan & Kumar 2000]
Interestingness [Gray & Orlowska, 1998]
Mutual information ratio (Uncertainty) [Tan et al., 2002]
J-measure [Smyth & Goodman 1991] [Goodman & Kruskal 1959] (*)
Gini [Tan et al., 2002]
General measure of rule interestingness [Jaroszewicz & Simovici, 2001] (*)](https://image.slidesharecdn.com/probabilisticinterestingnessmeasures-130531012250-phpapp01/85/Probabilistic-Interestingness-Measures-An-Introduction-with-Bayesian-Belief-Networks-43-320.jpg)
![List Of Interestingness Measures (cont.)
Quadridimensional – Linear – independent
Lerman index of similarity[Lerman, 1981]
Index of Involvement[Gras, 1996]
Quadridimensional – likeliness (conditional probability?) of
dependence
Probability of error of Chi2 (*)
Intensity of Involvement [Gras, 1996] (*)
Quadridimensional – Inclusion – dependent – analogous rules
Entropic intensity of Involvement [Gras, 1996] (*)
TIC [Blanchard et al., 2004] (*)
Others
Surprisingness (*) [Freitas, 1998]
+ rules of exception [Duval et al. 2004]
+ rule distance, similarity [Dong & Li 1998]](https://image.slidesharecdn.com/probabilisticinterestingnessmeasures-130531012250-phpapp01/85/Probabilistic-Interestingness-Measures-An-Introduction-with-Bayesian-Belief-Networks-44-320.jpg)
![References & Bibliography
[Agrawal et al., 1993] R. Agrawal, T. Imielinsky et A. Swami. Mining associations rules between sets of items in large databases. Proc.
of ACM SIGMOD'93, 1993, p. 207-216
[Azé & Kodratoff, 2001] J. Azé et Y. Kodratoff. Evaluation de la résistance au bruit de quelques mesures d'extraction de règles
d'association. Extraction des connaissances et apprentissage 1(4), 2001, p. 143-154
[Azé & Kodratoff, 2001] J. Azé et Y. Kodratoff. Extraction de « pépites » de connaissances dans les données : une nouvelle approche et
une étude de sensibilité au bruit. Rapport d’activité du groupe gafoQualité de l’AS GafoDonnées. A paraître dans [Briand et al. 2004].
[Bayardo & Agrawal, 1999] R.J. Bayardo et R. Agrawal. Mining the most interesting rules. Proc. of the 5th Int. Conf. on Knowledge
Discovery and Data Mining, 1999, p.145-154.
[Bernadet 2000] M. Bernardet. Basis of a fuzzy knowledge discovery system. Proc. of Principles of Data Mining and Knowledge
Discovery, LNAI 1510, pages 24-33. Springer, 2000.
[Bernard et Charron 1996] J.-M. Bernard et C. Charron. L’analyse implicative bayésienne, une méthode pour l’étude des dépendances
orientées. I. Données binaires, Revue Mathématique Informatique et Sciences Humaines (MISH), vol. 134, 1996, p. 5-38.
[Berti-Equille 2004] L. Berti-équille. Etat de l'art sur la qualité des données : un premier pas vers la qualité des connaissances. Rapport
d’activité du groupe gafoQualité de l’AS GafoDonnées. A paraître dans [Briand et al. 2004].
[Blanchard et al. 2001] J. Blanchard, F. Guillet, et H. Briand. L'intensité d'implication entropique pour la recherche de règles de
prédiction intéressantes dans les séquences de pannes d'ascenseurs. Extraction des Connaissances et Apprentissage (ECA), Hermès
Science Publication, 1(4):77-88, 2002.
[Blanchard et al. 2003] J. Blanchard, F. Guillet, F. Rantière, H. Briand. Vers une Représentation Graphique en Réalité Virtuelle pour
la Fouille Interactive de Règles d’Association. Extraction des Connaissances et Apprentissage (ECA), vol. 17, n°1-2-3, 105-118, 2003.
Hermès Science Publication. ISSN 0992-499X, ISBN 2-7462-0631-5
[Blanchard et al. 2003a] J. Blanchard, F. Guillet, H. Briand. Une visualisation orientée qualité pour la fouille anthropocentrée de
règles d’association. In Cognito - Cahiers Romans de Sciences Cognitives. A paraître. ISSN 1267-8015
[Blanchard et al. 2003b] J. Blanchard, F. Guillet, H. Briand. A User-driven and Quality oriented Visualiation for Mining Association
Rules. In Proc. Of the Third IEEE International Conference on Data Mining, ICDM’2003, Melbourne, Florida, USA, November 19 - 22,
2003.
[Blanchard et al., 2004] J. Blanchard, F. Guillet, R. Gras, H. Briand. Mesurer la qualité des règles et de leurs contraposées avec le taux
informationnel TIC. EGC2004, RNTI, Cépaduès. 2004 A paraître.
[Blanchard et al., 2004a] J. Blanchard, F. Guillet, R. Gras, H. Briand. Mesure de la qualité des règles d'association par l'intensité
d'implication entropique. Rapport d’activité du groupe gafoQualité de l’AS GafoDonnées. A paraître dans [Briand et al. 2004].
[Breiman & al. 1984] L.Breiman, J. Friedman, R. Olshen and C.Stone. Classification and Regression Trees. Chapman & Hall,1984.
[Briand et al. 2004] H. Briand, M. Sebag, G. Gras et F. Guillet (eds). Mesures de Qualité pour la fouille de données. Revue des
Nouvelles Technologies de l’Information, RNTI, Cépaduès, 2004. A paraître.
[Brin et al., 1997] S. Brin, R. Motwani and C. Silverstein. Beyond Market Baskets: Generalizing Association Rules to Correlations. In
Proceedings of SIGMOD’97, pages 265-276, AZ, USA, 1997.
[Brin et al., 1997b] S. Brin, R. Motwani, J. Ullman et S. Tsur. Dynamic itemset counting and implication rules for market basket data.
Proc. of the Int. Conf. on Management of Data, ACM Press, 1997, p. 255-264.](https://image.slidesharecdn.com/probabilisticinterestingnessmeasures-130531012250-phpapp01/85/Probabilistic-Interestingness-Measures-An-Introduction-with-Bayesian-Belief-Networks-51-320.jpg)
![References & Bibliography
[Church & Hanks, 1990] K. W. Church et P. Hanks. Word association norms, mutual information and lexicography. Computational
Linguistics, 16(1), 22-29, 1990.
[Clark & Robin 1991] Peter Clark and Robin Boswell: Rule Induction with CN2: Some Recent Improvements. In Proceeding of the
European Working Session on Learning EWSL-91, 1991.
[Dong & Li, 1998] G. Dong and J. Li. Interestingness of Discovered Association Rules in terms of Neighborhood-Based Unexpectedness.
In X. Wu, R. Kotagiri and K. Korb, editors, Proc. of 2nd Pacific-Asia Conf. on Knowledge Discovery and Data Mining (PAKDD `98),
Melbourne, Australia, April 1998.
[Duval et al. 2004] B. Duval, A. Salleb, C. Vrain. Méthodes et mesures d’intérêt pour l’extraction de règles d’exception. Rapport
d’activité du groupe gafoQualité de l’AS GafoDonnées. A paraître dans [Briand et al. 2004].
[Fleury 1996] L. Fleury. Découverte de connaissances pour la gestion des ressources humaines. Thèse de doctorat, Université de Nantes,
1996.
[Frawley & Piatetsky-Shapiro 1992] Frawley W. Piatetsky-Shapiro G. and Matheus C., « Knowledge discovery in databases: an
overview », AI Magazine, 14(3), 1992, pages 57-70
[Freitas, 1998] A. A. Freitas. On Objective Measures of Rule Suprisingness. In J. Zytkow and M. Quafafou, editors, Proceedings of the
Second European Conference on the Principles of Data Mining and Knowledge Discovery (PKDD `98), pages 1-9, Nantes, France,
September 1998.
[Freitas, 1999] A. Freitas. On rule interestingness measures. Knowledge-Based Systems Journal 12(5-6), 1999, p. 309-315.
[Gago & Bento, 1998 ] P. Gago and C. Bento. A Metric for Selection of the Most Promising Rules. PKDD’98, 1998.
[Gray & Orlowska, 1998] B. Gray and M. E. Orlowska. Ccaiia: Clustering Categorical Attributes into Interesting Association Rules. In
X. Wu, R. Kotagiri and K. Korb, editors, Proc. of 2nd Pacific-Asia Conf. on Knowledge Discovery and Data Mining (PAKDD `98), pages
132 43, Melbourne, Australia, April 1998.
[Goodman & Kruskal 1959] L. A. Goodman andW. H. Kruskal. Measures of Association for Cross Classification, ii: Further discussion
and references. Journal of the American Statistical Association, ??? 1959.
[Gras et al. 1995] R. Gras, H. Briand and P. Peter. Structuration sets with implication intensity. Proc. of the Int. Conf. On Ordinal and
Symbolic Data Analysis - OSDA 95. Springer, 1995.
[Gras, 1996] R. Gras et coll.. L'implication statistique - Nouvelle méthode exploratoire de données. La pensée sauvage éditions, 1996.
[Gras et al. 2001] R. Gras, P. Kuntz, et H. Briand. Les fondements de l'analyse statistique implicative et quelques prolongements pour la
fouille de données. Mathématiques et Sciences Humaines : Numéro spécial Analyse statistique implicative, 1(154-155) :9-29, 2001.
[Gras et al. 2001b] R. Gras, P. Kuntz, R. Couturier, et F. Guillet. Une version entropique de l'intensité d'implication pour les corpus
volumineux. Extraction des Connaissances et Apprentissage (ECA), Hermès Science Publication, 1(1-2) :69-80, 2001.
[Gras et al. 2002] R. Gras, F. Guillet, et J. Philippe. Réduction des colonnes d'un tableau de données par quasi-équivalence entre
variables. Extraction des Connaissances et Apprentissage (ECA), Hermès Science Publication, 1(4) :197-202, 2002.
[Gras et al. 2004] R. Gras, R. Couturier, J. Blanchard, H. Briand, P. Kuntz, P. Peter. Quelques critères pour une mesure de la qualité des
règles d’association. Rapport d’activité du groupe gafoQualité de l’AS GafoDonnées. A paraître dans [Briand et al. 2004].
[Guillaume et al. 1998] S. Guillaume, F. Guillet, J. Philippé. Improving the discovery of associations Rules with Intensity of
implication. Proc. of 2nd European Symposium Principles of data Mining and Knowledge Discovery, LNAI 1510, p 318-327. Springer
1998.
[Guillaume 2002] S. Guillaume. Discovery of Ordinal Association Rules. M.-S. Cheng, P. S. Yu, B. Liu (Eds.), Proc. Of the 6th Pacific-
sia Conference on Advances in Knowledge Discovery and Data Mining, PAKDD 2002, LNCS 2336, pages 322-327 Springer 2002.](https://image.slidesharecdn.com/probabilisticinterestingnessmeasures-130531012250-phpapp01/85/Probabilistic-Interestingness-Measures-An-Introduction-with-Bayesian-Belief-Networks-52-320.jpg)
![References & Bibliography
[Guillet et al. 1999] F. Guillet, P. Kuntz, et R. Lehn. A genetic algorithm for visualizing networks of association rules. Proc. the 12th Int.
Conf. On Industrial and Engineering Appl. of AI and Expert Systems, LNCS 1611, pages 145-154. Springer 1999
[Guillet 2000] F. Guillet. Mesures de qualité de règles d’association. Cours DEA-ECD. Ecole polytechnique de l’université de Nantes.
2000.
[Hilderman & Hamilton, 1998] R. J. Hilderman and H. J. Hamilton. Knowledge Discovery and Interestingness Measures: A Survey.
(KDD `98), ??? New-York 1998.
[Hilderman et Hamilton, 2001] R. Hilderman et H. Hamilton. Knowledge discovery and measures of interest. Kluwer Academic
publishers, 2001.
[Hussain et al. 2001] F. Hussain, H. Liu, E. Suzuki and H. Lu. Exception Rule Mining with a Relative Interestingness Measure. ???
[Jaroszewicz & Simovici, 2001] S. Jaroszewicz et D.A. Simovici. A general measure of rule interestingness. Proc. of the 7th Int. Conf.
on Knowledge Discovery and Data Mining, L.N.C.S. 2168, Springer, 2001, p. 253-265
[Klemettinen et al. 1994] M. Klemettinen, H. Mannila, P. Ronkainen, H. Toivonen and A. I. Verkamo. Finding Interesting Rules from
Large Sets of Discovered Association Rules. In N. R. Adam, B. K. Bhargava and Y. Yesha, editors, Proc. of the Third International Conf. on
Information and Knowledge Management``, pages 401-407, Gaitersburg, Maryland, 1994.
[Kodratoff, 1999] Y. Kodratoff. Comparing Machine Learning and Knowledge Discovery in Databases:An Application to Knowledge
Discovery in Texts. Lecture Notes on AI (LNAI)-Tutorial series. 2000.
[Kuntz et al. 2000] P.Kuntz, F.Guillet, R.Lehn and H.Briand. A User-Driven Process for Mining Association Rules. In D. Zighed, J.
Komorowski and J.M. Zytkow (Eds.), Principles of Data Mining and Knowledge Discovery (PKDD2000), Lecture Notes in Computer
Science, vol. 1910, pages 483-489, 2000. Springer.
[Kodratoff, 2001] Y. Kodratoff. Comparing machine learning and knowledge discovery in databases: an application to knowledge
discovery in texts. Machine Learning and Its Applications, Paliouras G., Karkaletsis V., Spyropoulos C.D. (eds.), L.N.C.S. 2049, Springer,
2001, p. 1-21.
[Kuntz et al. 2001] P. Kuntz, F. Guillet, R. Lehn and H. Briand. A user-driven process for mining association rules. Proc. of Principles of
Data Mining and Knowledge Discovery, LNAI 1510, pages 483-489. Springer, 2000.
[Kuntz et al. 2001b] P. Kuntz, F. Guillet, R. Lehn, et H. Briand. Vers un processus d'extraction de règles d'association centré sur
l'utilisateur. In Cognito, Revue francophone internationale en sciences cognitives, 1(20) :13-26, 2001.
[Lallich et al. 2004] S. Lallich et O. Teytaud . Évaluation et validation de l’intérêt des règles d’association. Rapport d’activité du groupe
gafoQualité de l’AS GafoDonnées. A paraître dans [Briand et al. 2004].
[Lehn et al. 1999] R.Lehn, F.Guillet, P.Kuntz, H.Briand and J. Philippé. Felix : An interactive rule mining interface in a kdd process. In
P. Lenca (editor), Proc. of the 10th Mini-Euro Conference, Human Centered Processes, HCP’99, pages 169-174, Brest, France, September
22-24, 1999.
[Lenca et al. 2004] P. Lenca, P. Meyer, B. Vaillant, P. Picouet, S. Lallich. Evaluation et analyse multi-critères des mesures de qualité des
règles d’association. Rapport d’activité du groupe gafoQualité de l’AS GafoDonnées. A paraître dans [Briand et al. 2004].
[Lerman et al. 1981] I. C. Lerman, R. Gras et H. Rostam. Elaboration et évaluation d’un indice d’implication pour les données binaires.
Revue Mathématiques et Sciences Humaines, 75, p. 5-35, 1981.
[Lerman, 1981] I. C. Lerman. Classification et analyse ordinale des données. Paris, Dunod 1981.
[Lerman, 1993] I. C. Lerman. Likelihood linkage analysis classification method, Biochimie 75, p. 379-397, 1993.
[Lerman & Azé 2004] I. C. Lerman et J. Azé.Indidice probabiliste discriminant de vraisemblance du lien pour des données
volumineuses. Rapport d’activité du groupe gafoQualité de l’AS GafoDonnées. A paraître dans [Briand et al. 2004].](https://image.slidesharecdn.com/probabilisticinterestingnessmeasures-130531012250-phpapp01/85/Probabilistic-Interestingness-Measures-An-Introduction-with-Bayesian-Belief-Networks-53-320.jpg)
![References & Bibliography
[Liu et al., 1999] B. Liu, W. Hsu, L. Mun et H. Lee. Finding interesting patterns using user expectations. IEEE Transactions on
Knowledge and Data Engineering 11, 1999, p. 817-832.
[Loevinger, 1947] J. Loevinger. A systemic approach to the construction and evaluation of tests of ability. Psychological monographs,
61(4), 1947.
[Mannila & Pavlov, 1999] H. Mannila and D. Pavlov. Prediction with Local Patterns using Cross-Entropy. Technical Report,
Information and Computer Science, University of California, Irvine, 1999.
[Matheus & Piatetsky-Shapiro, 1996] C. J. Matheus and G. Piatetsky-Shapiro. Selecting and Reporting what is Interesting: The
KEFIR Application to Healthcare data. In U. M. Fayyad, G. Piatetsky-Shapiro, P.Smyth and R. Uthurusamy (eds), Advances in Knowledge
Discovery and Data Mining, p. 401-419, 1996. AAAI Press/MIT Press. [Meo 2000] R. Meo. Theory of dependence values, ACM
Transactions on Database Systems 5(3), p. 380-406, 2000.
[Padmanabhan et Tuzhilin, 1998] B. Padmanabhan et A. Tuzhilin. A belief-driven method for discovering unexpected patterns. Proc.
Of the 4th Int. Conf. on Knowledge Discovery and Data Mining, 1998, p. 94-100.
[Pearson, 1896] K. Pearson. Mathematical contributions to the theory of evolution. III. regression, heredity and panmixia. Philosophical
Transactions of the Royal Society, vol. A, 1896.
[Piatestsky-Shapiro, 1991] G. Piatestsky-Shapiro. Discovery, analysis, and presentation of strong rules. Knowledge Discovery in
Databases. Piatetsky-Shapiro G., Frawley W.J. (eds.), AAAI/MIT Press, 1991, p. 229-248
[Popovici, 2003] E. Popovici. Un atelier pour l'évaluation des indices de qualité. Mémoire de D.E.A. E.C.D., IRIN/Université
Lyon2/RACAI Bucarest, Juin 2003
[Ritschard & al., 1998] G. Ritschard, D. A. Zighed and N. Nicoloyannis. Maximiser l`association par agrégation dans un tableau croisé.
In J. Zytkow and M. Quafafou, editors, Proc. of the Second European Conf. on the Principles of Data Mining and Knowledge Discovery
(PKDD `98), Nantes, France, September 1998.
[Sebag et Schoenauer, 1988] M. Sebag et M. Schoenauer. Generation of rules with certainty and confidence factors from incomplete
and incoherent learning bases. Proc. of the European Knowledge Acquisition Workshop (EKAW'88), Boose J., Gaines B., Linster M.
(eds.), Gesellschaft für Mathematik und Datenverarbeitung mbH, 1988, p. 28.1-28.20.
[Shannon & Weaver, 1949] C.E. Shannon et W. Weaver. The mathematical theory of communication. University of Illinois Press,
1949.
[Silbershatz &Tuzhilin,1995] Avi Silberschatz and Alexander Tuzhilin. On Subjective Measures of Interestingness in Knowledge
Discovery, (KD. & DM. `95) ??? , 1995.
[Smyth & Goodman, 1991] P. Smyth et R.M. Goodman. Rule induction using information theory. Knowledge Discovery in Databases,
Piatetsky- Shapiro G., Frawley W.J. (eds.), AAAI/MIT Press, 1991, p. 159-176
[Tan & Kumar 2000] P. Tan, V. Kumar. Interestingness Measures for Association Patterns : A Perspective. Workshop tutorial (KDD
2000).
[Tan et al., 2002] P. Tan, V. Kumar et J. Srivastava. Selecting the right interestingness measure for association patterns. Proc. of the 8th
Int. Conf. on Knowledge Discovery and Data Mining, 2002, p. 32-41.](https://image.slidesharecdn.com/probabilisticinterestingnessmeasures-130531012250-phpapp01/85/Probabilistic-Interestingness-Measures-An-Introduction-with-Bayesian-Belief-Networks-54-320.jpg)

This document discusses various approaches to measuring the interestingness of patterns discovered during data mining. It describes objective interestingness measures based only on the data, like conciseness, generality, reliability, peculiarity and diversity. Subjective measures take into account user knowledge and expectations, evaluating novelty and surprisingness. Semantic measures consider pattern semantics and explanations, focusing on utility and actionability. The document also discusses limitations of typical objective measures like support and confidence, and outlines subjective approaches involving user impressions at different levels of knowledge granularity.