Downloaded 168 times


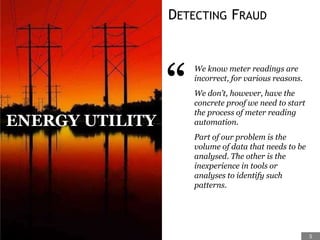
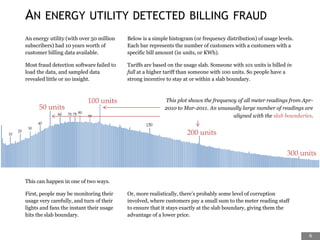
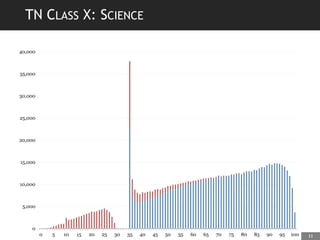
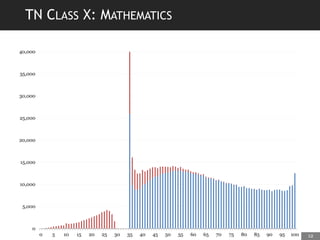
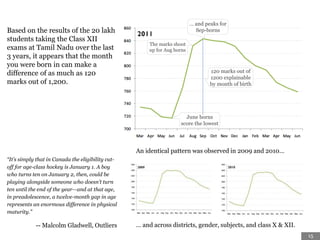
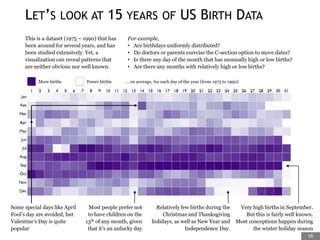
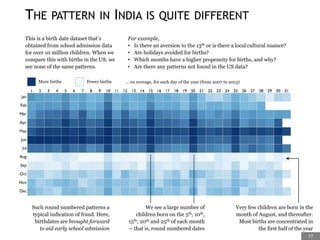


The document discusses exploratory data analysis and provides examples of how it can be used. It summarizes two case studies: one where an energy utility detected billing fraud by analyzing meter reading patterns, and another where month of birth was found to correlate with exam scores for students in Tamil Nadu. The document then outlines the exploratory data analysis process and provides a high-level overview of U.S. and Indian birth date patterns identified through analysis of large datasets.


![제 23회 보아즈(BOAZ) 빅데이터 컨퍼런스 - [MBOAX] : ABSA를 활용한 소비자 반응 분석 기반 운영 효율화 대시보드 설계](https://cdn.slidesharecdn.com/ss_thumbnails/3-1boaz23rdconferencemboax-260203102709-9d519923-thumbnail.jpg?width=640&height=640&fit=bounds)


