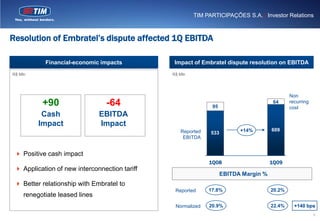
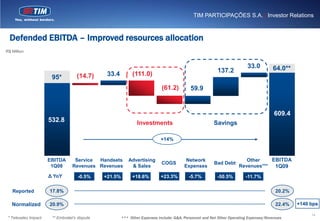
TIM reported its 1Q09 results, focusing on restructuring, economics pressures, and priorities for 2Q09. Key accomplishments in the restart phase included cleaning up over 1 million inactive customer lines, resolving a dispute with Embratel that improved cash flow, and improving network quality to become the #2 operator. TIM also continued efficiency initiatives and signed an acquisition that will help capture synergies going forward. However, revenues remained flat due to customer base erosion in post-paid and declining pre-paid usage. Priorities for 2Q09 include focusing on value and reducing customer turnover.
- The company reported higher earnings per share compared to the previous year's quarter, driven by revenue growth from acquisitions and higher commercial rental and supply chain solutions volumes.
- Fleet Management Solutions saw revenue growth from commercial rentals and fuel services, but earnings were impacted by higher maintenance costs and investments in initiatives.
- Supply Chain Solutions significantly grew revenue and earnings through the TLC acquisition and increased freight volumes.
- Total revenue and earnings per share increased compared to previous year, though some segments faced cost pressures.
- Revenue and earnings for the company increased in the first quarter compared to the prior year.
- Earnings per share were $0.77, up 20% from the prior year.
- The company is increasing its full year 2006 earnings forecast to a range of $3.82 to $3.97 per share.
1) Amazon reported Q3 2008 financial results with net sales growing 31% year-over-year to $4.3 billion.
2) Operating income increased 26% to $154 million and net income grew 48% to $118 million.
3) International sales grew 46% year-over-year while electronics and other general merchandise sales increased 51%.
FMS operating revenue was up 5% year-over-year to $747.6 million due to 6% growth in contractual revenue including full service lease and contract maintenance revenue. FMS net before tax earnings increased 13% to $91.4 million and the net before tax earnings percent of operating revenue increased 90 basis points to 12.2%. FMS earnings benefited from improved contractual business performance, lower sales and marketing costs, and acquisitions.
TIM Brasil saw difficulties in 2008, including a loss of market share below guidance, revenue growth below expectations, and a lower postpaid customer base. However, the company met guidance for EBITDA margin and saw increases in ARPM and reductions in SAC and bad debt. Looking ahead, TIM Brasil outlined a re-launch plan with brand repositioning and new offerings to address issues like a loss of top-of-mind preference and declining revenue share. The competitive mobile market in Brazil saw strong growth but also increasing churn pressure.
1) Amazon reported Q3 2011 financial results with net sales up 44% year-over-year to $10.9 billion.
2) However, operating income decreased significantly, down 71% to $79 million compared to the same period last year.
3) Free cash flow also declined 17% year-over-year to $1.5 billion, as the company continues investing heavily in new business opportunities.
The document provides an overview of the company's third quarter 2005 earnings conference call, including highlights such as earnings per share increasing 20% compared to the prior year, business segment results with revenue and earnings increases across all segments, and debt to equity ratios remaining below long-term targets while supporting continued growth.
ApresentaçãO Citi Annual Brazil Equity ConferenceTIM RI
The document discusses TIM Participacoes' performance in the first quarter of 2009. It provides an overview of the competitive mobile market in Brazil and TIM's market share. It also recaps TIM's Q1 2009 results, including its customer base growth, revenue breakdown, cost efficiency measures, and EBITDA margins.
ApresentaçãO Bank Of America & Merrill Lynch Annual Gem ConferenceTIM RI
1) The document discusses TIM Participacoes' performance in Q1 2009 and competitive landscape in Brazil.
2) It recaps TIM's Q1 results, fundamentals around its network leadership and high-value customer base, and repositioning of its brand.
3) The document analyzes pressures on TIM's top line in Q1 2009 including customer base erosion, revenue deceleration, and ARPU dilution largely due to its customer mix shift toward pre-paid.
The document is a results presentation for TIM Participações S.A.'s third quarter results. It contains the following key points in 3 sentences:
The presentation highlights growth acceleration in the third quarter with a 26.1% increase in customer base year-over-year and revenues growing 18.9% year-over-year. EBITDA grew 11.3% year-over-year with a normalized growth rate of 18.7%, and net income increased 116% year-over-year. The results demonstrate the company's ability to combine growth and profitability through initiatives focusing on community expansion, voice services, and increasing data usage.
- The company reported first quarter 2005 earnings per share of $0.64, up from $0.53 in the first quarter of 2004. This included a one-time recovery and excluded gains from real estate sales.
- Fleet Management Solutions revenue increased 10% and operating revenue grew 5% compared to the prior year, driven by acquisitions and commercial rental growth. This led to a 28% increase in net earnings before tax.
- Supply Chain Solutions revenue rose 8% due to new business, but earnings declined due to lower margins in some automotive accounts. Dedicated Contract Carriage earnings also declined due to contract losses and higher costs.
Amazon.com Q4 2009 Financial Results Conference Call SlidesMichael Sidney Levy
- Q4 2009 financial results showed strong growth with net sales up 42% year-over-year to $9.5 billion and GAAP operating income up 75% to $476 million.
- International sales grew 49% year-over-year with over 45% of worldwide revenue coming from outside North America.
- Free cash flow increased 114% year-over-year to $2.9 billion driven by strong operating cash flow.
- Fleet Management Solutions operating revenue increased 2% to $713.9 million driven by a 6% increase in contractual revenue, while commercial rental revenue declined 13% and fuel services revenue declined 3%.
- Net before tax earnings for FMS increased 8% to $80.8 million and net before tax earnings as a percentage of operating revenue increased to 11.3% from 10.7% in the prior year.
- The company reaffirmed its full year 2007 earnings forecast of $4.30 to $4.40 per share, with second quarter earnings forecasted to be $1.04 to $1.07 per share.
This document is the consolidated statement of operations and financial position for DTE Energy Company and its subsidiaries for the fourth quarter and full year of 2003. Some key highlights include:
- For the full year 2003, net income was $521 million compared to $586 million in 2002, a decrease of 18%. Earnings per diluted share were $3.09 compared to $3.55 in 2002, a decrease of 13%.
- For the fourth quarter of 2003, net income was $229 million compared to $203 million in 2002, an increase of 13%. Earnings per diluted share were $1.36 compared to $1.21 in 2002, an increase of 13%.
- Total operating revenues
Alltel Corporation reported its financial results for the first quarter of 2008. Service revenues increased 11% compared to the first quarter of 2007, however operating income decreased 21% and net income decreased 154% due to losses from continuing operations. Capital expenditures also decreased 14% year-over-year. The number of customers grew 9% to over 13 million, while average monthly cash costs per customer remained relatively flat at $32.53.
- Comcast reported increased revenue, operating cash flow, and operating income for Q1 2009 compared to Q1 2008. Revenue grew 5% to $8.8 billion while operating cash flow grew 8% to $3.4 billion and operating income grew 16% to $1.8 billion.
- EPS grew 13% to $0.27 per share from $0.24 in Q1 2008. Adjusted EPS, which excludes a one-time gain, grew 42% to $0.27.
- Free cash flow increased 95% to $1.4 billion driven by lower capital expenditures and growth in operating cash flow.
1) Amazon's Q1 2009 financial results showed increases in key metrics such as net sales, operating income, net income, and free cash flow compared to Q1 2008. Net sales grew 18% to $4.9 billion while free cash flow increased 82% to $1.4 billion.
2) The international segment saw the strongest growth with net sales increasing 34% year-over-year to $1.2 billion. Electronics and other general merchandise also experienced strong growth with net sales rising 42% to $1.2 billion.
3) While actual results could differ from projections, Amazon expects to continue optimizing free cash flow and achieving long term goals such as triple digit return on invested capital.
- The company reported second quarter earnings per share of $0.98, up from $0.97 in the second quarter of 2004. Revenue increased 10% compared to the second quarter of 2004.
- Fleet Management Solutions revenue increased 9% and earnings increased 8% compared to the second quarter of 2004, driven by improved used vehicle sales and rental results.
- The company reaffirmed its full year 2005 earnings forecast of $3.42-$3.52 per share, which includes a $0.12 state tax benefit.
Bharat Petroleum Investor presentation q4 - 2nd june 2011Bharat Petroleum
Bharat Petroleum Corporation Ltd. (BPCL) is India's second largest oil marketing company. The document provides an overview of BPCL's group performance in FY 2010-11 including physical and financial highlights. Key points include BPCL achieving a market sales volume of 29.27 MMT, crude throughput of 21.78 MMT, and profit after tax of Rs. 1547 crore. It also summarizes BPCL's retail strategies such as expanding outlets in rural areas and on highways to increase its market share of motor spirit and diesel. Major projects completed by BPCL include the Kochi CEMP expansion to produce fuels meeting Euro III-IV standards.
Hera Group achieved positive financial results in 2009 despite the economic slowdown. Revenues grew 13% to over 4 billion euros due to market expansion, tariff increases, and favorable energy prices. Earnings before interest, taxes, depreciation and amortization grew 7.4% to 567 million euros through actions on internal and external growth. The company strengthened its market position through acquisitions and investments totaling nearly 400 million euros. Looking ahead, Hera expects further growth in 2010 from a new gas distribution tariff and signs of recovery in energy consumption.
La prostitución se define como la explotación de la sexualidad de una persona con fines económicos a través del uso de su cuerpo para ofrecer servicios sexuales. Más de 1 millón de mujeres en Colombia y una de cada 4 mujeres en Bogotá que se dedican a la prostitución son menores de 18 años. Aunque la prostitución de mujeres es la más conocida, también hay un número cada vez mayor de hombres y niños que se dedican a la prostitución.
Tips Memasukkan Data Pelajar Ke System Smm V422zafeen zafeen
1. Buka SMM Ver4 pada desktop dan klik "menu utama", kemudian "ADD-INS" dan "MAKLUMAT"
2. Klik "MURID" untuk memuatkan medan fokus kerja
3. Klik "TAMBAH REKOD" dan isi ruangan data pelajar satu persatu
This document lists the various artistic and extracurricular activities of a student named Aaron Kuhn from Albert Einstein High School in 2010. It includes awards, performances, and teaching residencies in visual arts, dance, music, and photography from organizations like the American Dance Institute and Maryland Classic Youth Orchestra.
Mobile 1 is equipped with an automated external defibrillator (AED), oxygen, oxygen adjuncts, and an airway suctioning device to provide emergency medical care. Mobile 3 is cleaned daily. This unit is secured in a storage space next to the north bathroom. Their mission is to provide optimal public service and marine safety as front line emergency first responders for the marine environment.
The document provides an overview of the City of Dania Beach self-funded group health plan as of July 2010. It summarizes the current enrollment which is 214 total members, with 67% being active employees. It also reviews the plan experience from October 2008 to September 2009 and October 2009 to June 2010, showing revenue, claims, and net medical claims. Finally, it compares benefits and costs to other local plans and outlines upcoming health care reform changes.
This article intended to analyze what are the main techniques (either classic or agile) used in software development in small and medium-sized companies, ranking them on a use-level scale and looking for the level of agility inside those companies.
This document discusses an expo to raise public awareness about emergency response equipment and safety information. It will feature informational flyers on rip currents and poisonous plants/animals, and display Mobiles 1, 4, and medical response equipment for the public to see.
The document does not contain any text to summarize. It only contains blank lines and the letter "V". In 3 sentences or less, I am unable to provide a meaningful summary as there is no information given in the document to summarize.
GroupL was founded in 1973 in Kolkata, India to provide training and placement services to help people earn better livelihoods. It has since expanded to 13 countries and provides training in industries like retail, hospitality, healthcare, facilities management and security. GroupL trains candidates in various skills before placing them with client companies. It also offers HR consulting services like auditing clients' recruitment processes and resolving labor disputes. The company aims to empower migrant workers through skills development and ethical recruitment practices.
The document discusses the benefits of meditation for reducing stress and anxiety. Regular meditation practice can help calm the mind and body by lowering heart rate and blood pressure. Studies have shown that meditating for just 10-20 minutes per day can have significant positive impacts on both mental and physical health over time.
1) O documento apresenta informações sobre a TIM Brasil, incluindo sua estratégia, portfólio e desempenho financeiro.
2) A estratégia da TIM foca em transformar de voz para dados, defender o valor da base pré-paga e aumentar a participação de clientes de médio e alto valor.
3) Os dados mostram o desempenho da TIM no mercado brasileiro de telecomunicações nos últimos anos.
This document discusses trademarks in Google AdWords. It explains that advertisers can bid on keywords to have their ads appear in search results. While the highest bidder does not always get the top ranking, some trademark owners argue this is an improper attempt to profit from their goodwill. The document reviews some court cases related to this issue, with courts generally ruling that using trademarks as keywords does not necessarily violate trademark law if the marks do not appear in the ads themselves and their use can be considered fair.
1) TIM Brasil presented its 4Q09 results, showing signs of a turnaround from difficulties in previous years. 2) Key metrics like subscriber base, traffic, ARPU and revenues all improved quarter-over-quarter. 3) The subscriber base grew to 41.1 million, ARPU reached R$27, and service revenues increased 5.4% compared to last quarter.
This document summarizes TIM Participações S.A.'s presentation at the Morgan Stanley Latin America CEO Conference in January 2010. It discusses TIM's issues in 2008 with its strategic approach and offerings. TIM's re-launch plan focused on a new commercial approach with simplified post-paid and pre-paid plans. Some key achievements highlighted were reversing its declining market share, growing its pre-paid customer base, and ending the erosion of its post-paid base through its new plans and commercial efforts.
This document provides an update on TIM Participações S.A.'s relaunch plan following issues in 2008. It summarizes that TIM reversed declining trends by launching new commercial approaches, including segmented plans, a "chip only" business model, and exclusive handsets. This helped grow TIM's subscriber base and market share while self-financing relaunch costs through efficiency gains. Key achievements included improved brand awareness, customer satisfaction recovery, and confirming its position as the number 2 mobile operator in Brazil by quality metrics.
This document provides an update on TIM Participações S.A.'s relaunch plan following issues in 2008. It summarizes that TIM reversed declining trends by launching new commercial approaches, including segmented service plans, a "chip only" business model, and exclusive handsets. This helped grow TIM's subscriber base and market share while self-financing relaunch costs through improved efficiency. Key achievements included improved brand awareness, customer satisfaction recovery, and confirming its position as the number 2 mobile operator in Brazil by quality metrics.
This document discusses TIM Participações S.A.'s re-launch plan update presented at a Latin American CEO conference in January 2010. It summarizes issues in 2008, including strategic indecision, an obsolete offering, and shortcuts taken to boost short-term profitability, which led to loss of competitiveness. The re-launch plan focuses on improving brand positioning and network quality, growing the subscriber base through new plans, and achieving self-financing through cost reductions. Key achievements highlighted include reversing the declining market share trend, improving customer satisfaction levels, and ending the erosion of its post-paid subscriber base.
This document discusses TIM Participações S.A.'s re-launch plan update presented at a Latin American CEO conference in January 2010. It summarizes issues in 2008, including strategic indecision, an obsolete offering, and shortcuts taken to boost short-term profitability, which led to loss of competitiveness. The re-launch plan focuses on improving brand positioning and network quality, growing the subscriber base through new plans, and achieving self-financing through efficiency initiatives. Key achievements highlighted include reversing market share declines, improving customer satisfaction levels, and ending the erosion of its post-paid subscriber base.
- Revenue and earnings for the company increased in the first quarter compared to the prior year.
- Earnings per share were $0.77, up 20% from the previous year.
- The company is increasing its full year 2006 earnings forecast to a range of $3.82 to $3.97 per share.
The document provides a presentation of TIM Participações S.A.'s 4Q09 results. Some key points:
1) TIM Brasil has undergone a repositioning track over the past 15 months to reverse client losses and return to growth, focusing on offer innovation, quality recovery, and efficiency savings of over R$1 billion.
2) 4Q09 results show signs of turnaround with growing subscriber base, traffic, ARPU and revenues increasing quarter-over-quarter. EBITDA margin expanded to 28.2% in 4Q09.
3) For the full year 2009, EBITDA increased 5.6% and net profit grew 29% compared to 2008,
- Tempo Assist saw growth in its health, dental, and assistance segments in 2009 through acquisitions and new partnerships.
- Key events included implementing SAP, rebranding as Tempo Assist, and receiving approval for its Unibanco Saúde acquisition.
- The segments achieved increased revenues and beneficiaries. Dental and health saw particularly strong growth while maintaining stable costs.
1) TIM presented its strategic plan update which focuses on 5 key tasks over the next 3 years: grabbing growth opportunities in voice, mobile data, and convergence; building a solid network; and improving efficiency.
2) In 2009, TIM repositioned itself as the #2 mobile operator in Brazil through network and service quality improvements as well as an efficiency plan.
3) Looking ahead, TIM aims to maintain leadership in key metrics like ARPU while growing its customer base through innovative offerings in areas like voice, mobile data, and convergence with fixed line services.
- Fleet Management Solutions operating revenue increased 2% to $713.9 million driven by a 6% increase in contractual revenue, while commercial rental revenue declined 13% and fuel services revenue declined 3%.
- Net before tax earnings for FMS increased 8% to $80.8 million, with earnings as a percentage of operating revenue increasing to 11.3% from 10.7% in the prior year.
- The company reaffirmed its full year 2007 earnings forecast of $4.30 to $4.40 per share, with second quarter earnings forecasted at $1.04 to $1.07 per share.
TIM Participações S.A. reported its results for the second quarter of 2008. [1] The company saw a 1% growth in average revenue per user (ARPU) despite an overall market drop, supported by increased minutes of use. [2] Value-added services revenue grew 21% quarter-over-quarter and 49% year-over-year. [3] EBITDA increased 19% quarter-over-quarter to R$637 million, with a recovering EBITDA margin of 20.0%, despite partial spillover of trends from the first quarter of 2008.
This document provides an overview of TIM Participacoes S.A.'s operational results for 4Q08 compared to previous periods. Some key highlights include:
- Total subscriber lines grew 3.4% quarter-over-quarter and 16.5% year-over-year to 36.4 million lines.
- Prepaid lines increased 5.1% quarter-over-quarter and 21.8% year-over-year while postpaid lines decreased 3.7% quarter-over-quarter and 3.0% year-over-year.
- Market share declined slightly to 24.2% while the total wireless subscriber base in Brazil grew over 24.5% year-over-year.
- The company reported higher earnings per share for the first quarter of 2008 than the first quarter of 2007, though total revenue was down due to a change in how a supply chain customer's transportation revenue was reported.
- Revenue for the Fleet Management Solutions segment grew due to increased contractual revenue and commercial rental revenue, as well as favorable foreign exchange rates.
- Supply Chain Solutions revenue declined from a change in revenue reporting for a transportation customer, though operating revenue increased due to foreign exchange and new business. Earnings declined due to various cost increases and reduced activity with some customers.
- Dedicated Contract Carriage revenue was slightly lower due to non-renewed contracts but earnings increased with lower insurance costs and better performance.
FMS operating revenue was up 5% year-over-year to $747.6 million due to 6% growth in contractual revenue including full service lease and contract maintenance revenue. FMS net before tax earnings increased 13% to $91.4 million and the net before tax earnings percent of operating revenue increased 90 basis points to 12.2%. FMS earnings benefited from improved contractual business performance, lower sales and marketing costs, and acquisitions.
Telecom Italia Group reported its 1Q09 results, focusing on cost control and cash flow generation. Revenues declined 3.8% organically due to challenges in the domestic market from channel restructuring and the economy. However, EBITDA was largely stable as cash costs fell 7.5%. Looking ahead, Telecom Italia will continue restructuring sales channels and controlling costs while implementing new offers to boost revenues in key segments.
Strategic Outlook - 2009 Results and the 2010-2012 Strategic Plan Update (Luc...Gruppo TIM
1) TIM Brasil achieved consistent quarterly growth in 2009 by repositioning through improving network quality and customer satisfaction, launching innovative plans, and implementing an efficiency plan.
2) TIM's strategy from 2009-2012 is to create value by grabbing growth opportunities in voice, mobile data, and convergence, while improving efficiency.
3) Key goals include maintaining voice leadership, boosting mobile data usage as network coverage expands, and attacking fixed incumbents through convergence offers and partnerships.
- The company reported third quarter 2006 earnings per share of $1.06, up 8% from the prior year. Excluding a pension accounting charge, EPS was $1.12, up 14%.
- All business segments saw revenue growth. Fleet Management Solutions revenue was up 5% and Supply Chain Solutions revenue increased 19%.
- The debt to equity ratio increased to 160% at the end of the third quarter of 2006, compared to the long term target midpoint of 125-150%.
- The company reported third quarter 2006 earnings per share of $1.06, up 8% from the prior year. Excluding a pension accounting charge, EPS was $1.12, up 14%.
- All business segments saw revenue growth. Fleet Management Solutions revenue was up 5% and Supply Chain Solutions revenue increased 19%.
- The company's debt to equity ratio was 160% at the end of the third quarter 2006, an increase from 143% at the end of 2005 but still below the long-term target range.
This document discusses the business environment and 1Q06 highlights for a company. It saw 23% CAGR in card base expansion in 2006 and competition differentiation through independence. Gross revenue was up 28% YoY in 1Q06 driven by increased market share in profitable segments like CardSystem and MarketSystem. Key strategies for 2006 include expanding market share in cards and markets, implementing a Caixa project, and boosting profits in TeleSystem and Credit&Risk units.
TIM Part - Apresentação Institucional - 2T20TIM RI
O documento fornece uma visão geral do mercado brasileiro de telecomunicações. Apresenta dados sobre a economia brasileira, classes sociais, desemprego, endividamento e confiança do consumidor, destacando os impactos da crise e da pandemia. Também compara o mercado brasileiro com outros países, mostrando que o Brasil possui a 5a maior base de clientes móveis do mundo, mas com oportunidade de melhorar o ARPU.
This document provides an overview of TIM Brasil, including its business segments, strategy, and financial highlights. It discusses TIM's position as a challenger operator in Brazil with national presence and the best 4G coverage. It also outlines TIM's fiber infrastructure and initiatives in connectivity solutions, IoT, and residential broadband. The document reviews TIM's 2019 financial results and highlights growth in revenue, EBITDA, margins, and TIM Live. It also discusses TIM's focus on ESG and digital inclusion programs.
The document is a presentation by TIM Brasil for investors that covers several topics:
- An overview of TIM Brasil including its history, financial results, and corporate governance practices.
- Analysis of the Brazilian mobile market trends showing a shift to mobile data and postpaid subscribers as well as network upgrades.
- TIM Brasil's positioning in the market with a focus on mobile, particularly growing its postpaid base, and its network and service investments.
- Highlights of TIM Brasil's financial and operational results and KPIs in recent years showing consistent growth above market averages.
This document is a presentation by TIM Brasil to investors in June 2020. It summarizes the impacts of COVID-19 on Brazil, including major economic impacts like a decline in GDP forecasts and a drop in retail sales. It also discusses government measures taken in response like assistance payments and tax relief. The presentation then discusses TIM's quick response to the pandemic to care for employees, customers, and society. It provides an overview of the mixed impacts on TIM's business so far and its strategic pillars for the future, including investing in infrastructure, pursuing disruptive efficiency, growing its mobile and ultra-broadband businesses, and developing new revenue sources.
This document provides an institutional presentation by TIM Brasil for the 1st quarter of 2020. It includes the following sections:
- About TIM - Provides an overview of TIM Brasil as an operator with national presence and best 4G coverage, as well as its fiber network, residential broadband, IoT, and financial highlights for 2019.
- Market Overview - Discusses the Brazilian market context, including the economic environment, consumer demographics, and trends showing increased data usage and prominence of internet/mobile services.
- Infrastructure - Will describe TIM's network infrastructure.
- Strategy and Positioning - Will outline TIM's strategic priorities and positioning.
- Operating Evolution -
O documento apresenta uma visão geral do mercado brasileiro de telecomunicações no 1T20. A economia brasileira enfrenta desafios como a lenta recuperação e o impacto da pandemia, mas o setor ainda é relevante globalmente e oferece oportunidades de crescimento de receita média por usuário. A apresentação também discute a dinâmica do consumidor brasileiro e suas classes sociais.
The document provides an overview of TIM Brasil's business as of April 2020. It discusses TIM's market positioning in Brazil as the country transitions to increased mobile internet and data usage. TIM has transformed its customer base from primarily prepaid to incorporating more postpaid subscribers. The presentation also outlines TIM's portfolio of mobile and home broadband products and services to address evolving customer needs.
TIM Brasil's 4Q19 institutional presentation provides an overview of the company, the Brazilian telecommunications market, TIM's strategy and financial results. Some key points:
- TIM is Brazil's second largest mobile service provider and has the best 4G network coverage nationwide. It is expanding its fiber network and residential broadband customer base.
- The Brazilian economy showed slow recovery in 2019 but structural drivers point to improving conditions. Mobile internet usage is growing while traditional fixed services decline.
- TIM's strategy focuses on leveraging infrastructure investments, expanding fiber broadband and driving digital transformation. In 4Q19 it achieved its highest ever EBITDA and margin as well as strong cash flow growth.
1) O documento apresenta os resultados financeiros da TIM Brasil no 4o trimestre de 2019.
2) Apresenta informações sobre a estrutura acionária, governança corporativa e compromisso com a sustentabilidade da empresa.
3) Fornece uma visão geral do mercado brasileiro de telecomunicações, incluindo dados sobre o cenário macroeconômico e tendências de consumo.
[1] O documento apresenta o plano estratégico da TIM Brasil para os anos de 2020 a 2022.
[2] O plano visa evoluir iniciativas já implementadas e transformar habilidades nos próximos 3 anos, focando em infraestrutura, eficiência disruptiva, móvel, banda larga fixa, novas fontes de receita e ESG.
[3] Detalha investimentos em rede móvel e fixa, transformação digital, eficiência de processos, mudança do foco de volume para valor no segmento móvel e
This document provides a summary of TIM Brasil's strategic plan for 2020-2022. The strategic plan has two pillars - evolve and transform. Under evolve, TIM aims to move from volume to value in mobile business and grow broadband with financial discipline. Under transform, TIM aims to implement new operating models, drive additional growth through adjacent markets, and focus on infrastructure, disruptive efficiency, mobile, UBB, new revenue sources, and ESG. The plan outlines initiatives across these areas around network expansion, IT transformation, efficiency improvements, and leveraging assets in new business areas like IoT and mobile advertising.
TIM Participações S.A. and its subsidiary TIM S.A. released an update to their 2020-2022 Strategic Plan and guidance. The update reaffirms commitments to (1) cost control measures to improve profitability and exceed a 40% EBITDA margin by 2022, (2) efficient capital allocation focused on network and IT infrastructure projects, and (3) continued expansion of cash generation by growing the EBITDA-CAPEX over revenues indicator above 20%. The strategic plan update is presented after TIM achieved many of its 2019-2021 plan goals despite a slower economic recovery than projected. The new plan targets mid-single digit service revenue growth and EBITDA growth annually through 2022.
O documento resume o plano estratégico 2020-2022 da TIM Participações S.A. e sua subsidiária TIM S.A. para os próximos 3 anos. O plano estratégico mantém os pilares de 2019-2021 com foco em (1) preparar a infraestrutura para o futuro com 5G e automação, (2) mudar do volume para o valor no negócio móvel, (3) capturar oportunidades de crescimento na banda larga fixa, e (4) aprimorar a eficiência para manter a liderança
This document provides an overview and summary of TIM Brasil's 3Q19 financial results. Some key highlights include:
- Service revenues grew 1.0% YoY in 3Q19, with gradual and continuous growth acceleration.
- EBITDA grew 6.8% YoY in 3Q19, with EBITDA margin expanding to 39.6% in 3Q19 from 37.9% in 3Q18.
- Solid cash generation with R$4.2 billion in service revenues and R$1.7 billion in EBITDA in 3Q19.
This document provides an overview and summary of TIM Brasil's company presentation from December 2019. The 3-sentence summary is:
TIM Brasil has transformed its customer base through migration from prepaid to postpaid plans, supporting revenue growth from prepaid declining and postpaid and other revenues increasing. The presentation outlines TIM's market positioning, recent financial results for 3Q19, and its strategic plan for 2019-2021 to further the customer base transformation and consolidate growth through investments in quality, price, and an expanded portfolio. Financial results for 3Q19 are presented on a pro forma basis excluding impacts from new IFRS accounting standard adoptions for comparability over time.
O documento apresenta os resultados financeiros da TIM Brasil no 3T19, discutindo sua posição no mercado, estratégia e desempenho operacional e financeiro. Apresenta também as perspectivas da empresa para o futuro.
TIM Brasil held an institutional presentation for the third quarter of 2019. The presentation provided an overview of TIM's business including its position in the Brazilian market, operational and financial highlights, and outlook. It noted that TIM is the #2 mobile service revenue operator in Brazil with national presence and the best 4G coverage. It also discussed the Brazilian telecommunications market trends including growing data usage and shift to postpaid plans. The presentation contained sections on TIM's strategy, operating and financial evolution, and future opportunities in areas like 5G and fiber broadband.
Tim Part's Presentation - CS 2019 TechFin & Telecom ConferenceTIM RI
1) TIM Participações discussed expanding into new markets like financial services and mobile advertising by leveraging its existing assets such as partnerships, sales channels, big data analytics, and billing capabilities.
2) TIM's prepaid digital wallet has over 33 million users transacting over R$513 million per month on telecom, content and other services. It is also expanding into microfinance and insurance.
3) TIM has a strong salesforce through its own shops and resellers, and its app has over 11 million users that help increase service acquisition and customer engagement.
This presentation provides an overview of TIM Brasil, the Brazilian telecommunications subsidiary of Telecom Italia. It summarizes TIM's solid financial and operational results in recent years, with growing revenue, EBITDA, and margins. It also outlines key trends in the Brazilian mobile market like increasing data usage and the transition to postpaid plans. Finally, it positions TIM as well-suited to capitalize on new demands through its fiber network and focus on customer experience as it executes a consolidation strategy from 2019-2021.
O documento apresenta uma visão geral do mercado brasileiro de telecomunicações e das tendências do setor. Apresenta dados sobre a população brasileira, situação econômica, mercado móvel global e hábitos dos consumidores, destacando o crescimento do uso de dados móveis e aplicativos.
2. TIM PARTICIPAÇÕES S.A. | Investor Relations
TIM re-launch plan
Economics Pressure Priorities
Restructuring on
1Q09 2Q09
Top Line
• Strategy and Organization • EBITDA Margin • Flat revenues: • Focus on Value:
• Customer Base clean-up defended - Customer base erosion - Push on Post-paid
• Embratel’s dispute resolution • Efficiency improved on post-paid (long tail) - Reduce Portability Gap
• Network Service Quality • Reinforced - pre-paid MOU decline - Reinvest Pre-paid ARPM
improvement customer related - Weak 2008 Christmas to inflate usage
• Brand repositioning expenditures (SAC campaign • Speed-up Efficiency plan
and caring) and Intelig integration
• Signing of Intelig deal
1
3. TIM PARTICIPAÇÕES S.A. | Investor Relations
Agenda
Economics Pressure Priorities
Restructuring on
1Q09 2Q09
Top Line
Luca Luciani Claudio Zezza Luca Luciani
2
4. TIM PARTICIPAÇÕES S.A. | Investor Relations
Restart phase completed on time
Strategy and Organization: completed
Customer Base: back to growth as of March, after 1 mln inactive lines clean-up in February
Resolution of Embratel‟s dispute: positive cash impact of R$ 90 mln; one shot cost of R$ 64
mln, booked in 1Q
Back to #2 in Overall Service Quality (vs. # 6 in 2008) according to Anatel’s ranking (99%
achievement in March) driven by network reliability (+14.9 p.p. in 5 months)
Brand Repositioning: doubled share of voice, Top of Mind improved (#2 in SP and RJ Panel),
phase 1 of offering portfolio re-launch
Efficiency Plan on going and improved Capital Allocation (-5% in HR, G&A and Others, -13%
IT, -51% in Bad Debt)
Signing of Intelig acquisition: ready to capture relevant synergies
3
5. TIM PARTICIPAÇÕES S.A. | Investor Relations
Customer Base Evolution: 1 Million lines cleaned-up
Post-paid Clean-up Base
TIM Customer Base Evolution Mln lines
Mln lines
29%
incremental
25.9% 25.4% 25.0% market
Market 24.2% -0.4
23.5% 6.6 6.2
Share share in
March
35.2 36.4 36.1 +11% YoY
32.5 33.8
15,00%
Dez-08 Gross Churn Mar-09
6.8 6.6 6.2
6.8 6.8
Post-paid
Pre-paid Clean-up Base
25.8 27.0 28.4 29.8 29.9 Mln lines
Pre-paid
1Q08 2Q08 3Q08 4Q08 1Q09
+0.1
% Post-paid -3.6 p.p. 29.8 29.9
20.8% 20.2% 19.4% 18.1% 17.1%
on Total
Dez-08 Gross Churn Mar-09
4
6. TIM PARTICIPAÇÕES S.A. | Investor Relations
Resolution of Embratel’s dispute affected 1Q EBITDA
Financial-economic impacts Impact of Embratel dispute resolution on EBITDA
R$ Mln R$ Mln
Non
+90 -64 95
64 recurring
cost
Cash EBITDA
Impact Impact
Reported +14% 609
533
EBITDA
Positive cash impact
1Q08 1Q09
Application of new interconnection tariff
EBITDA Margin %
Better relationship with Embratel to
Reported 17.8% 20.2%
renegotiate leased lines
Normalized 20.9% 22.4% +140 bps
5
7. TIM PARTICIPAÇÕES S.A. | Investor Relations
#2 in Overall Service Quality driven by higher Network Reliability
2008 FY – Overall Service Quality Feb-Mar/09 – Overall Service Quality
% achievement of overall service quality targets, TIM vs. competitors % achievement of overall service quality targets, TIM vs. competitors
99% in March
4Q08: 90.2%
#6 #2
99.5% 99.9% 98.4% 97.8% 97.0%
98.0% 97.7% 95.5%
95.1% 93.4% 91.6%
83.9% 85.5%
61.4%
Player 1 Player 2 Player 3 Player 4 Player 5 TIM Player 7 Player 1 TIM Player 4 Player 5 Player 3 Player 2 Player 7
Network Service Quality
% achievement of network service quality targets % achievement of network service quality targets
Nov/08 Mar/09 Delta (p.p.) 99.5%
96.7%
TIM 84.6% 99.5% 14.8
Main mobile Player 1 99.0% 100.0% 1.0 84.6% 84.1% 84.1%
operators
Player 2 95.7% 93.1% -2.7
Player 3 73.1% 46.2% -26.9
´Nov/08 'Dec/08 ´Jan/09 'Feb/09 'Mar/09 6
Source: Anatel
8. TIM PARTICIPAÇÕES S.A. | Investor Relations
Brand Repositioning
3 steps Strategy Top of Mind
Sao Paulo and Rio de Janeiro, %
33
30
30
30 30%
29
Customer
22
proximity 20%
19 18
Feb
10%
Week 16/03 Week 30/03
TIM Player 1 Player 2 Player 3
New Slogan
Advertising Campaign Evaluation
Mar % Excellent and good grades
Better evaluation vs. competitors and association
to attributes as change, revolution, innovation
88%
77%
Products 69%
Campaigns
Apr/May Player 2 Player 3
7
9. TIM PARTICIPAÇÕES S.A. | Investor Relations
Efficiency Plan: 1Q09 impacts
Direct costs*: 1Q09 YoY:
-6% Advertising 85% Brand
100
90
80
70
Commercial Acquisition
60
50
-5% and 15% Value and
40
Management
30
20
Quality
10
0
-51% Bad Debt
2008 2009 Efficiency
-13% IT 1 0
- 0% 8 %
-0 6 %
-0 4 %
-0 2 %
-0 0% 20% 40% 60% 80% 10%
0
Other costs:
-1% 1200
100
0
800
600
-5% HR, G&A and others
400
200
0
2008 2009
CAPEX:
Network 37% Intelig
-30% 300
250
Comodatum 200
-20% 150
100
Network and IT -35% 50
IT Rationalization
0
2008 2009
8
* Includes costs of Interconnection, Handsets, TFI/TFF, Recharge, VAS content providers
10. TIM PARTICIPAÇÕES S.A. | Investor Relations
Signing of Intelig’s deal
Before the merger After the merger Deal Structure
TIM Brasil Serv. TIM Brasil Serv.
Asset Swap (6.15%)
JVC JVCO
and Part. S.A. and Part. S.A.
O
ON: 81.32% ON: 76.32% ON: 6.15%
PN: 63.93% 100%
PN: 60.00% PN: 6.15% Waiting approval from
HOLDCO
authorities
100% 100% 100%
100%
TIM Cel. S.A.
TIM Cel. S.A. Lock-up period
100% 100%
TIM Nord. S.A. TIM Nord. S.A. Debt Free
Note: information concerning the shareholding percentages of TIM PART are still subject to changes due to the deliberations taken at its Extraordinary
Shareholders Meeting, dated of April 2, 2009 and article 171 of the BCL
9
11. TIM PARTICIPAÇÕES S.A. | Investor Relations
Agenda
Economics Pressure
Priorities
Restructuring on
1Q09 Top Line 2Q09
Luca Luciani Claudio Zezza Luca Luciani
10
12. TIM PARTICIPAÇÕES S.A. | Investor Relations
1Q09 Main results
Flat Revenues: R$3,012 million (+0.6% YoY) – as consequence of last 12 month post paid churn
and with decreasing pre-paid contribution
VAS Growth: up 31.4% YoY (approximately 11.2% of gross service revenues) thanks to data
service
Further Efficiency Gains:
• Discretionary costs -8.7% YoY
• Bad debt at 4.8% on net service revenue: -51% YoY (or -24% normalized by Telesales
effect)
Improved EBITDA Margin: +14.4% YoY reported with margin of 20.2%. Normalized EBITDA with
Embratel’s dispute agreement, margin would be 22.4%
Negative Operating Free Cash Flow (R$ -1,251Mn) mainly due to Capex 4Q08 disbursement
and Fistel tax
11
13. TIM PARTICIPAÇÕES S.A. | Investor Relations
Revenues
+122% 0,5
Total Revenues (Gross) Customer
0,2 Net Revenues
Base
TIM WEB
Mln lines
R$ Million R$ Million
Mar/08 Mar/09
(76) 56 3,544 ΔYoY
(34) 103
(55) 2,993 3,012
+0.6%
4,212 3,223
4,219 -0.5%
2,838 2,823
+21.5%
155 321 189
1Q08 Outgoing Long Incoming. VAS Product 1Q09 1Q08 4Q08 1Q09
Distance
Net Service Revenues
ΔYoY -3.8% -6.9% -5.0% +31.4% +17.3% Net Product Revenues
12
14. TIM PARTICIPAÇÕES S.A. | Investor Relations
Efficiency sustains EBITDA Margin over 20%
Includes Embratel
dispute expenses: R$
Personnel and G&A Costs Interconnection & Network Costs 64 Million
R$ Million ∆ YoY R$ Million
∆ YoY
Total 286 283 261 Total 1,045 1,048 985
Total -8.7%
Total -5.7%
G&A* 124 119 103 Inter
∆ QoQ connection 837 784 702
∆ QoQ
Personnel 163 164 158 Total -7.6%
Network 207 264 283 Total -6.1%
1Q08 4Q08 1Q09 1Q08 4Q08 1Q09
% of Net % of Net
9.6% 8.0% 8.7%
Revenues Revenues 34.9% 29.6% 32.7%
*includes TI costs
Bad debt EBITDA
R$ Million
272 ∆ YoY R$ Million ∆ YoY
Telesales -51% +14.4%
95
impact
Normalized Normalized
95* 64**
-23.9% +7.3%
177 931 609
131 134 533
∆ QoQ ∆ QoQ
1Q08 4Q08 1Q09 +3.0% Margin -27.7%
1Q08 4Q08 1Q09
% of
Reported 17.8% 26.3% 20.2%
Net Service 6.2%* 4.1% 4.8%
Revenues Normalized 20.9% 26.3% 22.4%
* Excluding Telesales additional impact (9.6% including impact) * Telesales Impact ** Embratel’s dispute expenses
13
15. TIM PARTICIPAÇÕES S.A. | Investor Relations
Defended EBITDA – Improved resources allocation
R$ Million
33.0 64.0**
137.2
(14.7) 33.4 (111.0)
95*
(61.2) 59.9
609.4
532.8 Investments Savings
+14%
EBITDA Service Handsets Advertising Network Other EBITDA
COGS Bad Debt
1Q08 Revenues Revenues & Sales Expenses Revenues*** 1Q09
Δ YoY -0.5% +21.5% +18.6% +23.3% -5.7% -50.5% -11.7%
Reported 17.8% 20.2%
Normalized 20.9% 22.4% +140 bps
14
* Telesales Impact ** Embratel’s dispute *** Other Expenses include: G&A, Personnel and Net Other Operating Expenses/Revenues
16. TIM PARTICIPAÇÕES S.A. | Investor Relations
EBIT and Net Results – 1Q09
R$ Million
EBITDA Depreciation & Net Financial Taxes and Net
EBIT Results
1Q09 Amortization Expenses Others
609.4 (641.2)
Impacted mainly by
additions into pre-tax
balance, due to the end
of hedge contracts
(31.8) (144.0)
(69.3)
(42.9)
Change YoY +14.4% +12.1% -19.0% -5.8% +240.4% +14.8%
15
17. TIM PARTICIPAÇÕES S.A. | Investor Relations
Net financial position and Operating Free Cash Flow – 1Q09
Operating Free Cash Flow Net Debt
R$ Million R$ Million
609 (1,666) (194) (1,251) Operating Non
4Q08 FCF OpFCF 1Q09
(1,670)
EBITDA ΔWC CAPEX Operating (1,251) (96) (3,017)
FCF
Negative Working Capital due to 4Q08’s cash-out (CAPEX
and FISTEL)
R$ 3.47 billion (of which 65% long term)
Gross Debt
~35% of total debt is denominated in foreign currency (fully hedged)
Average annual cost 12.47% in Q1 09 vs.10.96% in Q1 08 (and 13.2% in 4Q08)
16
18. TIM PARTICIPAÇÕES S.A. | Investor Relations
Agenda
Pressure
Economics Priorities
Restructuring on
1Q09 2Q09
Top Line
Luca Luciani Claudio Zezza Luca Luciani
17
19. TIM PARTICIPAÇÕES S.A. | Investor Relations
Issue: pressure on Top Line
Post-paid customer base erosion along last 12 months
• Lower focus on gross adds and increasing churn in second half 2008
• Post-paid mix down to 17.1% on total customer base (-3.7 p.p. vs 1Q08)
Deceleration of growth of pre-paid revenue, due to lower promotional aggressiveness,
especially in the campaign for Christmas
• Pre-paid ARPM increase (+53% YoY)
• MOU outgoing decrease (-31% YoY)
ARPU dilution mainly due to worse customer base mix:
• Pre-paid outgoing ARPU increase (+6% YoY)
• Post-paid outgoing ARPU decrease (-4% YoY)
• Blended outgoing ARPU decrease (-12% YoY)
18
20. TIM PARTICIPAÇÕES S.A. | Investor Relations
Revenues slowdown: post-paid base erosion and pre-paid growth reduction
Pos-paid long tail MOU/Price Pre-paid
Hundred Base
Churn -31%
MOU out
(min/month)
100 ARPM out +53%
(R$/min)
Gross
ARPU out
(R$/month)
1Q08 2Q08 3Q08 4Q08 1Q09 1Q08 2Q08 3Q08 4Q08 1Q09
Post-paid revenues growth (%YoY) Pre-paid outgoing revenues growth (%YoY)
+
++ ++ +
1Q08 3Q08 1Q09 1Q08 3Q08 1Q09
%Average
Base YoY*
++ + % Average
base YoY* ++ ++ +
Post-paid customer base erosion MOU deflated as consequence of price-up
19
* Excludes churn due to the base clean-up
21. TIM PARTICIPAÇÕES S.A. | Investor Relations
1Q09 suffers from weak Christmas campaign
Incremental Market Share Pre-paid Gross Adds
TIM Vivo/Claro
14% 13%
10% +9%
26% Bonus 10 x
Min. usage
12% to earn R$ 6 1 min.
oct/08 nov/08 dec/08
Promotion
4Q07 4Q08 3 month 6 month
Loss of competitiveness duration
4Q07 4Q08
in dec/08 Market 17.0MM 22.9MM
Gross Lower aggressiveness
+35% of TIM offer
(Post+Pre)
Total unitary SAC Gross Adds (% YoY) Jan-Sep 2008
Post: -4%
R$ 4Q08
Pre: -12%
-16% -14%
Post-paid
-27%
22%
Pre-paid
Jan-Sep 4Q 9%
2008 2008
20
* TIM Brasil estimates
23. TIM PARTICIPAÇÕES S.A. | Investor Relations
Agenda
Economics Pressure
Priorities
Restructuring on
1Q09 Top Line 2Q09
Luca Luciani Claudio Zezza Luca Luciani
22
24. TIM PARTICIPAÇÕES S.A. | Investor Relations
Challenges
Growth with Profitability
Invert current trend Efficiency Plan Integration of Intelig
Post-paid
450
EBITDA and Operating Efficiency on Network
400
350
Gross
Free Cash Flow defense
300
Business development (Long
250
200
150
Churn
100
Financing the growth Distance, Top Clients)
50
0
1Q Apr-Dec
2009 2009
Market Share Incremental SAC G&A e RH Bad debts
30% +15% 600 600 600
25% 500 500 500
20% 400
-5% 400 -51% 400
29% 15% 300 300 300
17% 10% 200 200 200
10% 5% 100 100 100
0% 0 0 0
Avg. Dec Mar 1Q08 1Q09 1Q08 1Q09 1Q08 1Q09
2008 „08 „09
Speed-up of commercial KPIs in 2Q Improve efficiency to sustain growth 23
25. TIM PARTICIPAÇÕES S.A. | Investor Relations
Invert current trend – Sales growth
Invert current acquisition trends
Post-paid gross adds (Voice)
1) Sales Convention (April 2nd) -
“The Turnaroud”
1MM handsets sold
Focus on post-paid
New commissioning
Jan-08 Jan-09 Feb-08 Feb-09 Mar-08 Mar-09 Apr-08 Apr-09
2) Portability: Port-in/Port-out Post-paid:
Improvements on main territories:
Sales incentives 80% TSU: +22 p.p.
Consumer TSP: +34 p.p.
60% Average 55%
Business 40%
40%
23%
20%
Company repositioning:
0%
sales KPIs growth starting from 2Q09 4Q08
4 Q08
1Q09
1 Q09
Abr/09*
39904
2008 Mar/09 Apr/09*
24
* Portability results until Apr 26th
26. TIM PARTICIPAÇÕES S.A. | Investor Relations
Invert current trend – New offers portfolio (2Q09)
Launched offers Next launches
Single invoice
for business New offer
customers Business
New post-paid offer
Post High
Mother‟s Day (free LD)
Post
Pre Portability
% of Gross Adds
0 ,6
CB Infinity: 750 K
0 ,5
(lines) (pre-paid):
0 ,4
0% 33%
0%
0 ,3
0%
0%
0 ,2
0 ,1
0%
0%
Company repositioning:
0
0%
0%
revenues growth from 2H09
8/Apr 19/Apr 04/May 8/Apr 18/Apr 03/May
25
27. TIM PARTICIPAÇÕES S.A. | Investor Relations
Efficiency Plan
Quick wins Improvement Re-thinking Efficiency
identified
Bad debt Commercial: channel costs Network: Intelig integration until now:
rationalization ~R$0.8 Bln
IT: contracts Customer care: revision of
renegotiation Network: contracts caring model Opex +
G&A: costs optimization
renegotiation
New sourcing models (revenue Capex
IT: demand rationalization sharing, risk sharing, etc)
Finance company growth
Defend profitability and cash generation (EBITDA margin and Operating Cash Flow) against
exchange rate and business risks ~50% of
efficiency
SAC Customer Care
reinvested on
+XX% +YY%
business
600 600
500 500
400 400
30
20
0
0
30
20
0
0
growth
100 100
0 0
2008 2009 2008 2009
FY FY FY FY
26
28. TIM PARTICIPAÇÕES S.A. | Investor Relations
Intelig: synergies for TIM
Transport network use
(backbone and metropolitan) 100% leased lines 14.500 km of own
Network and optical fiber
for TIM Brasil traffic Optical fiber MAN* 800 Km in MAN*
transport
under development rings
Accelerate
Business clients („000) integration to
Cross/upsell of TIM mobile capture
Data solutions for Intelig customer 300
solutions for base and Intelig data 200
synergies:
Business solutions for TIM customers 100 ~2% of
EBITDA
LD Net Revenues (R$ Bln) margin
Extension of the LD business
to non-TIM customers
(18 months)
Long
1.0
Distance +
*Metropolitan area network 27
29. TIM PARTICIPAÇÕES S.A. | Investor Relations
“Safe Harbor” Statements
Statements in this presentation, as well as oral statements made by the management of TIM
Participações S.A. (the “Company”, or “TIM”), that are not historical fact constitute “forward
looking statements” that involve factors that could cause the actual results of the Company to
differ materially from historical results or from any results expressed or implied by such forward
looking statements. The Company cautions users of this presentation not to place undue
reliance on forward looking statements, which may be based on assumptions and anticipated
events that do not materialize.
Investor Relations Visit our Website
Avenida das Américas, 3434 - Bloco 01 http://www.timpartri.com.br
6° andar – Barra da Tijuca
22640-102 Rio de Janeiro, RJ
Phone: +55 21 4009-3742 / 4009-3446 / 4009-4017
Fax: +55 21 4009-3990
28