Download as PDF, PPTX


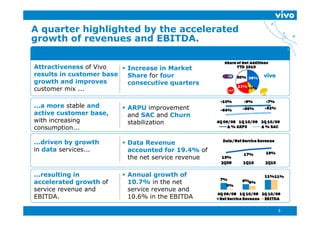
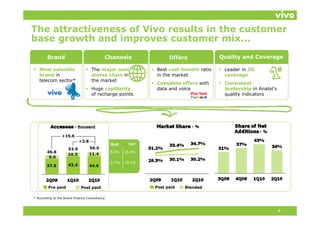

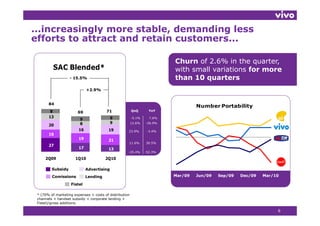
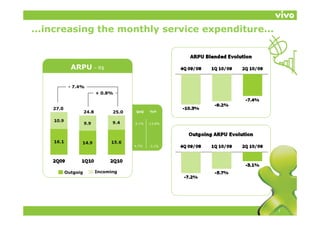

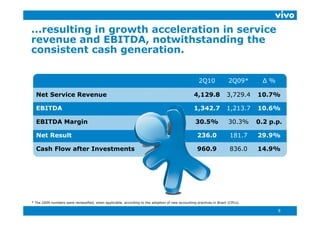
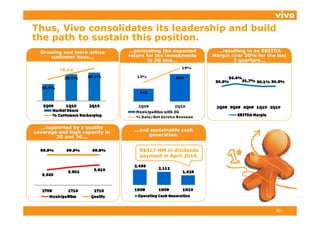

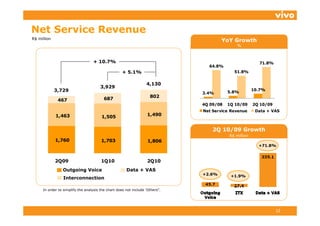
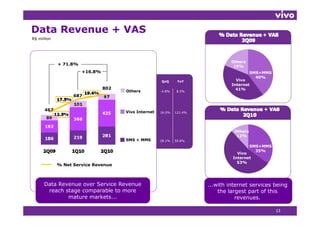
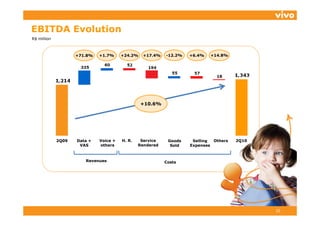
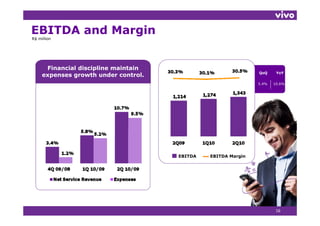
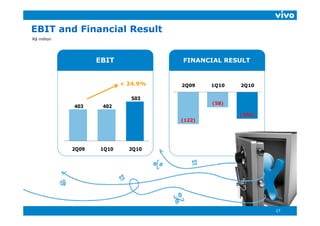
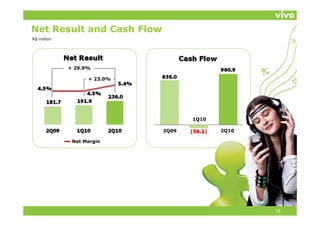


The document summarizes Vivo's financial and operating performance in 2Q10. Key highlights include: - Accelerated growth in revenues and EBITDA compared to previous periods. Revenues grew 10.7% and EBITDA grew 10.6% year-over-year. - Improved customer mix and market share gains led to a more stable and active customer base, driving increased consumption and revenue per user. - Data services revenue grew significantly, accounting for 19.4% of revenues and fueling overall growth. - Solid cash generation supported a dividend payment of R$417 million in April 2010 while consolidating Vivo's leadership position in the market.


