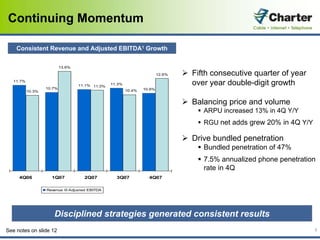
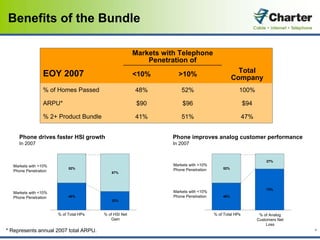
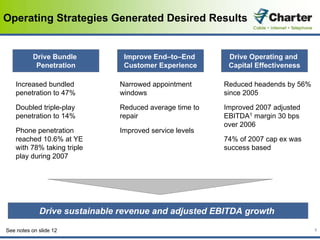
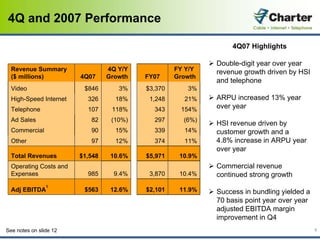
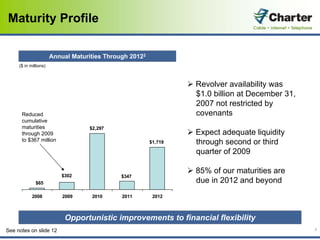
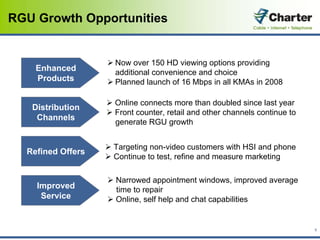
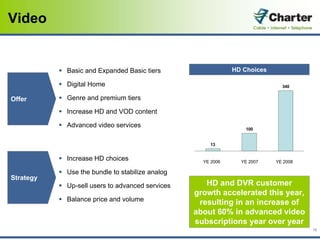
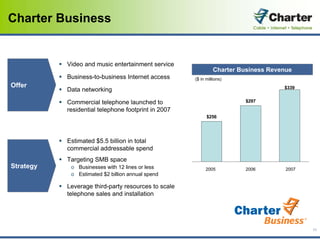
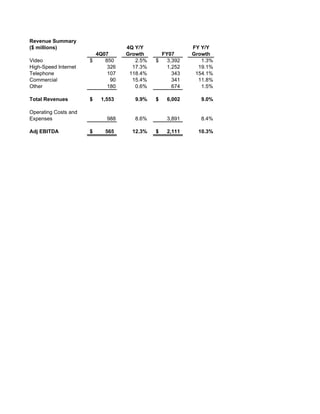
This document is the transcript from Charter Communications' 4th quarter and full year 2007 earnings call. It includes:
1) Charter Communications reported consistent revenue and adjusted EBITDA growth in the 4th quarter and full year 2007, driven by strategies to increase bundling penetration and improve customer experience.
2) The company grew revenue from high-speed internet and telephone services through customer growth and increasing ARPU. Bundling phone with cable services drove faster growth and improved customer retention.
3) Charter reduced its debt maturities through 2012 to $367 million and expects adequate liquidity through 2009 to continue investing in growth opportunities and improving service.
The global outsourcing industry is constantly evolving through new contracting award characteristics and an expanding universe of successful service providers. ISG's TPI Index helps industry participants, enterprises and organizations keep pace and capitalize from the latest data on outsourcing trends. It is the authoritative source for marketplace intelligence related to outsourcing: transaction structures and terms, industry adoption, geographic prevalence and service provider metrics.
The European Unemployment Puzzle: implications from population agingGRAPE
We study the link between the evolving age structure of the working population and unemployment. We build a large new Keynesian OLG model with a realistic age structure, labor market frictions, sticky prices, and aggregate shocks. Once calibrated to the European economy, we quantify the extent to which demographic changes over the last three decades have contributed to the decline of the unemployment rate. Our findings yield important implications for the future evolution of unemployment given the anticipated further aging of the working population in Europe. We also quantify the implications for optimal monetary policy: lowering inflation volatility becomes less costly in terms of GDP and unemployment volatility, which hints that optimal monetary policy may be more hawkish in an aging society. Finally, our results also propose a partial reversal of the European-US unemployment puzzle due to the fact that the share of young workers is expected to remain robust in the US.
How to get verified on Coinbase Account?_.docxBuy bitget
t's important to note that buying verified Coinbase accounts is not recommended and may violate Coinbase's terms of service. Instead of searching to "buy verified Coinbase accounts," follow the proper steps to verify your own account to ensure compliance and security.
Seminar: Gender Board Diversity through Ownership NetworksGRAPE
Seminar on gender diversity spillovers through ownership networks at FAME|GRAPE. Presenting novel research. Studies in economics and management using econometrics methods.
The secret way to sell pi coins effortlessly.DOT TECH
Well as we all know pi isn't launched yet. But you can still sell your pi coins effortlessly because some whales in China are interested in holding massive pi coins. And they are willing to pay good money for it. If you are interested in selling I will leave a contact for you. Just telegram this number below. I sold about 3000 pi coins to him and he paid me immediately.
Telegram: @Pi_vendor_247
how can I sell pi coins after successfully completing KYCDOT TECH
Pi coins is not launched yet in any exchange 💱 this means it's not swappable, the current pi displaying on coin market cap is the iou version of pi. And you can learn all about that on my previous post.
RIGHT NOW THE ONLY WAY you can sell pi coins is through verified pi merchants. A pi merchant is someone who buys pi coins and resell them to exchanges and crypto whales. Looking forward to hold massive quantities of pi coins before the mainnet launch.
This is because pi network is not doing any pre-sale or ico offerings, the only way to get my coins is from buying from miners. So a merchant facilitates the transactions between the miners and these exchanges holding pi.
I and my friends has sold more than 6000 pi coins successfully with this method. I will be happy to share the contact of my personal pi merchant. The one i trade with, if you have your own merchant you can trade with them. For those who are new.
Message: @Pi_vendor_247 on telegram.
I wouldn't advise you selling all percentage of the pi coins. Leave at least a before so its a win win during open mainnet. Have a nice day pioneers ♥️
#kyc #mainnet #picoins #pi #sellpi #piwallet
#pinetwork
What price will pi network be listed on exchangesDOT TECH
The rate at which pi will be listed is practically unknown. But due to speculations surrounding it the predicted rate is tends to be from 30$ — 50$.
So if you are interested in selling your pi network coins at a high rate tho. Or you can't wait till the mainnet launch in 2026. You can easily trade your pi coins with a merchant.
A merchant is someone who buys pi coins from miners and resell them to Investors looking forward to hold massive quantities till mainnet launch.
I will leave the telegram contact of my personal pi vendor to trade with.
@Pi_vendor_247
how to sell pi coins in South Korea profitably.DOT TECH
Yes. You can sell your pi network coins in South Korea or any other country, by finding a verified pi merchant
What is a verified pi merchant?
Since pi network is not launched yet on any exchange, the only way you can sell pi coins is by selling to a verified pi merchant, and this is because pi network is not launched yet on any exchange and no pre-sale or ico offerings Is done on pi.
Since there is no pre-sale, the only way exchanges can get pi is by buying from miners. So a pi merchant facilitates these transactions by acting as a bridge for both transactions.
How can i find a pi vendor/merchant?
Well for those who haven't traded with a pi merchant or who don't already have one. I will leave the telegram id of my personal pi merchant who i trade pi with.
Tele gram: @Pi_vendor_247
#pi #sell #nigeria #pinetwork #picoins #sellpi #Nigerian #tradepi #pinetworkcoins #sellmypi
1. Elemental Economics - Introduction to mining.pdfNeal Brewster
After this first you should: Understand the nature of mining; have an awareness of the industry’s boundaries, corporate structure and size; appreciation the complex motivations and objectives of the industries’ various participants; know how mineral reserves are defined and estimated, and how they evolve over time.
how to sell pi coins effectively (from 50 - 100k pi)DOT TECH
Anywhere in the world, including Africa, America, and Europe, you can sell Pi Network Coins online and receive cash through online payment options.
Pi has not yet been launched on any exchange because we are currently using the confined Mainnet. The planned launch date for Pi is June 28, 2026.
Reselling to investors who want to hold until the mainnet launch in 2026 is currently the sole way to sell.
Consequently, right now. All you need to do is select the right pi network provider.
Who is a pi merchant?
An individual who buys coins from miners on the pi network and resells them to investors hoping to hang onto them until the mainnet is launched is known as a pi merchant.
debuts.
I'll provide you the Telegram username
@Pi_vendor_247
Falcon stands out as a top-tier P2P Invoice Discounting platform in India, bridging esteemed blue-chip companies and eager investors. Our goal is to transform the investment landscape in India by establishing a comprehensive destination for borrowers and investors with diverse profiles and needs, all while minimizing risk. What sets Falcon apart is the elimination of intermediaries such as commercial banks and depository institutions, allowing investors to enjoy higher yields.
US Economic Outlook - Being Decided - M Capital Group August 2021.pdfpchutichetpong
The U.S. economy is continuing its impressive recovery from the COVID-19 pandemic and not slowing down despite re-occurring bumps. The U.S. savings rate reached its highest ever recorded level at 34% in April 2020 and Americans seem ready to spend. The sectors that had been hurt the most by the pandemic specifically reduced consumer spending, like retail, leisure, hospitality, and travel, are now experiencing massive growth in revenue and job openings.
Could this growth lead to a “Roaring Twenties”? As quickly as the U.S. economy contracted, experiencing a 9.1% drop in economic output relative to the business cycle in Q2 2020, the largest in recorded history, it has rebounded beyond expectations. This surprising growth seems to be fueled by the U.S. government’s aggressive fiscal and monetary policies, and an increase in consumer spending as mobility restrictions are lifted. Unemployment rates between June 2020 and June 2021 decreased by 5.2%, while the demand for labor is increasing, coupled with increasing wages to incentivize Americans to rejoin the labor force. Schools and businesses are expected to fully reopen soon. In parallel, vaccination rates across the country and the world continue to rise, with full vaccination rates of 50% and 14.8% respectively.
However, it is not completely smooth sailing from here. According to M Capital Group, the main risks that threaten the continued growth of the U.S. economy are inflation, unsettled trade relations, and another wave of Covid-19 mutations that could shut down the world again. Have we learned from the past year of COVID-19 and adapted our economy accordingly?
“In order for the U.S. economy to continue growing, whether there is another wave or not, the U.S. needs to focus on diversifying supply chains, supporting business investment, and maintaining consumer spending,” says Grace Feeley, a research analyst at M Capital Group.
While the economic indicators are positive, the risks are coming closer to manifesting and threatening such growth. The new variants spreading throughout the world, Delta, Lambda, and Gamma, are vaccine-resistant and muddy the predictions made about the economy and health of the country. These variants bring back the feeling of uncertainty that has wreaked havoc not only on the stock market but the mindset of people around the world. MCG provides unique insight on how to mitigate these risks to possibly ensure a bright economic future.
How Does CRISIL Evaluate Lenders in India for Credit RatingsShaheen Kumar
CRISIL evaluates lenders in India by analyzing financial performance, loan portfolio quality, risk management practices, capital adequacy, market position, and adherence to regulatory requirements. This comprehensive assessment ensures a thorough evaluation of creditworthiness and financial strength. Each criterion is meticulously examined to provide credible and reliable ratings.
2. Cautionary Statement Regarding
Forward Looking Statements
CAUTIONARY STATEMENT REGARDING FORWARD-LOOKING STATEMENTS:
This presentation includes forward-looking statements within the meaning of Section 27A of the Securities Act of 1933, as amended, and Section 21E of the
Securities Exchange Act of 1934, as amended, regarding, among other things, our plans, strategies and prospects, both business and financial. Although
we believe that our plans, intentions and expectations reflected in or suggested by these forward-looking statements are reasonable, we cannot assure you
that we will achieve or realize these plans, intentions or expectations. Forward-looking statements are inherently subject to risks, uncertainties and
assumptions including, without limitation, the factors described under quot;Risk Factorsquot; from time to time in our filings with the Securities and Exchange
Commission (“SEC”). Many of the forward-looking statements contained in this presentation may be identified by the use of forward-looking words such as
quot;believe,quot; quot;expect,quot; quot;anticipate,quot; quot;should,quot; quot;planned,quot; quot;will,quot; quot;may,quot; quot;intend,quot; quot;estimated,quot; quot;aim,quot; quot;on track,quot; quot;target,quot; quot;opportunityquot; and quot;potential,quot; among
others. Important factors that could cause actual results to differ materially from the forward-looking statements we make in this presentation are set forth
in other reports or documents that we file from time to time with the SEC, and include, but are not limited to:
• the availability, in general, of funds to meet interest payment obligations under our debt and to fund our operations and necessary capital
expenditures;
either through cash flows from operating activities, further borrowings or other sources and, in particular, our ability to fund debt obligations (by
dividend investment or otherwise) to the applicable obligor of such debt;
• our ability to comply with all covenants in our indentures and credit facilities, any violation of which, if not cured in a timely manner, could
trigger a default of our other obligations under cross-default provisions;
• our ability to pay or refinance debt prior to or when it becomes due and/or refinance that debt through new issuances, exchange offers or
otherwise, including restructuring our balance sheet and leverage position;
• the impact of competition from other distributors, including incumbent telephone companies, direct broadcast satellite operators, wireless
broadband providers, and digital subscriber line (“DSL”) providers;
• difficulties in growing, further introducing, and operating our telephone services, while adequately meeting customer expectations for the
reliability of voice services;
• our ability to adequately meet demand for installations and customer service;
• our ability to sustain and grow revenues and cash flows from operating activities by offering video, high-speed Internet, telephone and other
services, and to maintain and grow our customer base, particularly in the face of increasingly aggressive competition;
• our ability to obtain programming at reasonable prices or to adequately raise prices to offset the effects of higher programming costs;
• general business conditions, economic uncertainty or slowdown, including the recent significant slowdown in the new housing sector and
overall economy; and
• the effects of governmental regulation on our business.
All forward-looking statements attributable to us or any person acting on our behalf are expressly qualified in their entirety by this cautionary statement. We
are under no duty or obligation to update any of the forward-looking statements after the date of this presentation.
Unless otherwise stated, all results are pro forma, which reflect certain of our sales and acquisition of certain assets in 2006 and
2007 as if they had occurred as of January 1, 2006. For comparable actual results, see the Appendix to these slides. 2
3. Continuing Momentum
Consistent Revenue and Adjusted EBITDA1 Growth
13.6%
Fifth consecutive quarter of year
12.6%
over year double-digit growth
11.7%
11.3%
11.1% 11.0%
10.7% 10.6%
10.4%
10.3%
Balancing price and volume
ARPU increased 13% in 4Q Y/Y
RGU net adds grew 20% in 4Q Y/Y
Drive bundled penetration
Bundled penetration of 47%
7.5% annualized phone penetration
rate in 4Q
4Q06 1Q07 2Q07 3Q07 4Q07
Revenue Adjusted EBITDA
Disciplined strategies generated consistent results
See notes on slide 12 3
4. Benefits of the Bundle
Markets with Telephone
Penetration of
Total
EOY 2007 <10% >10% Company
% of Homes Passed 48% 52% 100%
ARPU* $90 $96 $94
% 2+ Product Bundle 41% 51% 47%
Phone drives faster HSI growth Phone improves analog customer performance
In 2007 In 2007
27%
Markets with >10%
Markets with >10%
52% 52%
Phone Penetration
Phone Penetration 67%
73%
Markets with <10%
Markets with <10%
Phone Penetration
48% 48%
Phone Penetration
33%
% of Total HPs % of HSI Net % of Total HPs % of Analog
Gain Customers Net
Loss
* Represents annual 2007 total ARPU. 4
5. Operating Strategies Generated Desired Results
Drive Bundle Improve End–to–End Drive Operating and
Penetration Customer Experience Capital Effectiveness
Increased bundled Narrowed appointment Reduced headends by 56%
penetration to 47% windows since 2005
Doubled triple-play Reduced average time to Improved 2007 adjusted
EBITDA1 margin 30 bps
penetration to 14% repair
over 2006
Phone penetration Improved service levels
reached 10.6% at YE 74% of 2007 cap ex was
with 78% taking triple success based
play during 2007
Drive sustainable revenue and adjusted EBITDA growth
See notes on slide 12 5
6. 4Q and 2007 Performance
4Q07 Highlights
Double-digit year over year
Revenue Summary 4Q Y/Y FY Y/Y revenue growth driven by HSI
($ millions) 4Q07 Growth FY07 Growth
and telephone
Video $846 3% $3,370 3%
ARPU increased 13% year
High-Speed Internet 326 18% 1,248 21%
over year
Telephone 107 118% 343 154%
Ad Sales 82 (10%) 297 (6%)
HSI revenue driven by
Commercial 90 15% 339 14% customer growth and a
4.8% increase in ARPU year
Other 97 12% 374 11%
over year
Total Revenues $1,548 10.6% $5,971 10.9%
Commercial revenue
Operating Costs and
Expenses 985 9.4% 3,870 10.4% continued strong growth
1
Adj EBITDA $563 12.6% $2,101 11.9% Success in bundling yielded a
70 basis point year over year
adjusted EBITDA margin
improvement in Q4
See notes on slide 12 6
7. Maturity Profile
Annual Maturities Through 20122
($ in millions)
Revolver availability was
$1.0 billion at December 31,
2007 not restricted by
covenants
Reduced
cumulative
maturities $2,297
Expect adequate liquidity
through 2009
to $367 million through second or third
$1,719
quarter of 2009
85% of our maturities are
$302 $347
due in 2012 and beyond
$65
2008 2009 2010 2011 2012
Opportunistic improvements to financial flexibility
See notes on slide 12 7
8. RGU Growth Opportunities
Now over 150 HD viewing options providing
Enhanced additional convenience and choice
Products Planned launch of 16 Mbps in all KMAs in 2008
Online connects more than doubled since last year
Distribution
Front counter, retail and other channels continue to
Channels
generate RGU growth
Targeting non-video customers with HSI and phone
Refined Offers
Continue to test, refine and measure marketing
Narrowed appointment windows, improved average
Improved time to repair
Service Online, self help and chat capabilities
8
9. Phone and HSI
Phone Penetration HSI Penetration
24%
11%
22%
7%
2006 2006 2007
2007
Unlimited local and long distance
Up to 5/10/16 Mbps download speed
calling to US, Canada, Puerto Rico
Security software (anti-virus & firewall)
Voicemail
Offer
Wireless home networking
10 popular calling features, including
Caller ID and Call Waiting Exclusive content on Charter.net
Unlimited local and intrastate calling
Approach each home passed with Speed migration and home
improved value proposition networking driving ARPU growth
Strategy
Use telephone to drive two and three Impact of bundle increases
product bundles penetration and reduces overall churn
9
10. Video
HD Choices
Basic and Expanded Basic tiers
Digital Home 340
Genre and premium tiers
Offer
Increase HD and VOD content
Advanced video services 100
13
Increase HD choices YE 2006 YE 2007 YE 2008
Use the bundle to stabilize analog
Strategy
HD and DVR customer
Up-sell users to advanced services
growth accelerated this year,
Balance price and volume resulting in an increase of
about 60% in advanced video
subscriptions year over year
10
11. Charter Business
Video and music entertainment service
Charter Business Revenue
Business-to-business Internet access ($ in millions)
Offer $339
Data networking
$297
Commercial telephone launched to
residential telephone footprint in 2007
$256
Estimated $5.5 billion in total
commercial addressable spend
Targeting SMB space
Strategy o Businesses with 12 lines or less 2005 2006 2007
o Estimated $2 billion annual spend
Leverage third-party resources to scale
telephone sales and installation
11
12. Footnotes
Unless otherwise stated, all results are pro forma, which reflect certain of our sales and acquisition of certain assets in 2006 and
2007 as if they had occurred as of January 1, 2006. For comparable actual results, see the Appendix to these slides.
1 Adjusted EBITDA and pro forma adjusted EBITDA are non-GAAP financial measures and should be considered in addition to, not as a
substitute for, net cash flows from operating activities reported in accordance with GAAP. These terms, as defined by Charter, may not be
comparable to similarly titled measures used by other companies. Adjusted EBITDA is defined as income from operations before
depreciation and amortization, impairment charges, stock compensation expense, and other operating (income) expenses such as special
charges or loss on sale or retirement of assets. As such, it eliminates the significant non-cash depreciation and amortization expense that
results from the capital-intensive nature of the Company’s businesses as well as other non-cash or non-recurring items, and is unaffected by
the Company’s capital structure or investment activities. Adjusted EBITDA and pro forma adjusted EBITDA are liquidity measures used by
Company management and its board of directors to measure the Company’s ability to fund operations and its financing obligations. For this
reason, it is a significant component of Charter’s annual incentive compensation program. However, this measure is limited in that it does
not reflect the periodic costs of certain capitalized tangible and intangible assets used in generating revenues and the cash cost of financing
for the Company. Company management evaluates these costs through other financial measures.
The Company believes that adjusted EBITDA and pro forma adjusted EBITDA provide information useful to investors in assessing Charter’s
ability to service its debt, fund operations, and make additional investments with internally generated funds. In addition, adjusted EBITDA
generally correlates to the leverage ratio calculation under the Company’s credit facilities or outstanding notes to determine compliance with
the covenants contained in the facilities and notes (all such documents have been previously filed with the SEC). Adjusted EBITDA and pro
forma adjusted EBITDA, as presented, include management fee expenses in the amount of $31 and $32 million for each of the three months
ended December 31, 2007 and 2006, respectively, which expense amounts are excluded for the purposes of calculating compliance with
leverage covenants.
For a reconciliation of pro forma adjusted EBITDA and adjusted EBITDA to the most directly comparable GAAP financial measure, see the
Appendix.
2 Includes
revolver commitment reductions, term loan amortization and bond and convertible maturities. The remaining $15 billion of face
amount of debt matures in 2013 and beyond.
12
14. CHARTER COMMUNICATIONS, INC. AND SUBSIDIARIES
UNAUDITED RECONCILIATION OF NON-GAAP MEASURES TO PRO FORMA GAAP MEASURES
(DOLLARS IN MILLIONS)
PRO FORMA (a)
2005 2006 2007
4th Quarter 1st Quarter 2nd Quarter 3rd Quarter 4th Quarter 1st Quarter 2nd Quarter 3rd Quarter 4th Quarter
Net cash flows from operating activities $ 116 $ 183 $ (24) $ 136 $ (28) $ 264 $ (152) $ 207 $ (2)
Less: Purchases of property, plant and equipment (262) (233) (290) (254) (308) (298) (281) (311) (354)
Less: Change in accrued expenses related to capital expenditures (28) (7) (2) 13 20 (32) (7) (12) 49
Free cash flow (174) (57) (316) (105) (316) (66) (440) (116) (307)
Interest on cash pay obligations (b) 377 406 424 445 448 453 452 449 457
Purchases of property, plant and equipment 262 233 290 254 308 298 281 311 354
Change in accrued expenses related to capital expenditures 28 7 2 (13) (20) 32 7 12 (49)
Other, net 5 5 9 3 (2) 2 18 6 7
Change in operating assets and liabilities (46) (159) 74 (124) 82 (225) 218 (154) 101
Adjusted EBITDA $ 452 $ 435 $ 483 $ 460 $ 500 $ 494 $ 536 $ 508 $ 563
(a) Pro forma results reflect certain sales and acquisitions of cable systems in 2006 and 2007 as if they occurred as of January 1, 2006.
(b) Interest on cash pay obligations excludes accretion of original issue discounts on certain debt securities and amortization of deferred financing costs that are reflected as interest expense in our consolidated statements of operations.
The above schedules are presented in order to reconcile adjusted EBITDA and free cash flows, non-GAAP measures, to the most directly comparable pro forma GAAP measures.
15. CHARTER COMMUNICATIONS, INC. AND SUBSIDIARIES
UNAUDITED RECONCILIATION OF NON-GAAP MEASURES TO GAAP MEASURES
(DOLLARS IN MILLIONS)
ACTUAL
2005 2006 2007
4th Quarter 1st Quarter 2nd Quarter 3rd Quarter 4th Quarter 1st Quarter 2nd Quarter 3rd Quarter 4th Quarter
Net cash flows from operating activities $ 142 $ 209 $ (4) $ 143 $ (25) $ 266 $ (148) $ 209 $ -
Less: Purchases of property, plant and equipment (273) (241) (298) (256) (308) (298) (281) (311) (354)
Less: Change in accrued expenses related to capital expenditures (28) (7) (2) 13 20 (32) (7) (12) 49
Free cash flow (159) (39) (304) (100) (313) (64) (436) (114) (305)
Interest on cash pay obligations (a) 390 416 440 445 448 453 452 449 457
Purchases of property, plant and equipment 273 241 298 256 308 298 281 311 354
Change in accrued expenses related to capital expenditures 28 7 2 (13) (20) 32 7 12 (49)
Other, net 5 5 9 3 (2) 2 18 6 7
Change in operating assets and liabilities (46) (159) 74 (124) 82 (225) 218 (154) 101
Adjusted EBITDA from continuing and discontinued operations $ 491 $ 471 $ 519 $ 467 $ 503 $ 496 $ 540 $ 510 $ 565
(a) Interest on cash pay obligations excludes accretion of original issue discounts on certain debt securities and amortization of deferred financing costs that are reflected as interest expense in our consolidated statements of operations.
The above schedules are presented in order to reconcile adjusted EBITDA and free cash flows, non-GAAP measures, to the most directly comparable GAAP measures in accordance with Section 401(b) of the Sarbanes-Oxley Act.