Download as PDF, PPTX

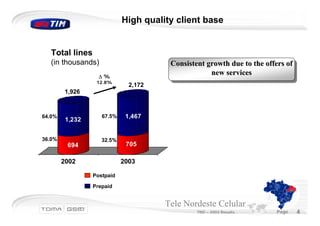
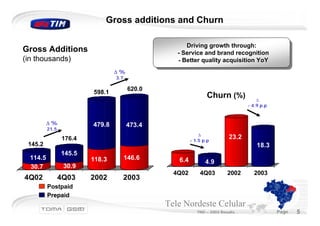
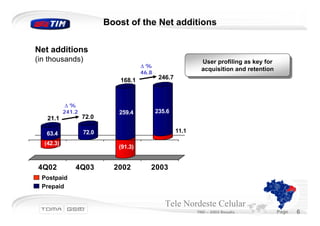
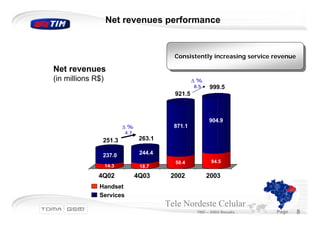
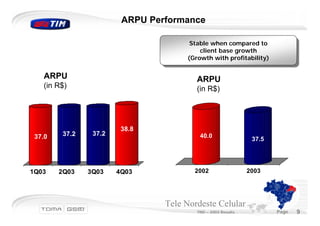
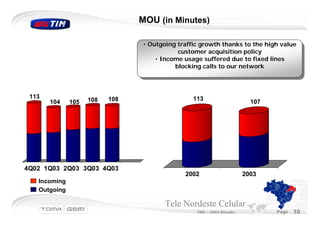
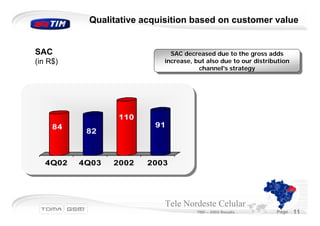
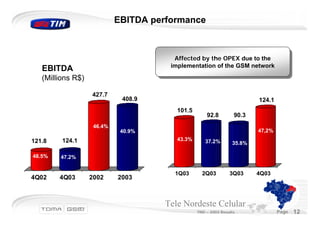
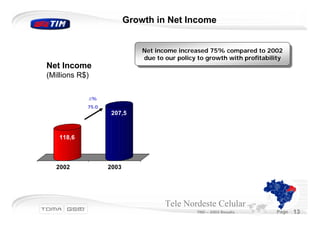


Tele Nordeste Celular saw growth in 2003 through strategies like launching GSM services, developing new services focused on corporate customers, acquiring high-value customers, and reducing churn. Key metrics like net additions increased significantly from 2002 to 2003. EBITDA was affected by costs from the GSM launch but net income still grew 75% over 2002. The company's focus on growth with profitability helped drive financial performance despite network expansion investments.


