Download as PDF, PPTX


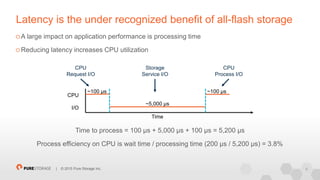
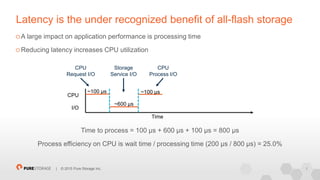
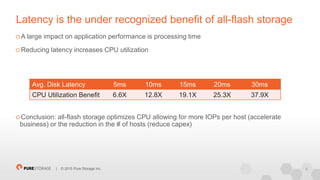
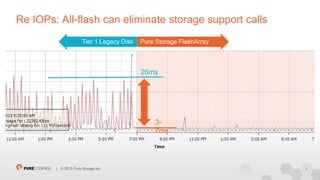
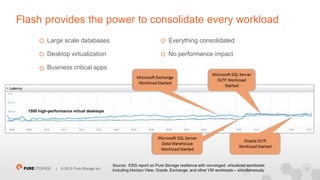
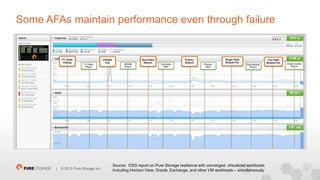
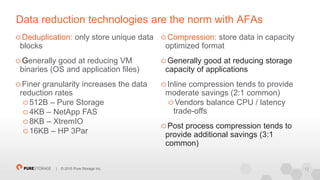
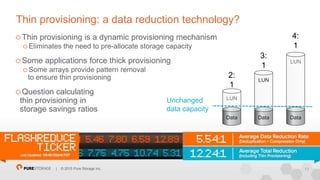


The document discusses the advantages of all-flash storage solutions, highlighting their ability to optimize CPU performance and reduce latency, which can significantly impact application efficiency and reduce overall operational costs. It addresses common misconceptions about all-flash arrays and explains storage technologies such as deduplication and compression that enhance storage efficiency. Additionally, the document emphasizes the importance of rigorous benchmarking and testing for ensuring performance and resilience in storage infrastructure.


