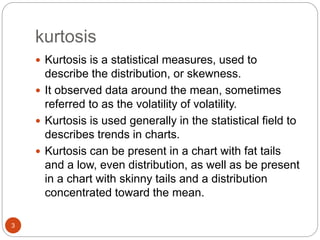
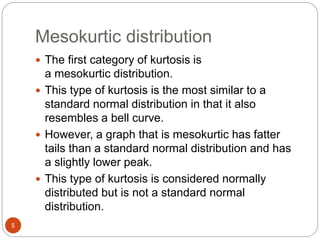
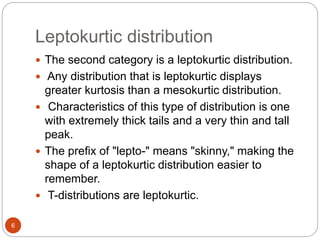
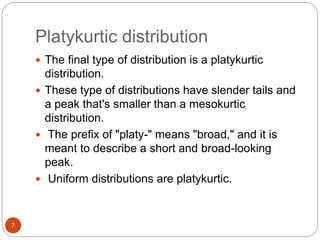
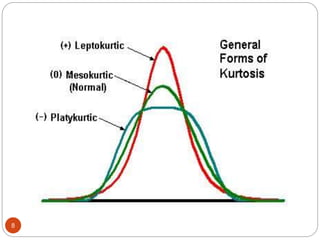
Presented By: Rishi Ram Khanal
BIM (TU)
Presentation on Kurtosis
1
contents
 Definition of Kurtosis
 Types of Kurtosis
Mesokurtic
distribution
Leptokurtic
distribution
Platykurtic distribution
2
kurtosis
 Kurtosis is a statistical measures, used to
describe the distribution, or skewness.
 It observed data around the mean, sometimes
referred to as the volatility of volatility.
 Kurtosis is used generally in the statistical field to
describes trends in charts.
 Kurtosis can be present in a chart with fat tails
and a low, even distribution, as well as be present
in a chart with skinny tails and a distribution
concentrated toward the mean.
3
4
Mesokurtic distribution
 The first category of kurtosis is
a mesokurtic distribution.
 This type of kurtosis is the most similar to a
standard normal distribution in that it also
resembles a bell curve.
 However, a graph that is mesokurtic has fatter
tails than a standard normal distribution and has
a slightly lower peak.
 This type of kurtosis is considered normally
distributed but is not a standard normal
distribution.
5
Leptokurtic distribution
 The second category is a leptokurtic distribution.
 Any distribution that is leptokurtic displays
greater kurtosis than a mesokurtic distribution.
 Characteristics of this type of distribution is one
with extremely thick tails and a very thin and tall
peak.
 The prefix of "lepto-" means "skinny," making the
shape of a leptokurtic distribution easier to
remember.
 T-distributions are leptokurtic.
6
Platykurtic distribution
 The final type of distribution is a platykurtic
distribution.
 These type of distributions have slender tails and
a peak that's smaller than a mesokurtic
distribution.
 The prefix of "platy-" means "broad," and it is
meant to describe a short and broad-looking
peak.
 Uniform distributions are platykurtic.
7
8
9
10

Presentation on kurtosis statistics

  • 1.
    Presented By: RishiRam Khanal BIM (TU) Presentation on Kurtosis 1
  • 2.
    contents  Definition ofKurtosis  Types of Kurtosis Mesokurtic distribution Leptokurtic distribution Platykurtic distribution 2
  • 3.
    kurtosis  Kurtosis isa statistical measures, used to describe the distribution, or skewness.  It observed data around the mean, sometimes referred to as the volatility of volatility.  Kurtosis is used generally in the statistical field to describes trends in charts.  Kurtosis can be present in a chart with fat tails and a low, even distribution, as well as be present in a chart with skinny tails and a distribution concentrated toward the mean. 3
  • 4.
  • 5.
    Mesokurtic distribution  Thefirst category of kurtosis is a mesokurtic distribution.  This type of kurtosis is the most similar to a standard normal distribution in that it also resembles a bell curve.  However, a graph that is mesokurtic has fatter tails than a standard normal distribution and has a slightly lower peak.  This type of kurtosis is considered normally distributed but is not a standard normal distribution. 5
  • 6.
    Leptokurtic distribution  Thesecond category is a leptokurtic distribution.  Any distribution that is leptokurtic displays greater kurtosis than a mesokurtic distribution.  Characteristics of this type of distribution is one with extremely thick tails and a very thin and tall peak.  The prefix of "lepto-" means "skinny," making the shape of a leptokurtic distribution easier to remember.  T-distributions are leptokurtic. 6
  • 7.
    Platykurtic distribution  Thefinal type of distribution is a platykurtic distribution.  These type of distributions have slender tails and a peak that's smaller than a mesokurtic distribution.  The prefix of "platy-" means "broad," and it is meant to describe a short and broad-looking peak.  Uniform distributions are platykurtic. 7
  • 8.
  • 9.
  • 10.