• The distributionrefers to the overall “shape” of the data. This can be
depicted on a chart such as a histogram or a dot plot and includes
properties such as the probability distribution function, skewness, and
kurtosis.
• Descriptive statistics can also describe differences between observed
characteristics of the elements of a data set. They can help us
understand the collective properties of the elements of a data sample
and form the basis for testing hypotheses and making predictions
using inferential statistics.
3.
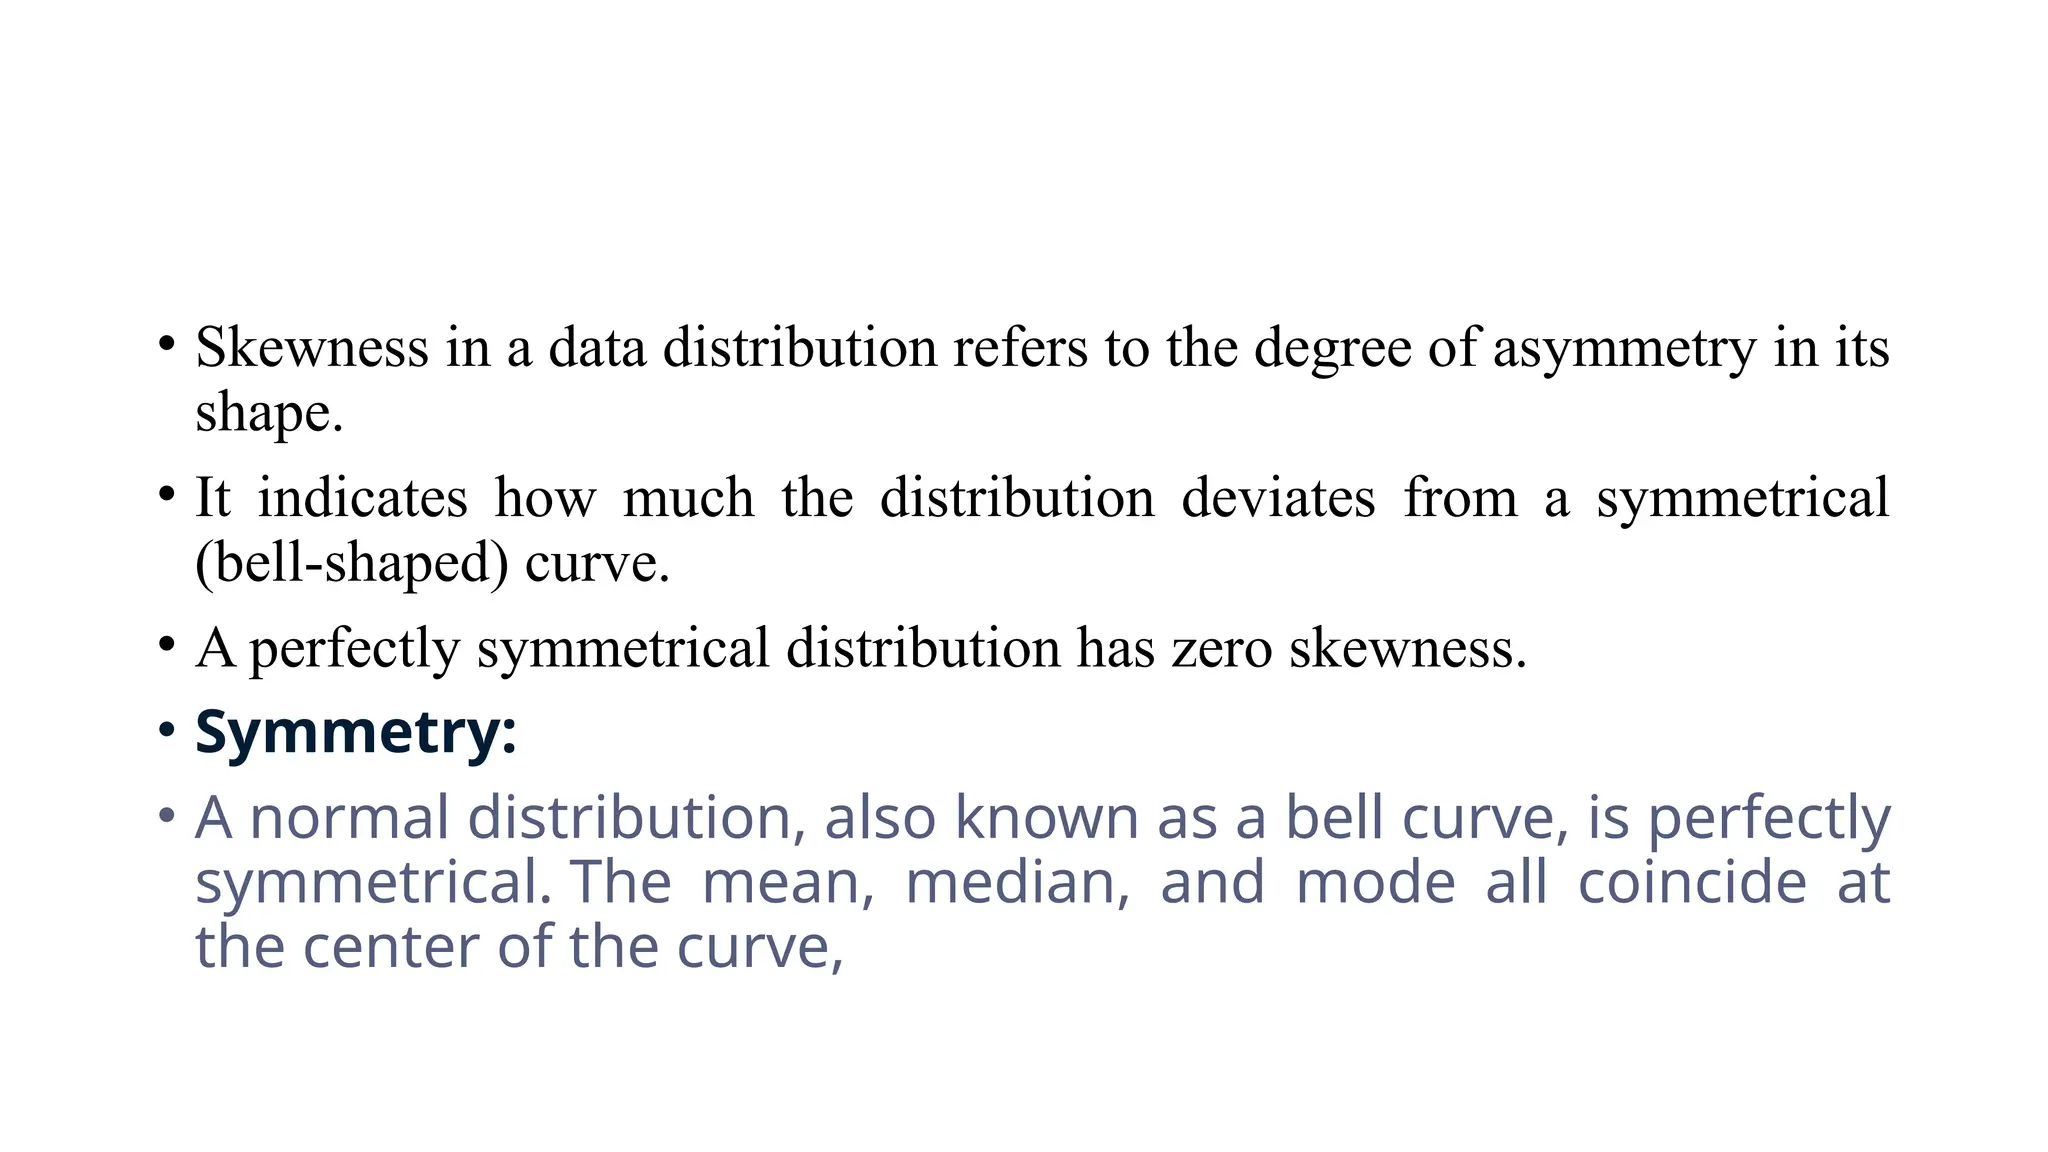
• Skewness ina data distribution refers to the degree of asymmetry in its
shape.
• It indicates how much the distribution deviates from a symmetrical
(bell-shaped) curve.
• A perfectly symmetrical distribution has zero skewness.
• Symmetry:
• A normal distribution, also known as a bell curve, is perfectly
symmetrical. The mean, median, and mode all coincide at
the center of the curve,
4.
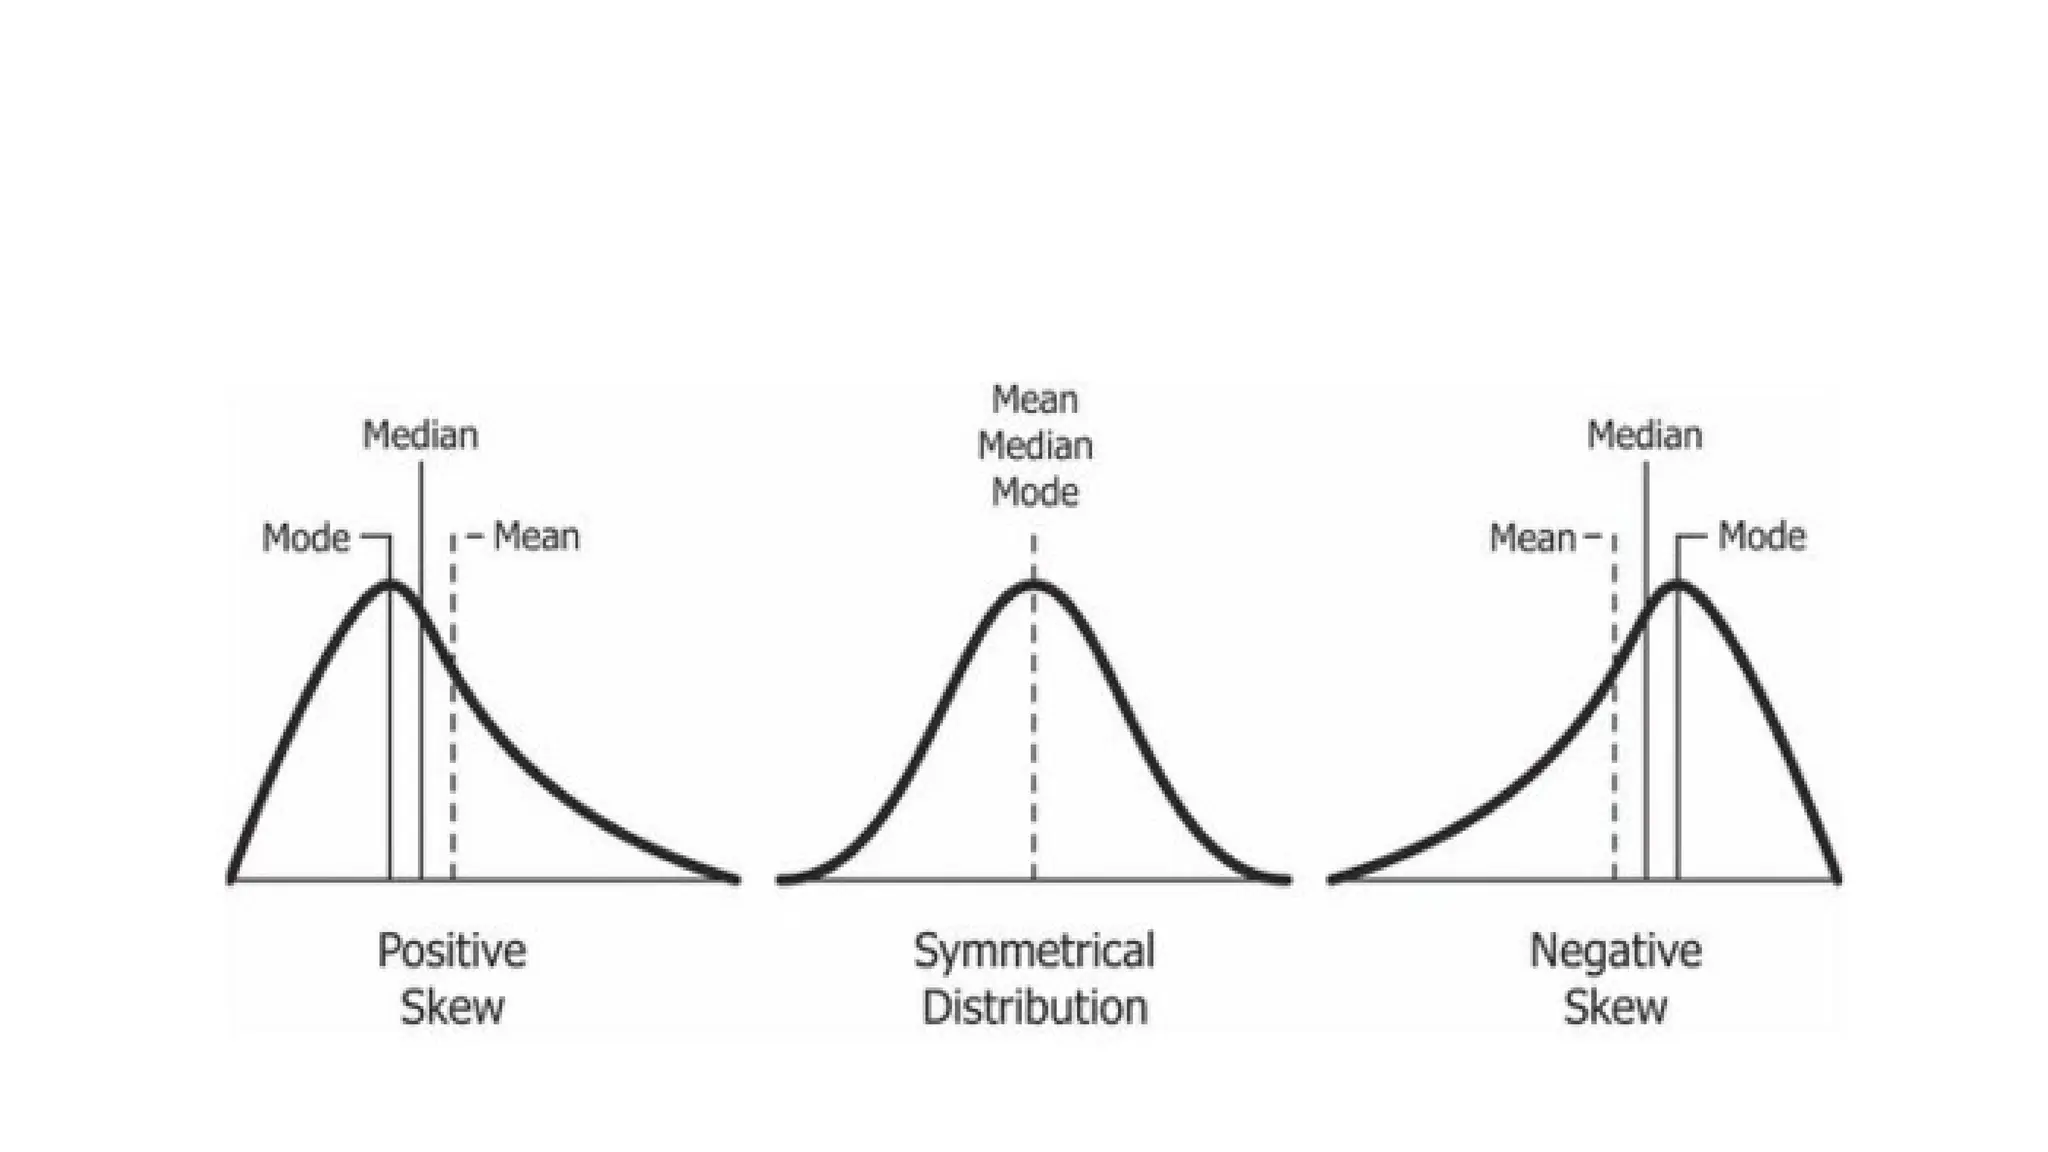
• Positively Skewed:
•In a positively skewed distribution, the tail on the right side (towards
higher values) is longer than the tail on the left. This indicates that
there are more data points on the lower side of the distribution
compared to the higher side. The mean is usually greater than the
median, which is greater than the mode.
• Negatively Skewed:
• In a negatively skewed distribution, the tail on the left side (towards
lower values) is longer than the tail on the right. This suggests that
there are more data points on the higher side of the distribution
compared to the lower side. The mean is usually less than the
median, which is less than the mode.
7.
Outliers
• In statistics,an outlier is a data point that differs significantly from other
observations.
• An outlier may be due to a variability in the measurement, an indication of novel
data, or it may be the result of experimental error; the latter are sometimes excluded
from the data set.
• In especially small sample sizes, a single outlier may dramatically affect averages
and skew the study's final results.
• Outliers can sometimes indicate errors or poor methods of sample gathering. They
can also indicate an anomaly or something of interest to study since it's not always
possible to determine if outliers are in error. Although the effects of outliers can skew
results of statistics, it is rare that they are entirely removed from results without
observations.
8.
KUROTSIS
• Kurtosis isa measure of the tailedness of a distribution.
Tailedness is how often outliers occur. Excess kurtosis is the
tailedness of a distribution relative to a normal distribution.
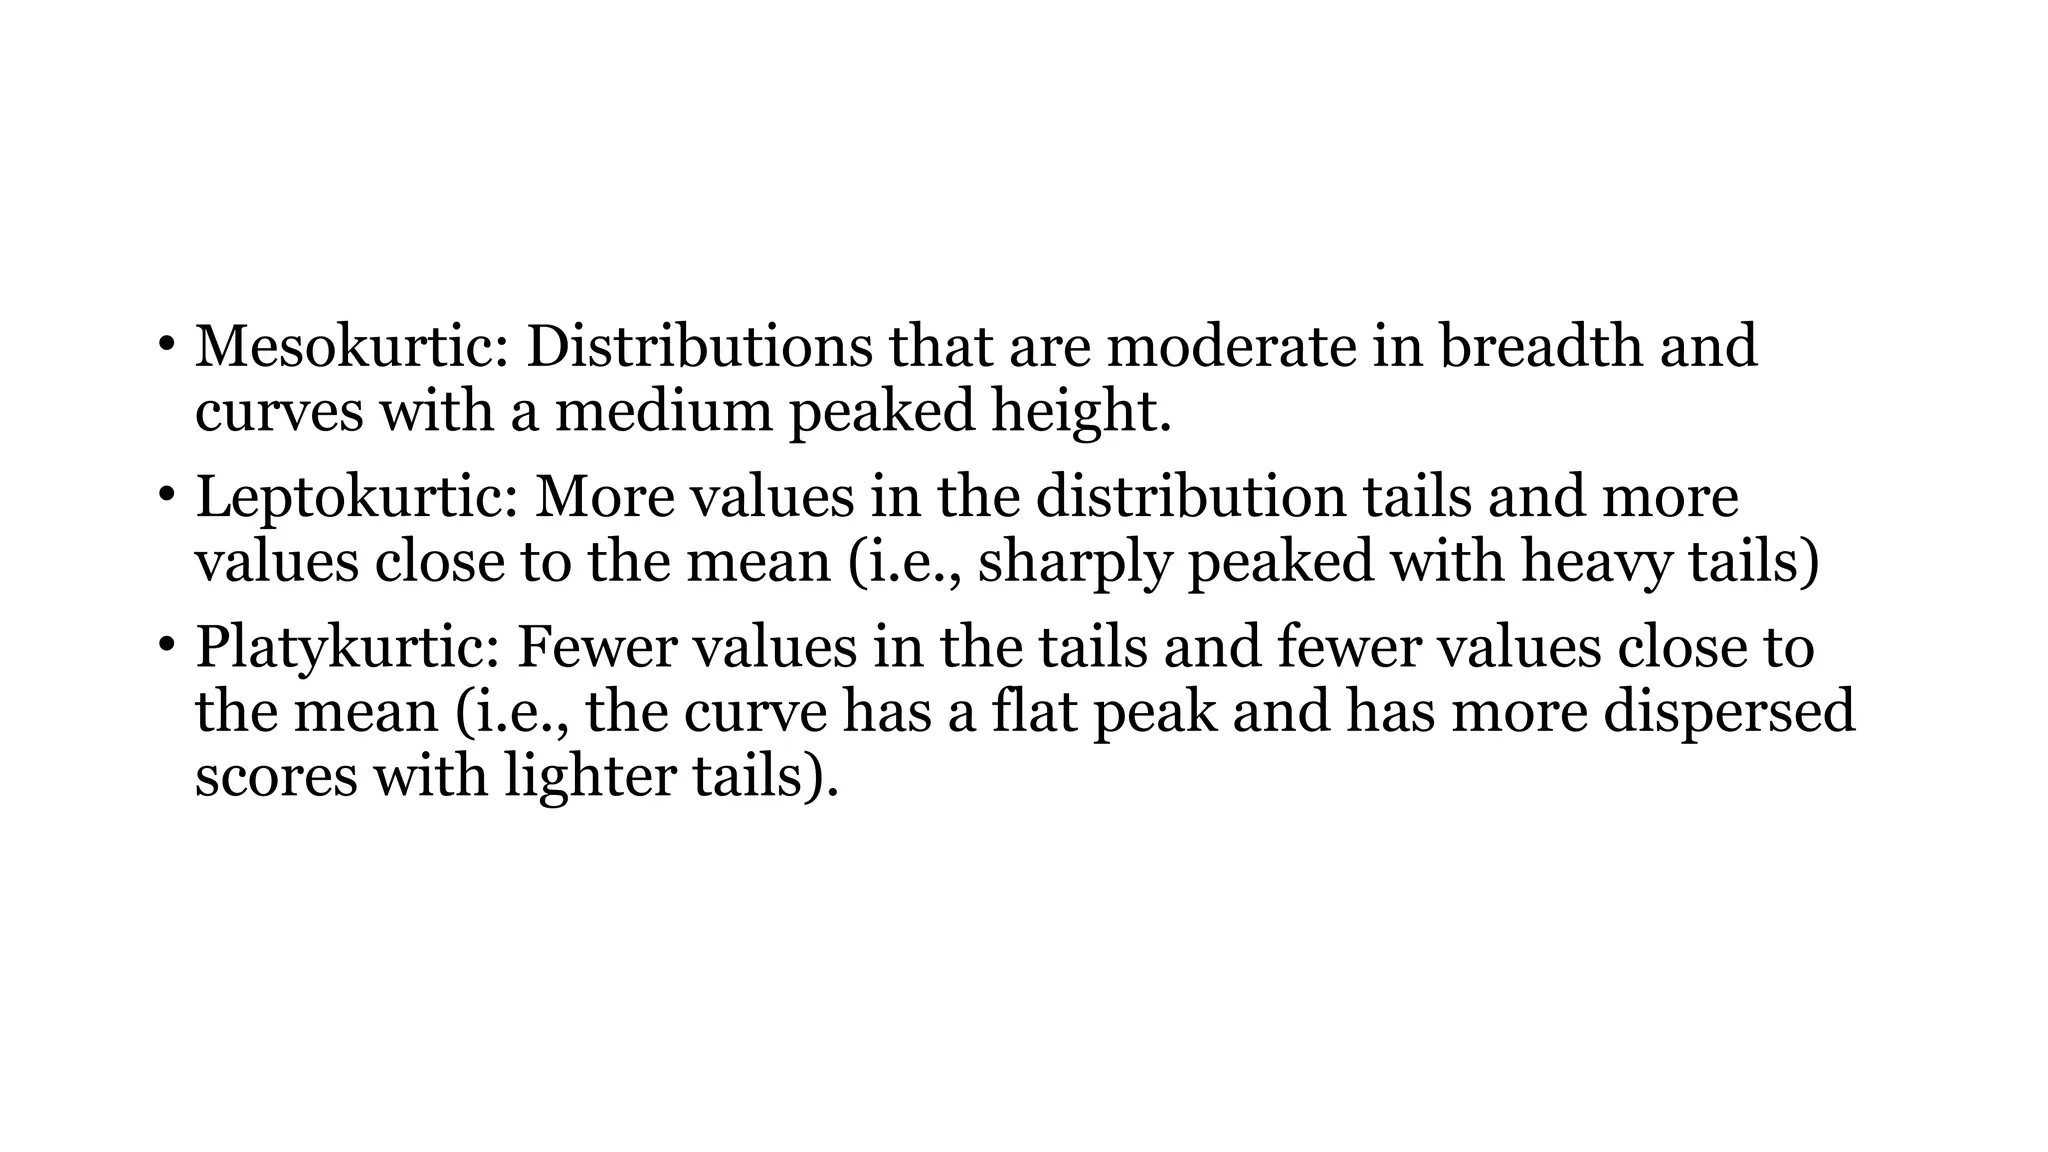
• Mesokurtic: Distributionsthat are moderate in breadth and
curves with a medium peaked height.
• Leptokurtic: More values in the distribution tails and more
values close to the mean (i.e., sharply peaked with heavy tails)
• Platykurtic: Fewer values in the tails and fewer values close to
the mean (i.e., the curve has a flat peak and has more dispersed
scores with lighter tails).
11.
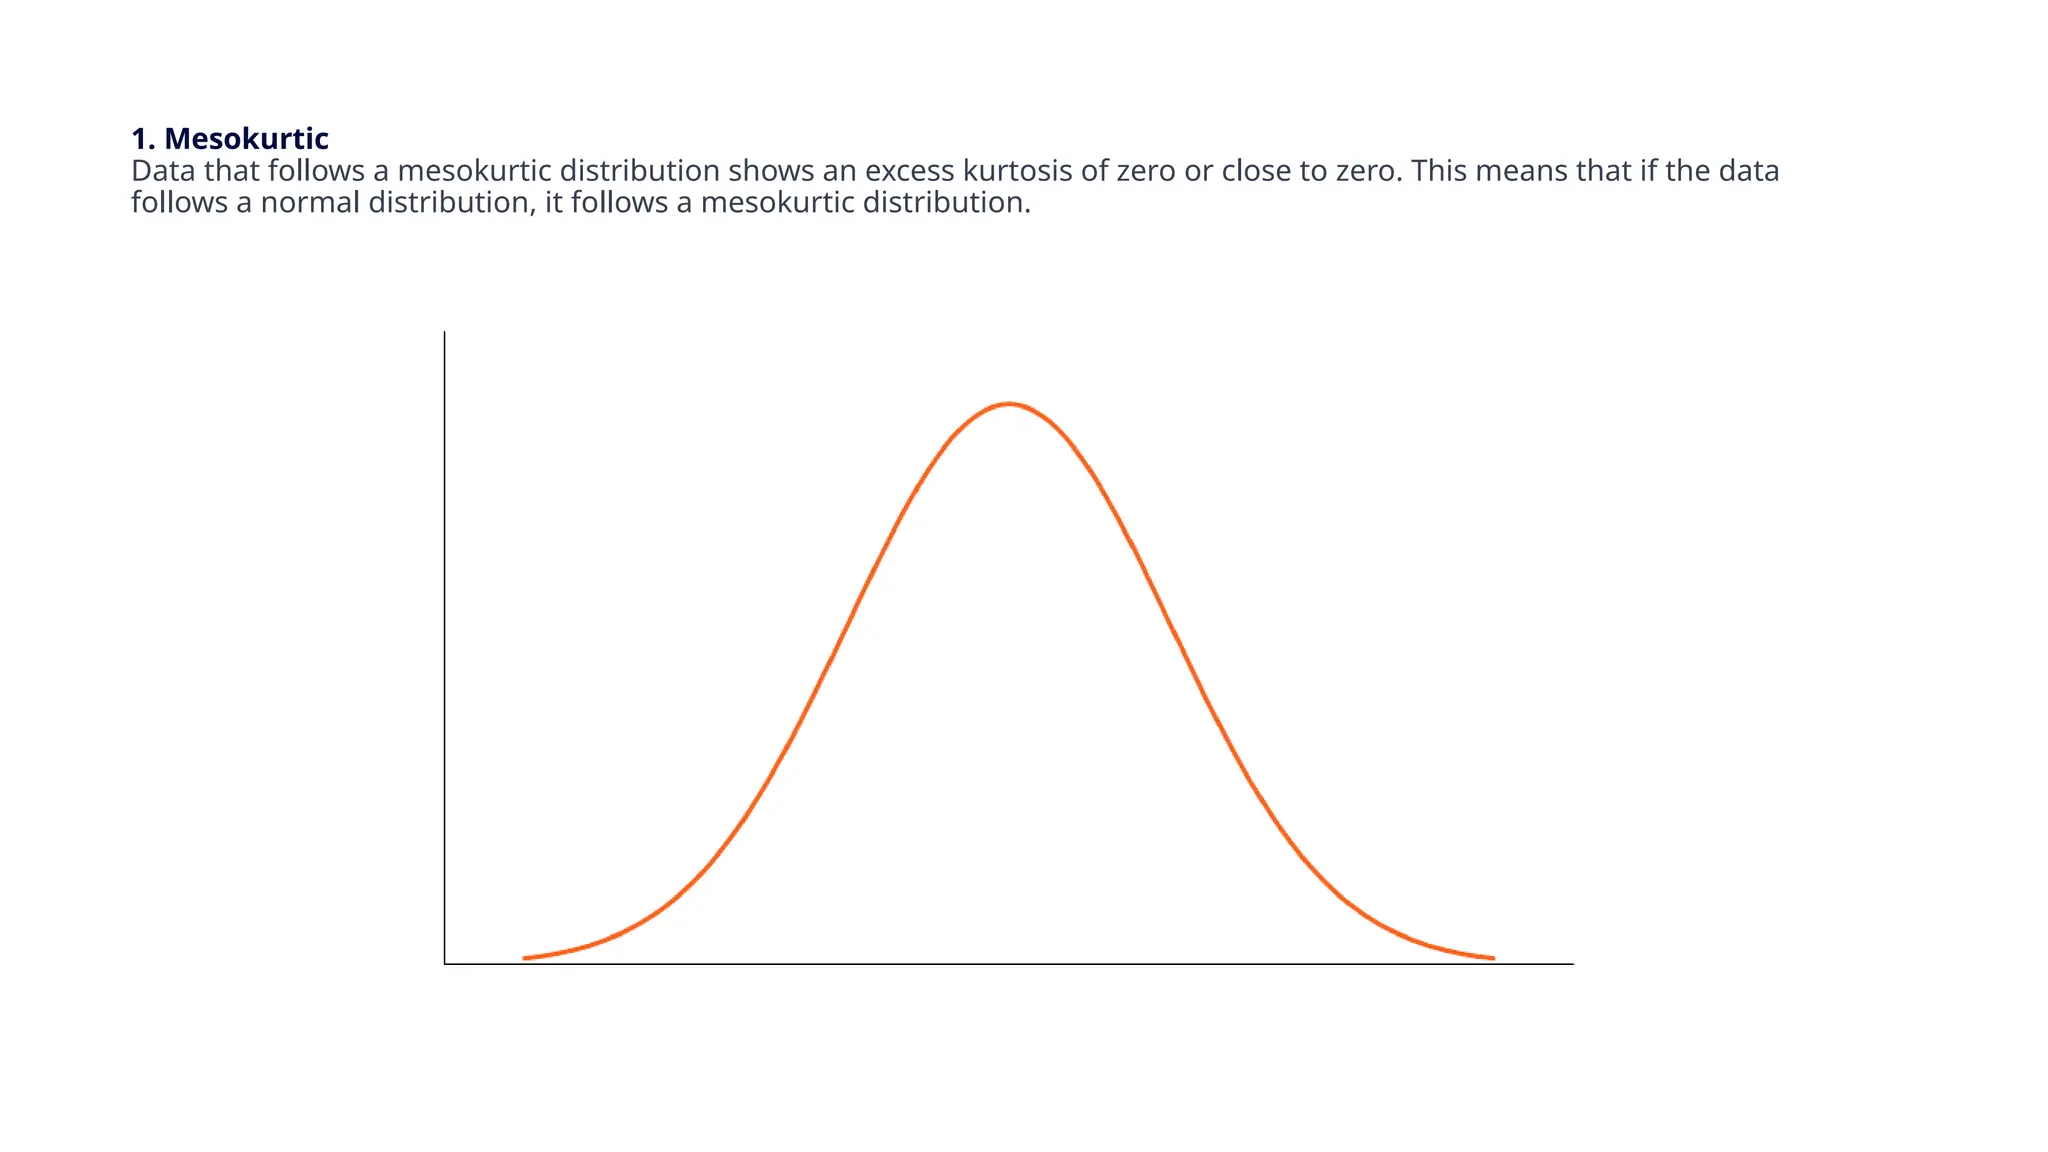
1. Mesokurtic
Data thatfollows a mesokurtic distribution shows an excess kurtosis of zero or close to zero. This means that if the data
follows a normal distribution, it follows a mesokurtic distribution.
12.
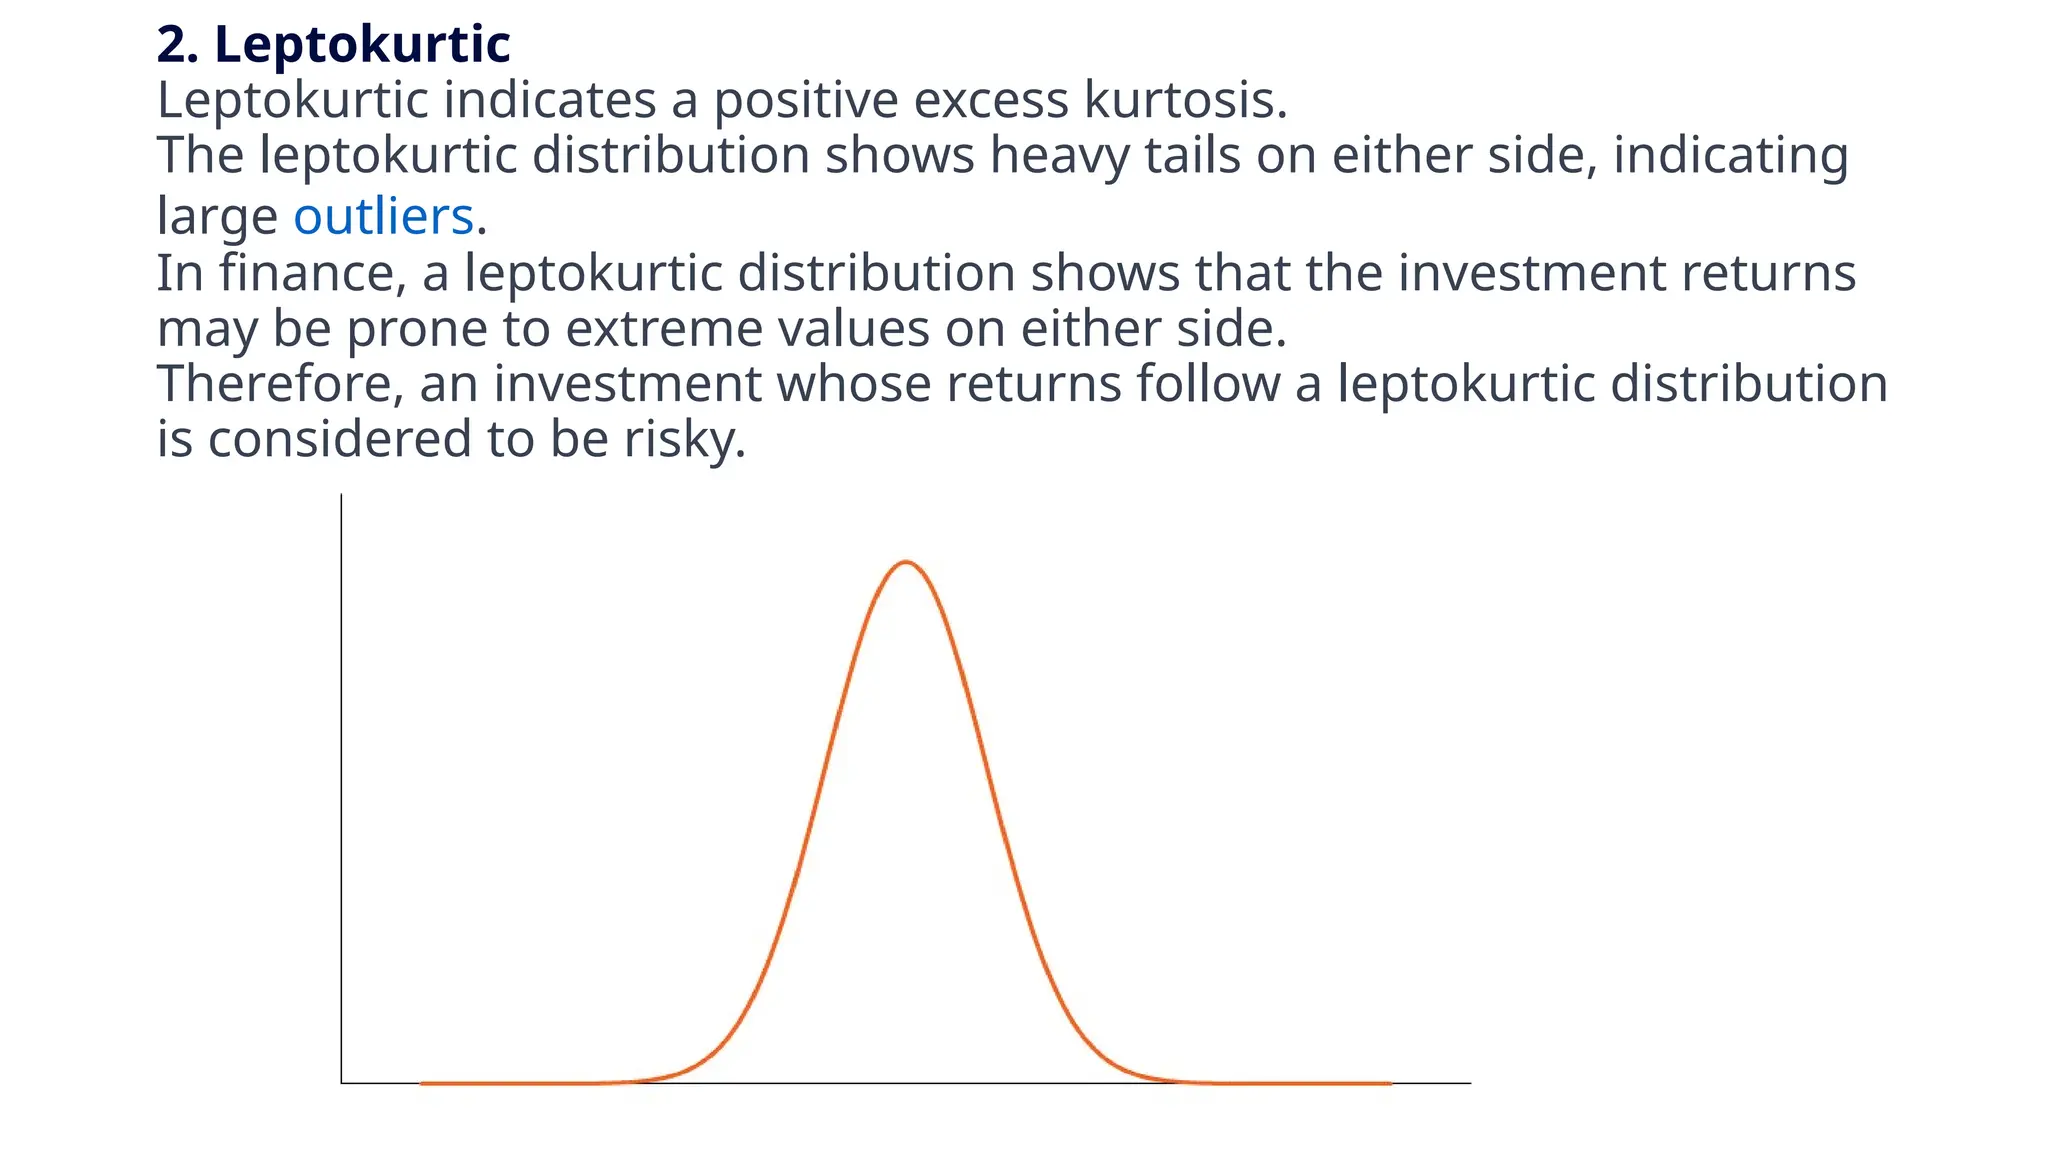
2. Leptokurtic
Leptokurtic indicatesa positive excess kurtosis.
The leptokurtic distribution shows heavy tails on either side, indicating
large outliers.
In finance, a leptokurtic distribution shows that the investment returns
may be prone to extreme values on either side.
Therefore, an investment whose returns follow a leptokurtic distribution
is considered to be risky.
13.
3. Platykurtic
A platykurticdistribution shows a negative excess kurtosis.
The kurtosis reveals a distribution with flat tails.
The flat tails indicate the small outliers in a distribution. In the finance
context, the platykurtic distribution of the investment returns is
desirable for investors because there is a small probability that the
investment would experience extreme returns.


![Skewness and Kurtosis[1].pptx](https://cdn.slidesharecdn.com/ss_thumbnails/skewnessandkurtosis1-230825165704-d8480639-thumbnail.jpg?width=640&height=640&fit=bounds)