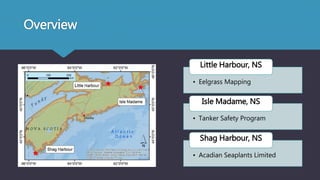
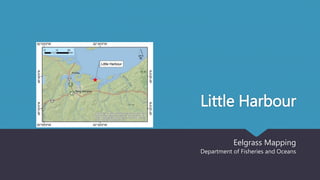
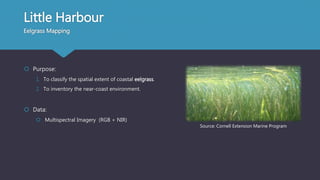
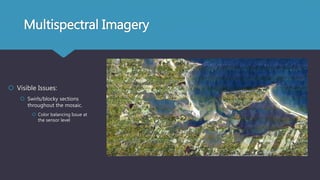
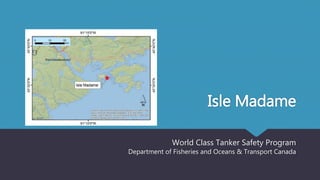
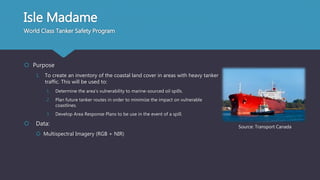
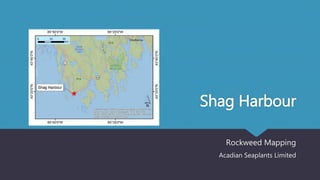
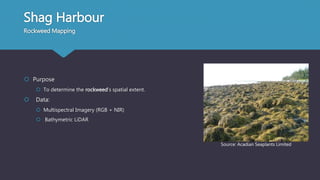
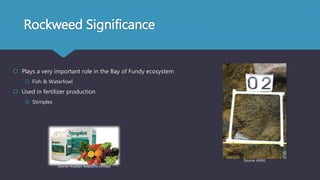
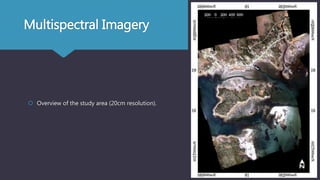
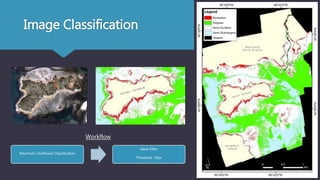
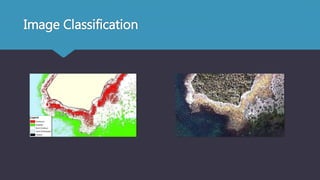
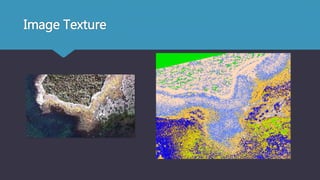
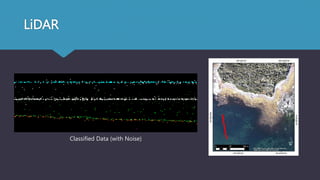
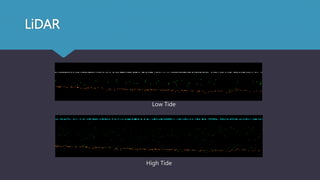
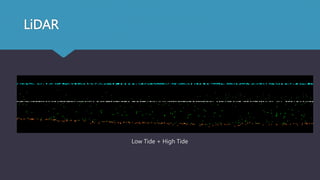
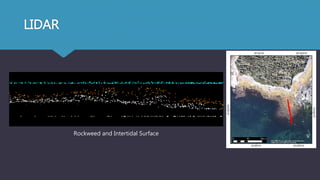
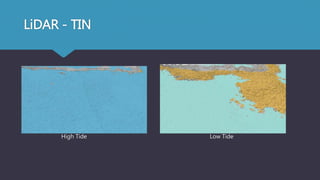
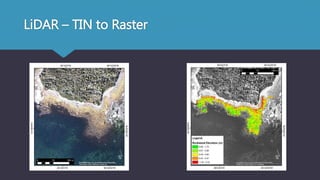
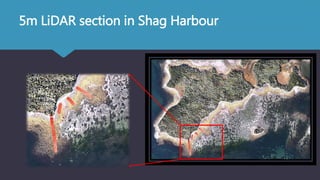
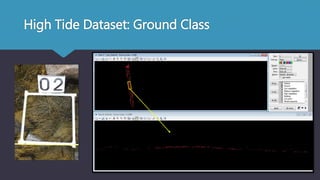
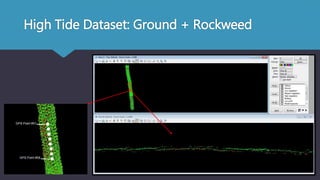
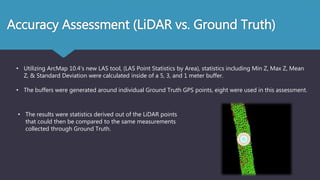
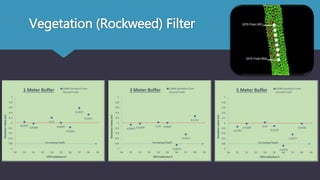
4. Little Harbour
Eelgrass Mapping
Purpose:
1. To classify the spatial extent of coastal eelgrass.
2. To inventory the near-coast environment.
Data:
Multispectral Imagery (RGB + NIR)
Source: Cornell Extension Marine Program
5. Eelgrass Significance
Among the most productive & Biologically diverse ecosystems
Functions:
Seafloor & Shoreline Stabilization, Flora & Fauna habitat, supports the Detrital food web foundation.
Considered a sentinel species for evaluating ecosystem health
Biggest Disturbances:
Declining water quality & Physical Disturbance
6. Multispectral Imagery
Visible Issues:
Swirls/blocky sections
throughout the mosaic.
Color balancing Issue at
the sensor level
8. Isle Madame
World Class Tanker Safety Program
Department of Fisheries and Oceans & Transport Canada
9. Isle Madame
World Class Tanker Safety Program
Purpose
1. To create an inventory of the coastal land cover in areas with heavy tanker
traffic. This will be used to:
1. Determine the area’s vulnerability to marine-sourced oil spills.
2. Plan future tanker routes in order to minimize the impact on vulnerable
coastlines.
3. Develop Area Response Plans to be use in the event of a spill.
Data:
Multispectral Imagery (RGB + NIR)
Source: Transport Canada
10. Significance
Each year, 80 million tonnes of oil are shipped in Canadian
coastal waters (Transport Canada)
Oil is transported by waves and accumulates in the intertidal
zone
Knowing the intertidal zone’s composition is paramount
Source: National Park Service (USA)
Source: Jacqui Michel - Research Planning Inc.
11. Imagery
Overview of the study area (5cm
resolution).
Note: Mosaic produced by Nathan Crowell
12. Classification
Clip
•Change 0 values to NoData
Generate Signature Files
•Select training areas from 1 image per flight line
Maximum Likelihood Classification
•Using 1 signature file per flight line
Workflow
13. Mosaic per Flight Line
Create Mosaic Dataset
• Creates empty mosaic datasets for
each flight line (11 in total)
Add Rasters to Mosaic Dataset
• Using a wildcard to differentiate
flight lines (ie. o_ims001_*)
Build Seamlines
•Method: Radiometric
•No smoothing (categorical data)
Mosaic to New Raster
•Generates a mosaicked image for
each flight line
Workflow
14. Class Aggregation
Add Field
•“Class” -> A number from 1-10 representing universal classes
Lookup Tool
•Generates a raster for each flight line based on the universal “Class”
field
Class ID Classes
1 Sand
2 Pebbles
3 Rocks
4 Eelgrass
5 Rockweed
6 Coastal Grasses
7 Driftwood
8 Shadow
9 Deep Water
10 Cultural Features
Workflow
15. Final Mosaic
Create Mosaic Dataset
• Creates an empty mosaic dataset
Add Rasters to Mosaic Dataset
• Adds each mosaicked flight line to
the final mosaic dataset
Build Seamlines
•Method: Radiometric
•No smoothing (categorical data)
Mosaic to New Raster
•Generates a mosaic based on the
composite of all 11 flight lines
16. Tidal Ranges
Based on a 2m DEM
Values required:
Type Value Source
Chart Datum Offset 0.545m Canadian Hydrographic Service
Lowest Astronomical Tide (LAT)
Highest Astronomical Tide (HAT)
LAT: -0.36m (CD), -
0.905m (CGVD28)
HAT: 2.16m (CD),
1.615m (CGVD28)
Closest active tidal gage was used as a proxy (North Sydney)
• Acquired 19 years worth of hourly data (01-01-1999 to 01-01-2015)
• Minimum and maximum tidal height values were found with Excel
• Converted from Chart Datum to CGVD28 ortho-height using the Chart Datum Offset for
North Sydney
Tidal Surge (1m & 2m) 2.615m and 3.615m HAT + surge value
21. Rockweed Significance
Plays a very important role in the Bay of Fundy ecosystem
Fish & Waterfowl
Used in fertilizer production
Stimplex
Source: Acadian Seaplants Limited
Source: AGRG
35. Accuracy Assessment (LiDAR vs. Ground Truth)
• Utilizing ArcMap 10.4’s new LAS tool, (LAS Point Statistics by Area), statistics including Min Z, Max Z, Mean
Z, & Standard Deviation were calculated inside of a 5, 3, and 1 meter buffer.
• The buffers were generated around individual Ground Truth GPS points, eight were used in this assessment.
• The results were statistics derived out of the LiDAR points
that could then be compared to the same measurements
collected through Ground Truth.
38. Conclusions
High resolution multispectral imagery can be a valuable asset to decision-makers
Allows for the acquisition of surface data on a large scale
More efficient than ground-based techniques
Based off of the results comparing the Ground Truthing to the LiDAR collected:
It’s plausible that just flying a high tide scan could provide the user with enough information to map the
inventory of coastal vegetation.
More transects would have to be evaluated on accuracy and the ground class would have to be a bit more
refined.