Water quality standards and its effects on miralam tank and surrounding environment
•
1 like•325 views

Abstract Water quality & Soil Degradation impact is determined by chemical analysis and with Remote sensing &GIS ; this data is used for purposes such as analysis, classification, and correlation. The graphical interpretations which assist to understand the hydrochemical studies, which likely to be effects on the miralam tank and surrounding environment. In this paper the presentation of the statistical and graphical methods used to classify hydro-chemical data is tested, analyzed and compared to minimize the effects. Keywords: Drinking Water Standard, Surface Water Quality, Environmental Degradation, Sustainable Development, Geographic Information System, Graphical Representation, BIS, WHO, Hyderabad, Telangana

Recommended
Recommended
More Related Content
What's hot
What's hot (7)
Viewers also liked
Viewers also liked (10)
Similar to Water quality standards and its effects on miralam tank and surrounding environment
Similar to Water quality standards and its effects on miralam tank and surrounding environment (20)
More from eSAT Journals
More from eSAT Journals (20)
Recently uploaded
Recently uploaded (20)
Water quality standards and its effects on miralam tank and surrounding environment
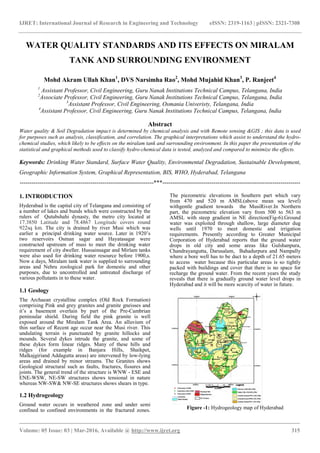
- 1. IJRET: International Journal of Research in Engineering and Technology eISSN: 2319-1163 | pISSN: 2321-7308 _______________________________________________________________________________________ Volume: 05 Issue: 03 | Mar-2016, Available @ http://www.ijret.org 315 WATER QUALITY STANDARDS AND ITS EFFECTS ON MIRALAM TANK AND SURROUNDING ENVIRONMENT Mohd Akram Ullah Khan1 , DVS Narsimha Rao2 , Mohd Mujahid Khan3 , P. Ranjeet4 1 Assistant Professor, Civil Engineering, Guru Nanak Institutions Technical Campus, Telangana, India 2 Associate Professor, Civil Engineering, Guru Nanak Institutions Technical Campus, Telangana, India 3 Assistant Professor, Civil Engineering, Osmania Univeristy, Telangana, India 4 Assistant Professor, Civil Engineering, Guru Nanak Institutions Technical Campus, Telangana, India Abstract Water quality & Soil Degradation impact is determined by chemical analysis and with Remote sensing &GIS ; this data is used for purposes such as analysis, classification, and correlation. The graphical interpretations which assist to understand the hydro- chemical studies, which likely to be effects on the miralam tank and surrounding environment. In this paper the presentation of the statistical and graphical methods used to classify hydro-chemical data is tested, analyzed and compared to minimize the effects. Keywords: Drinking Water Standard, Surface Water Quality, Environmental Degradation, Sustainable Development, Geographic Information System, Graphical Representation, BIS, WHO, Hyderabad, Telangana --------------------------------------------------------------------***---------------------------------------------------------------------- 1. INTRODUCTION Hyderabad is the capital city of Telangana and consisting of a number of lakes and bunds which were constructed by the rulers of Qutubshahi dynasty, the metro city located at 17.3850 Latitude and 78.4867 Longitude covers round 922sq km. The city is drained by river Musi which was earlier a principal drinking water source. Later in 1920’s two reservoirs Osman sagar and Hayatasagar were constructed upstream of musi to meet the drinking water requirement of city dweller. Hussainsagar and Mirlam tanks were also used for drinking water resource before 1900,s. Now a days, Miralam tank water is supplied to surrounding areas and Nehru zoological park for domestic and other purposes, due to uncontrolled and untreated discharge of various pollutants in to these water. 1.1 Geology The Archaean crystalline complex (Old Rock Formation) comprising Pink and grey granites and granite gneisses and it’s a basement overlain by part of the Pre-Cambrian peninsular shield. During field the pink granite is well exposed around the Miralam Tank Area. An alluvium of thin surface of Recent age occur near the Musi river. This undulating terrain is punctuated by granite hillocks and mounds. Several dykes intrude the granite, and some of these dykes form linear ridges. Many of these hills and ridges (for example in Banjara Hills, Shaikpet, Malkajgiriand Addagutta areas) are intervened by low-lying areas and drained by minor streams. The Granites shows Geological structural such as faults, fractures, fissures and joints. The general trend of the structure is WNW - ESE and ENE-WSW, NE-SW structures shows tensional in nature whereas NW-SW& NW-SE structures shows shears in type. 1.2 Hydrogeology Ground water occurs in weathered zone and under semi confined to confined environments in the fractured zones. The piezometric elevations in Southern part which vary from 470 and 520 m AMSL(above mean sea level) withgentle gradient towards the MusiRiver.In Northern part, the piezometric elevation vary from 500 to 563 m AMSL with steep gradient in NE direction(Fig-6).Ground water was exploited through shallow, large diameter dug wells until 1970 to meet domestic and irrigation requirements. Presently according to Greater Municipal Corporation of Hyderabad reports that the ground water drops in old city and some areas like Gulshanpura, Chandrayangutta, Darusalam, Bahadurpura and Nampally where a bore well has to be duct to a depth of 21.65 meters to access water because this particular areas is so tightly packed with buildings and cover that there is no space for recharge the ground water. From the recent years the study reveals that there is gradually ground water level drops in Hyderabad and it will be more scarcity of water in future. Figure -1: Hydrogeology map of Hyderabad
- 2. IJRET: International Journal of Research in Engineering and Technology __________________________________________________________ Volume: 05 Issue: 03 | Mar-2016, Available @ 1.3 Geography and Climate Talangana Climate is generally hot and humid. The major role in determining the climate of the state is played by South- West Monsoons. But the winters in Hyderabad are pleasant. This is the time when the state attracts most of its tourists. Summers in Telangana last from the month of March to June. During these months the moisture level is quite high. In the coastal plain the summer temperatures are generally higher than the rest of the state. In summer temperature generally ranges between 20°C an certain places the temperature as high as 45 degrees on a summer day. July to September is the season for tropical rains in Telangana. The state receives heavy rainfall during these months. About one third of the total rainfall in Telanagna is brought by the North- East Monsoons. Sometime around the month of October winter arrives in the state. October, November, December, January and February are the winter months in Telangana. Since the state has a reasonably long coastal belt the winters are no The range of winter temperature is generally 13°C to 30°C. Since the Telangana Climate is not much favourable during the major part of the year, So October to February is the best time to visit the state. The annual rainfall varies from 512.8 mm in the central region to 1025.6 mm toward 2. STUDY AREA Foundation of Miralam tank laid on 20 July 1804 and completed in about 2 years on 8 June 1806 and located in city latitude and longitude coordinate 17°21 78°26′E.impoundment intended mainly to cater to the water supply needs of Hyderabad and its Industrial Suburbs. At present it serves as standby reservoir for supplying water to the adjacent, Nehru Zoological Park which is present at downstream side. The present study has done to portr water quality and biological characteristics and their diurnal changes under the constraints of resources the present investigation was under taken to elucidate certain aspects of physico-chemical parameters of water and its effects of Mir AlamLake, with reference to water quality and pollution during pre-moon & Post Monsoon. Figure.2 Map showing Miralam Tank Watershed IJRET: International Journal of Research in Engineering and Technology eISSN: 2319 ______________________________________________________________________________ , Available @ http://www.ijret.org Talangana Climate is generally hot and humid. The major role in determining the climate of the state is played by West Monsoons. But the winters in Hyderabad are pleasant. This is the time when the state attracts most of its rs in Telangana last from the month of March to June. During these months the moisture level is quite high. In the coastal plain the summer temperatures are generally higher than the rest of the state. In summer temperature generally ranges between 20°C and 40°C At certain places the temperature as high as 45 degrees on a summer day. July to September is the season for tropical rains in Telangana. The state receives heavy rainfall during these months. About one third of the total rainfall in East Monsoons. Sometime around the month of October winter arrives in the state. October, November, December, January and February are the winter months in Telangana. Since the state has a reasonably long coastal belt the winters are not much cold. The range of winter temperature is generally 13°C to 30°C. Since the Telangana Climate is not much favourable during the major part of the year, So October to February is the best time to visit the state. The annual rainfall varies from 512.8 mm in the central region to 1025.6 mm toward Foundation of Miralam tank laid on 20 July 1804 and it was completed in about 2 years on 8 June 1806 and located in city latitude and longitude coordinate 17°21′N mainly to cater to the water supply needs of Hyderabad and its Industrial Suburbs. At present it serves as standby reservoir for supplying water to the adjacent, Nehru Zoological Park which is present at downstream side. The present study has done to portray the water quality and biological characteristics and their diurnal changes under the constraints of resources the present investigation was under taken to elucidate certain aspects of chemical parameters of water and its effects of Mir with reference to water quality and pollution Map showing Miralam Tank Watershed SAMPLING STATIONS Four sampling stations were selected from the Mir Alam Lake and are characterized as follows: STATION I Station I is situated where the southern the Mir Alam lake in opposite Masjid e Medina. Clear water flows into the lake, throughout the year; except in the rainy season. During rainy season water inflow is largely associated with mud and sand. STATION II At this station water is polluted because excess water reaching this site by anthropogenic activities. STATION III Station III provided for the discharge of water to Zoo Park. At this station water is clear and it is used for washing and domestic purposes by the people. This stationhaving more vegetative cover. STATION IV Station IV is situated East site of MirAlam lake. This station is very important due to excess water reaching and overflows during rainy season. At this station water is polluted. Figure.3 Image Shows points of Collection of Miralam Tank (Stations: I Chart-1: The above chart bar shows the Effects of water quality parameters of Pre eISSN: 2319-1163 | pISSN: 2321-7308 _____________________________ 316 SAMPLING STATIONS Four sampling stations were selected from the Mir Alam Lake and are characterized as follows: Station I is situated where the southern the Mir Alam lake in opposite Masjid e Medina. Clear water flows into the lake, throughout the year; except in the rainy season. During rainy season water inflow is largely associated with mud and At this station water is polluted because excess water reaching this site by anthropogenic activities. Station III provided for the discharge of water to Zoo Park. At this station water is clear and it is used for washing and es by the people. This stationhaving more Station IV is situated East site of MirAlam lake. This station is very important due to excess water reaching and overflows during rainy season. At this station water is Image Shows points of Collection of Sampling of Miralam Tank (Stations: I-IV) The above chart bar shows the Effects of water quality parameters of Pre-monsoon
- 3. IJRET: International Journal of Research in Engineering and Technology eISSN: 2319-1163 | pISSN: 2321-7308 _______________________________________________________________________________________ Volume: 05 Issue: 03 | Mar-2016, Available @ http://www.ijret.org 317 Table: 1 showing the Reading of Physico-Parameter of 4 Stations at pre-monsoon season Parameters St-1 St-2 St-3 St-4 meadian ISI 1982 WHO 1971 BIS pH 8.92 8.83 8.95 8.79 8.8725 6.5-8.5 6.5-8.5 6.5-8.5 CO3- 50.14 52.24 54.01 58.34 53.6825 - - HCO3- 314.7 404.2 375.5 317.8 353.05 - - Cl 302.6 414.08 404.97 407.85 382.375 - 250 mg/L 250 mg/L D.O 3.5 2.6 2.7 4.1 3.225 6 mg/L 3 mg/L Organic.M 4.55 5.42 6.38 5.6 5.4875 Total Hardness 422.2 470 464 442 449.55 300 mg/L 300 mg/L 200 mg/L Ca2+ 110 90.71 82.7 91.44 93.7125 200 mg/L 75 mg/L 75 mg/L Mg2+ 36.46 37.9 34.8 32.64 35.45 100 mg/L 30 mg/L 30 mg/L PO4 3- 9.16 9 9.21 9.18 9.1375 NO2- 4.59 6.45 6.59 7.3 6.2325 NO3 2.7 3.2 2.13 2.67 2.675 45 mg/L SO4 2- 21.18 23.31 22.92 23.95 22.84 150 mg/L 200 mg/L TDS 965 1000 1150 1175 1072.5 mg/l EC 1200 1350 1550 1620 1430 m mhos/cm Physico-chemical parameters of water of Mir Alam lake (Post -monsoon Reading) Table: 2 showing the Reading of Physico-Parameter of 4 Stations at premonsoon season Parameters St-1 St-2 St-3 St-4 Median ISI 1982 WHO 1971 BIS pH 8.97 8.88 9.11 9.19 9.0375 6.5-8.5 6.5-8.5 6.5-8.5 CO3- 50.24 52.14 54.31 58.34 53.7575 - - HCO3- 354.7 411.77 405.19 367.06 384.68 - - Cl 336.6 448.08 447.97 417.85 412.625 - 250 mg/L 250 mg/L D.O 4.5 2.7 2.94 4.2 3.585 6 mg/L 3 mg/L Organic.M 5.75 6.42 6.8 5.4 6.0925 Total Hardness 434.33 488 474.11 452.33 462.1925 300 mg/L 300 mg/L 200 mg/L Ca2+ 111.64 92.71 86.22 85.04 93.9025 200 mg/L 75 mg/L 75 mg/L Mg2+ 35.17 38.66 36.77 33.44 36.01 100 mg/L 30 mg/L 30 mg/L PO4 3- 9.26 9.04 9.11 9.38 9.1975 NO2- 4.68 6.59 6.42 7.51 6.3 NO3 2.86 3.12 2.92 2.67 2.8925 45 mg/L SO4 2- 21.18 23.29 22.3 21.95 22.18 150 mg/L 200 mg/L TDS 300 350 410 408 367 mg/l EC 450 480 670 780 595 m mhos/cm Physico-chemical parameters of water of Mir Alam lake (Pre-monsoon Reading)
- 4. IJRET: International Journal of Research in Engineering and Technology __________________________________________________________ Volume: 05 Issue: 03 | Mar-2016, Available @ Chart-2: The above Chart bar shows the Effects of water quality parameters of Postmonsoon 3. RESULTS AND DISCUSSIONS COLLECTION OF WATER SAMPLES AND THEIR ANALYSIS The water samples were collected at different stations (4 no.) and analyzed the quality of water by using various physico-chemical parameters and collection of water samples with the help of coordinate points by Remote sensing and GIS which plays vital role for collection of water samples at regular interval of time i.e. monthly twice. They collected in polythene containers at monthly intervals for a period of 17 months from November 2014 to March 2016.Water samples were collected in separate standard glass bottles (BOD bottles) for the estimation of dissolved oxygen with necessary precautions. The samples were analysed on the same day in the laboratory for different physico-chemical parameters following the standard methods. The following factors had been estimated: pH, IJRET: International Journal of Research in Engineering and Technology eISSN: 2319 ______________________________________________________________________________ , Available @ http://www.ijret.org bar shows the Effects of water quality parameters of Postmonsoon COLLECTION OF WATER SAMPLES AND The water samples were collected at different stations (4 no.) and analyzed the quality of water by using various chemical parameters and collection of water samples with the help of coordinate points by Remote sensing and GIS which plays vital role for collection of water samples at regular interval of time i.e. monthly twice. ainers at monthly intervals for a period of 17 months from November 2014 to March Water samples were collected in separate standard glass bottles (BOD bottles) for the estimation of dissolved oxygen with necessary precautions. The samples were d on the same day in the laboratory for different chemical parameters following the standard methods. The following factors had been estimated: pH, CO3- , HCO3-,Cl, D.O , organic Matter Total Hardness, Ca2+, Mg2+, CO3-, PO4 3 ,TDS,EC The results obtained are given below: The watersamples shows variation in the pH level between one station to other stations. The average pH is 9.0375 in pre monsoon and average pH in postmonsoon is 8.872 and almost samples which were collected fro high alkalinity. Carbonates ranged from premonsoon and in postmonsoon is 53.68 Bicarbonates were present in an average range of 353.05mg/L in premonsoon and postmonsoon. Chlorides ranged from 412.625-382.375 postmonsoon. Dissolved oxygen was present in an average range of 3.585-3.225mg/L in premonsoon and postmonsoon. Organic matter ranged from premonsoon and postmonsoon. Total hardness were in the range of 462.1925-449.55mg/L with Ca and Mg 93.9 93.7mg/L and 36-35.45mg/L respectively in premonsoon and postmonsoon season, and nitrites of 2.89 premonsoon and postmonsoon season. Sulphate was present in an average range of 22.18 postmonsoon. Electrical conductivity were ranged from and 1430 m mhos/cm, and phosphates 9.1 premonsoon and postmonsoon season. CONCLUSION Based on the physico-chemical analysis, the obtained data conclude that waterhaving pH scale is nearly quality is deteriorated. The results indicated that certain parameters exceeded as per given by Bureau of Indian Standards and they are pH,carbonates, bicarbonates, chloride and Nitrates. Concentrations of Potassium, Sodium, Sulfate, and Phosphate were observed to be within the permissible limits. The Recommendations are suggested based on source of pollutant and drinking water standards of the parameters and the associated Land use. Algae Covers the large surface area on the water b which prevents from evaporation of water but these algae are also responsible for increasing the Alkalinity of water. Hence cannot use for various purposes, such as drinking, domestic, and recreation, etc. Field observation during sample collection reveals that the boundary wall had cracks due to alkalinity of water and other reasons too. REFERENCES [1]. APHA, AWWA, WPCF. Standard Methods for the Examination of Water and Wastewater.20th edition, American Public Health Association, Washington, DC, New York, USA, 1998. [2]. Ritchie, J.C., Schiebe, F.R and McHenry, J.R. (1976). Remote Sensing of Suspended Sediment in Surface Water.Photographic Engineering Remote Sensing, 42, 1539- 1545. [3]. Gogana Venkateswarlu1,Analytical Study On Effects Of Water Quality Parameters Us eISSN: 2319-1163 | pISSN: 2321-7308 _____________________________ 318 ,Cl, D.O , organic Matter Total Hardness, , PO4 3-, NO2-, NO3,SO4 2- The results obtained are given below: The watersamples shows variation in the pH level between one station to other stations. The average pH is 9.0375 in pre monsoon and average pH in postmonsoon is 8.872 and almost samples which were collected from field area shows Carbonates ranged from 53.75 mg/L in premonsoon and in postmonsoon is 53.68 mg/L. Bicarbonates were present in an average range of 384.68- mg/L in premonsoon and postmonsoon. Chlorides 382.375mg/L in premonsoon and postmonsoon. Dissolved oxygen was present in an average mg/L in premonsoon and postmonsoon. Organic matter ranged from 6.0925-5.4875mg/L in premonsoon and postmonsoon. Total hardness were in the mg/L with Ca and Mg 93.9- 35.45mg/L respectively in premonsoon and postmonsoon season, and nitrites of 2.89-2.67 mg/L in premonsoon and postmonsoon season. Sulphate was present 22.18-22.84mg/L in premonsoon and ostmonsoon. Electrical conductivity were ranged from 595 , and phosphates 9.1-9.9mg/L in premonsoon and postmonsoon season. chemical analysis, the obtained data conclude that waterhaving pH scale is nearly 9 and water quality is deteriorated. The results indicated that certain parameters exceeded as per given by Bureau of Indian Standards and they are pH,carbonates, bicarbonates, chloride and Nitrates. Concentrations of Potassium, Sodium, hate were observed to be within the permissible limits. The Recommendations are suggested based on source of pollutant and drinking water standards of the parameters and the associated Land use. Planktonic Algae Covers the large surface area on the water body which prevents from evaporation of water but these algae are also responsible for increasing the Alkalinity of water. Hence cannot use for various purposes, such as drinking, domestic, and recreation, etc. Field observation during eals that the boundary wall had cracks due to alkalinity of water and other reasons too. APHA, AWWA, WPCF. Standard Methods for the Examination of Water and Wastewater.20th edition, American Public Health Association, Washington, DC, Ritchie, J.C., Schiebe, F.R and McHenry, J.R. (1976). Remote Sensing of Suspended Sediment in Surface Water.Photographic Engineering Remote Sensing, 42, Gogana Venkateswarlu1,Analytical Study On Effects Of Water Quality Parameters Using Remote Sensing
- 5. IJRET: International Journal of Research in Engineering and Technology eISSN: 2319-1163 | pISSN: 2321-7308 _______________________________________________________________________________________ Volume: 05 Issue: 03 | Mar-2016, Available @ http://www.ijret.org 319 &Gis Under Hyderabad Urban Area Zone – V,IJRET:eISSN: 2319-1163 | pISSN: 2321-7308 [4]. Amin HossainiMotlagh, K. Navatha and P.ManikyaReddy,Ecological Studies of Mir Alam Lake With Reference to Water Quality,ISSN: 0972-6268 BIOGRAPHIES MohdAkramUllah Khan, Research scholar in the department of Applied Geology in Osmania University and working in Civil Department as an Assistant professor in Guru Nanak Institutions Technical Campus. DVS Narsimha Rao, MSc(Geology), M.Phil working in Civil Department as an Associate professor in Guru Nanak Institutions Technical Campus. MohdMujahid Khan, Ph.D working as an Assistant professor in Civil Department in Osmania University. P.Ranjeet, M.Tech, Working in Civil Department as an Assistant professor in Guru Nanak Institutions Technical Campus.