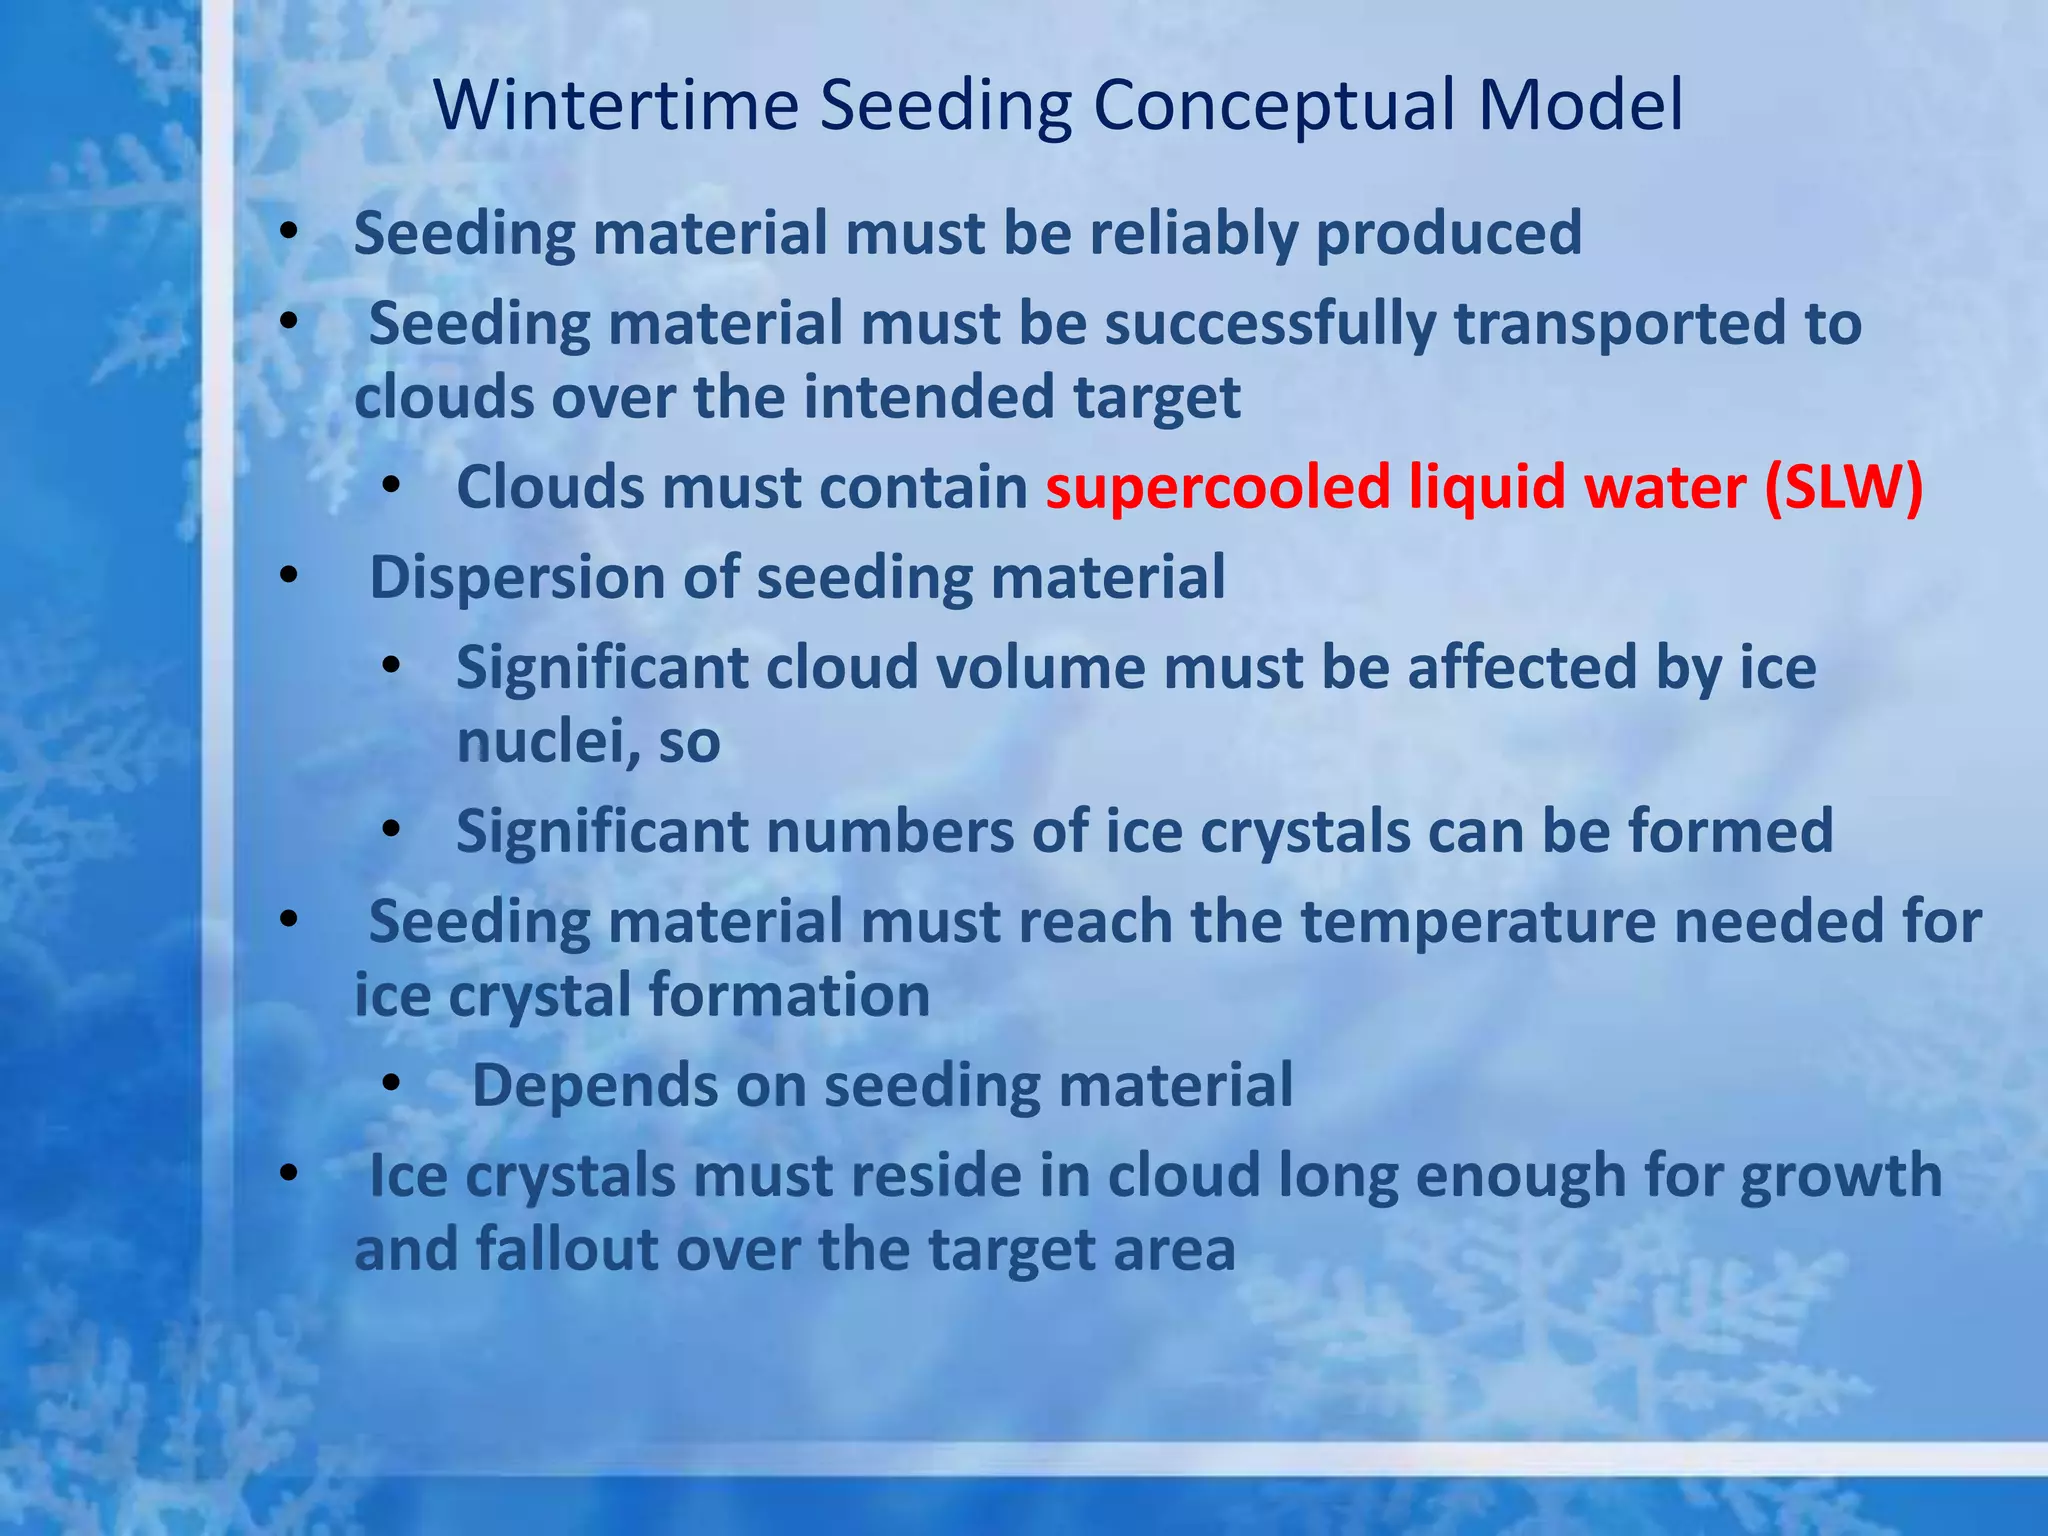
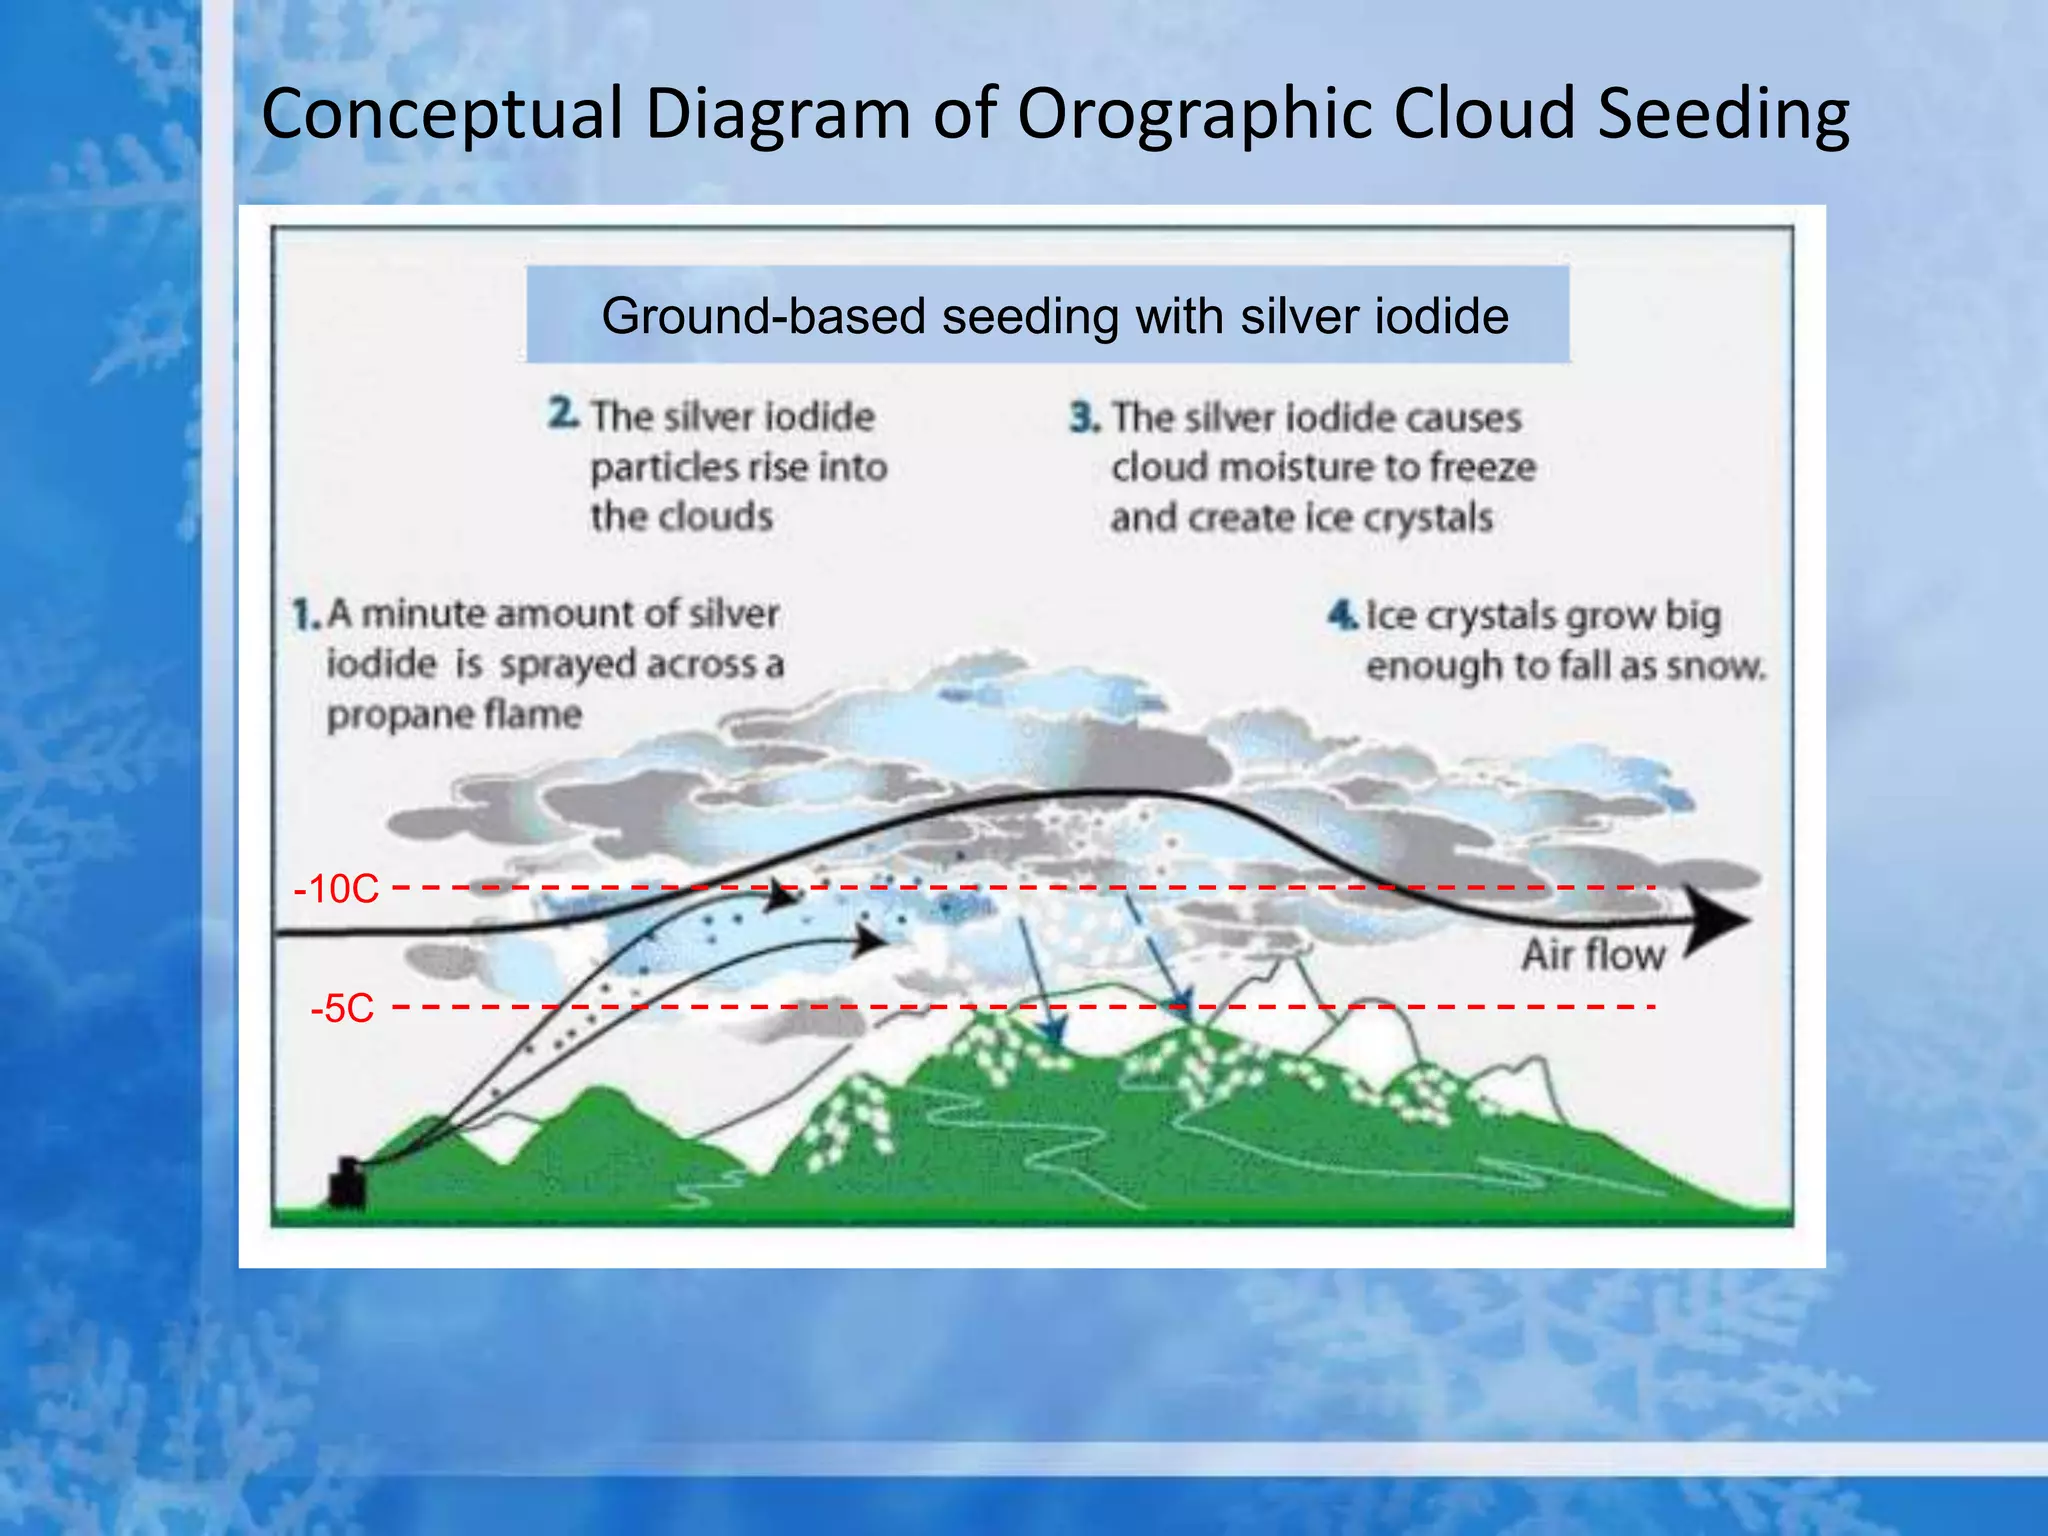
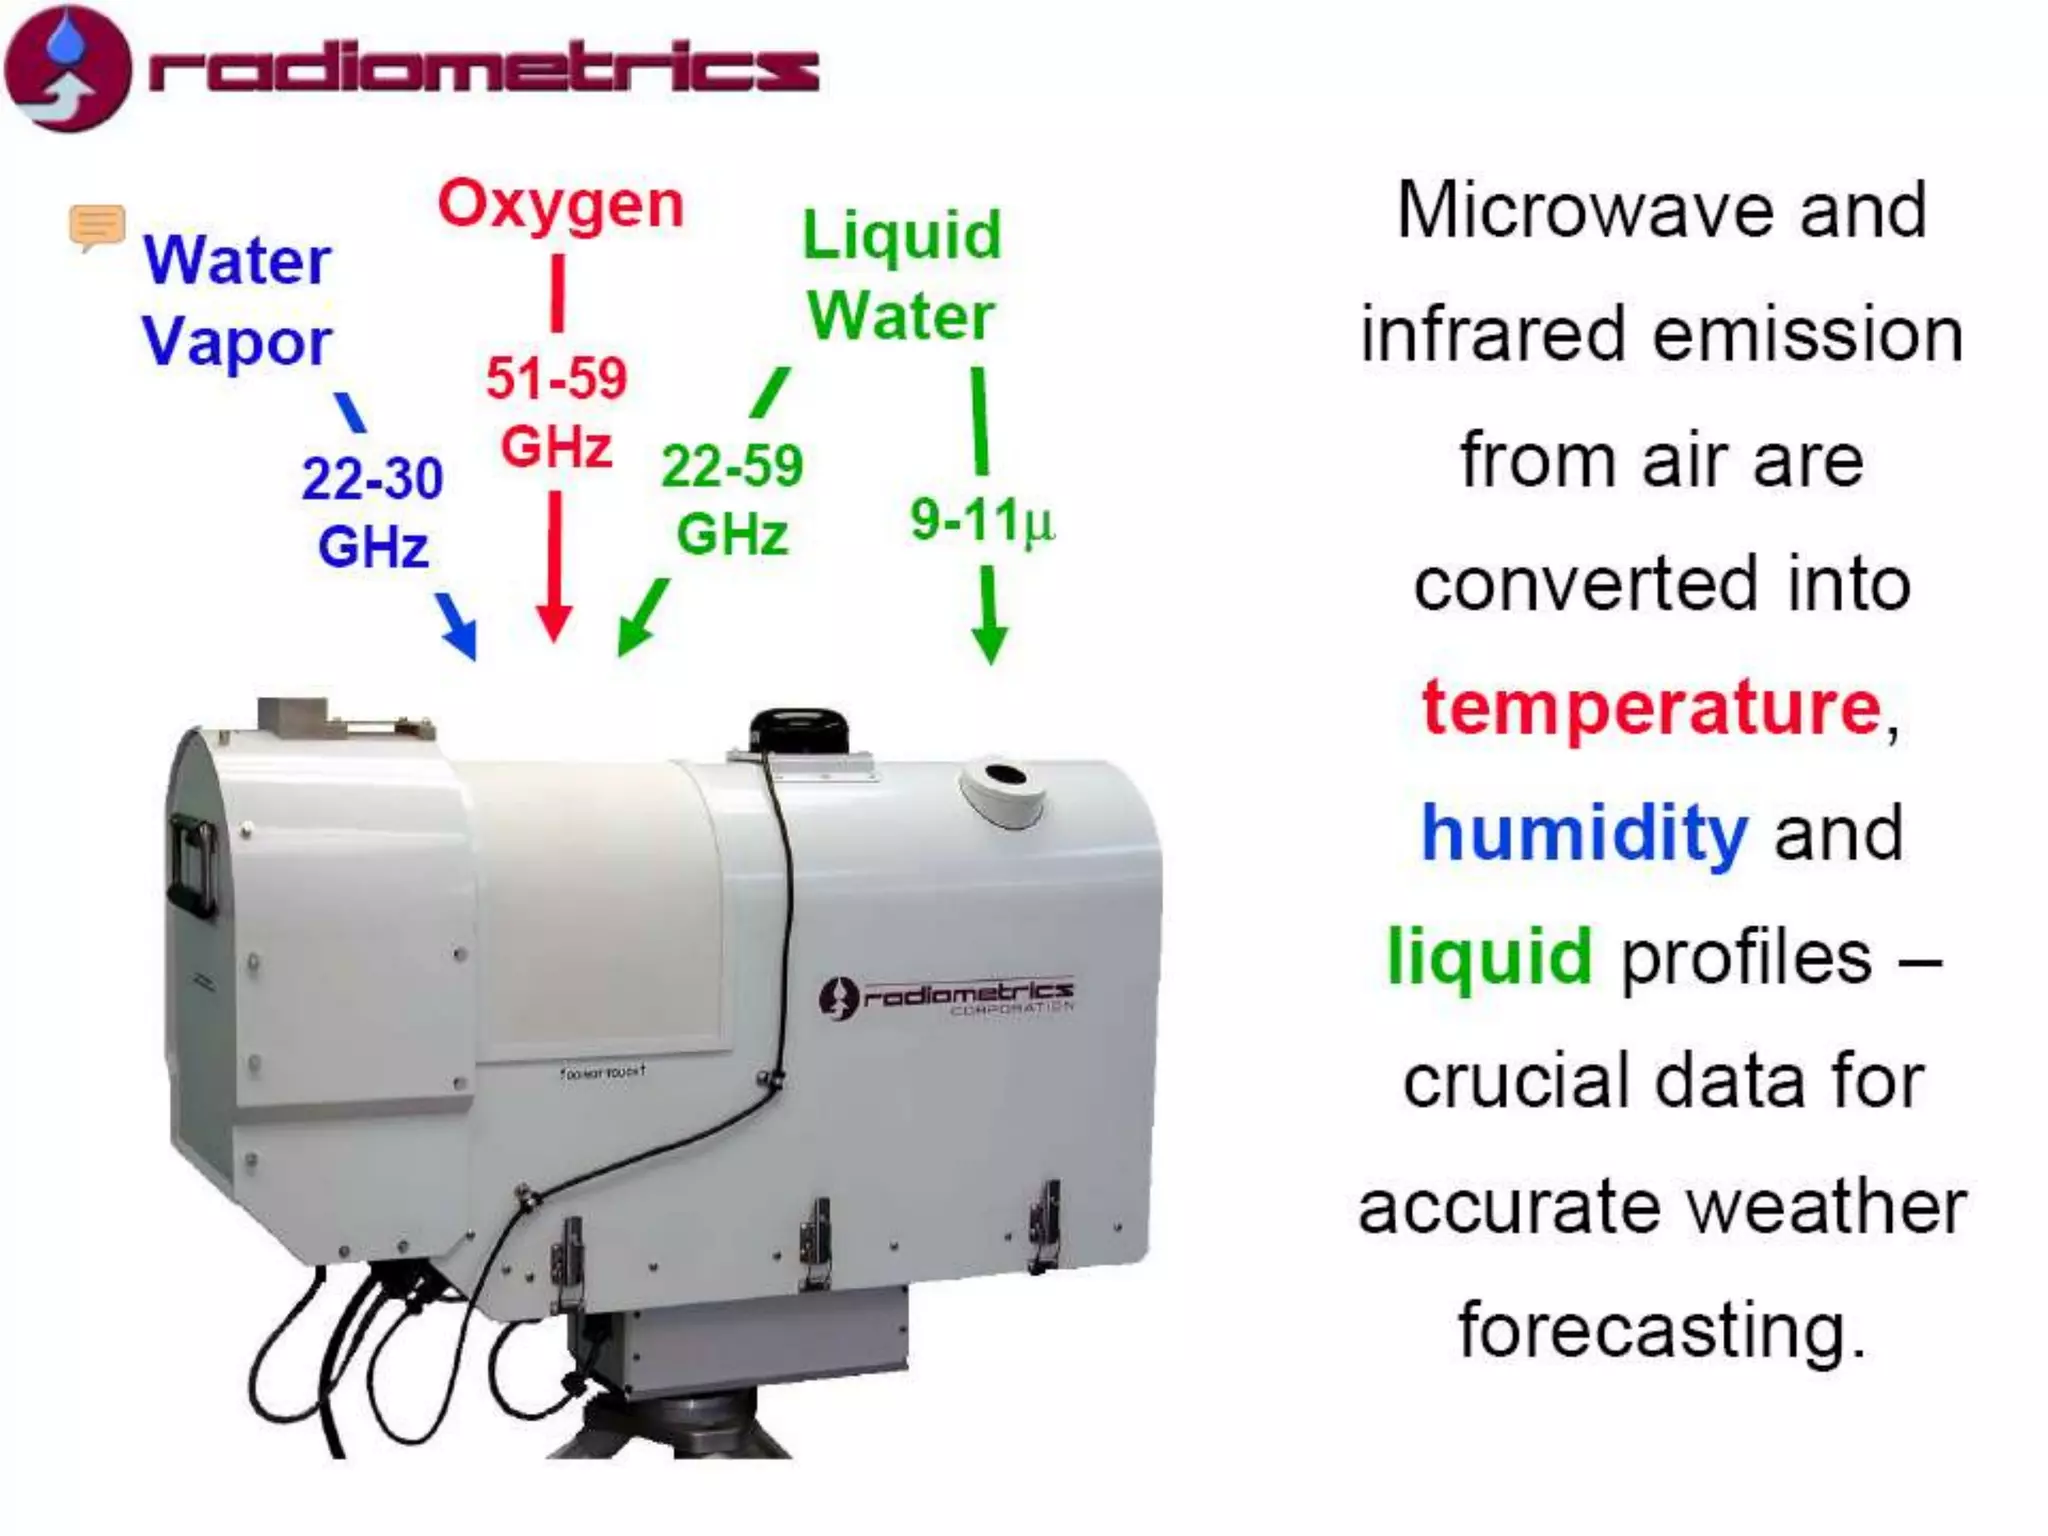
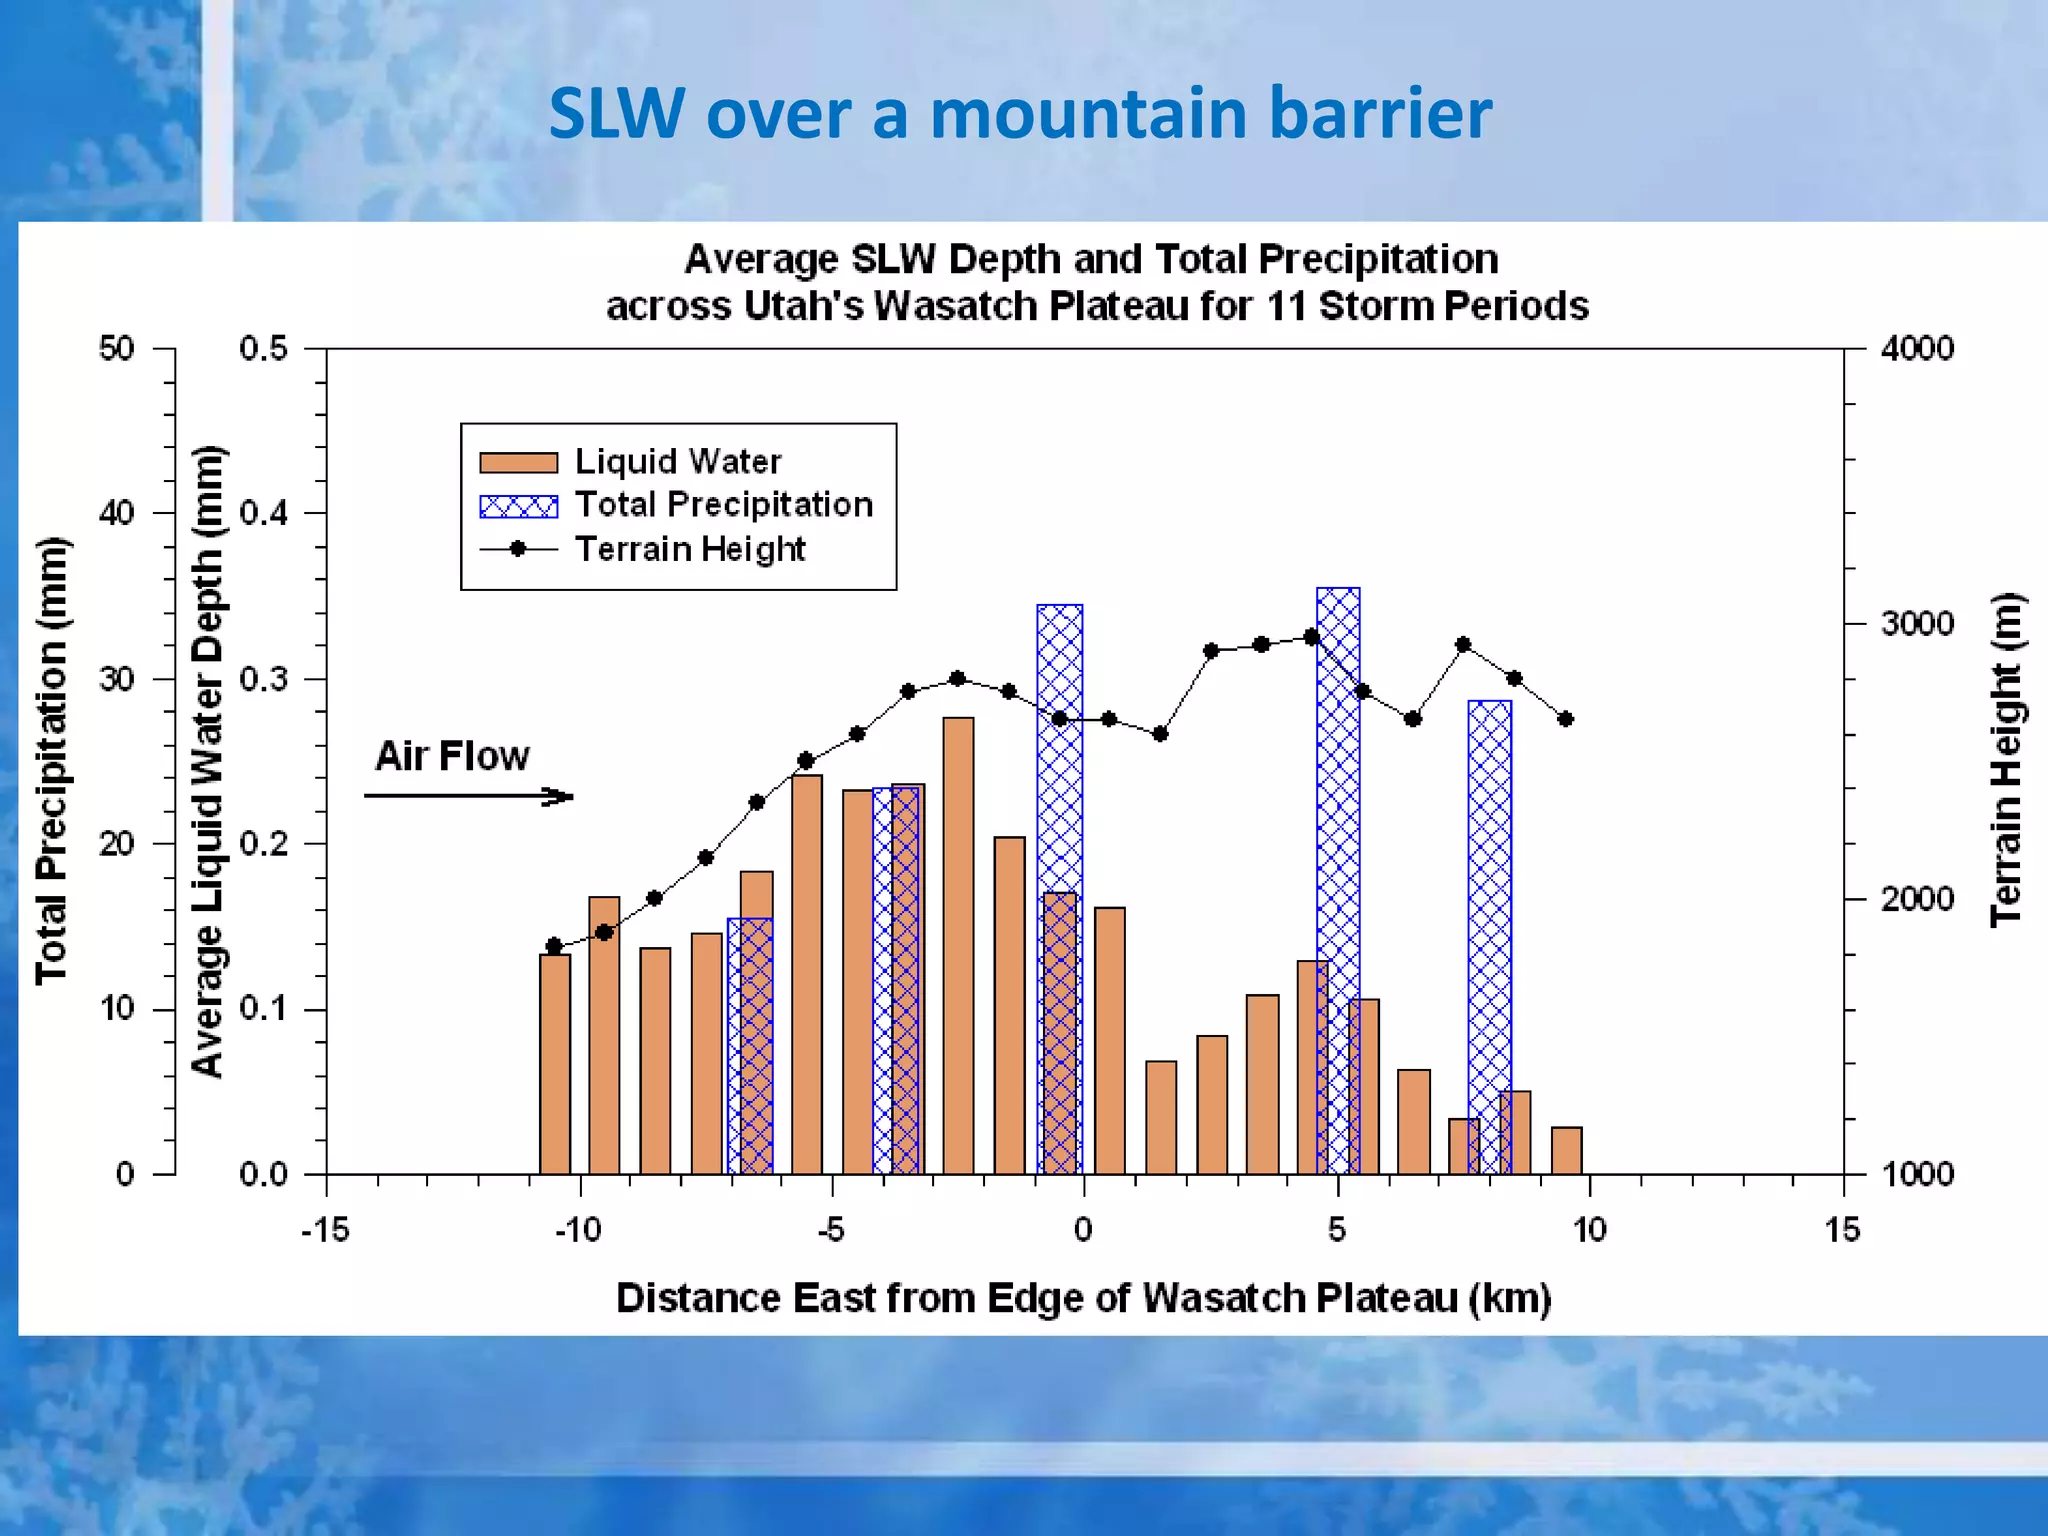
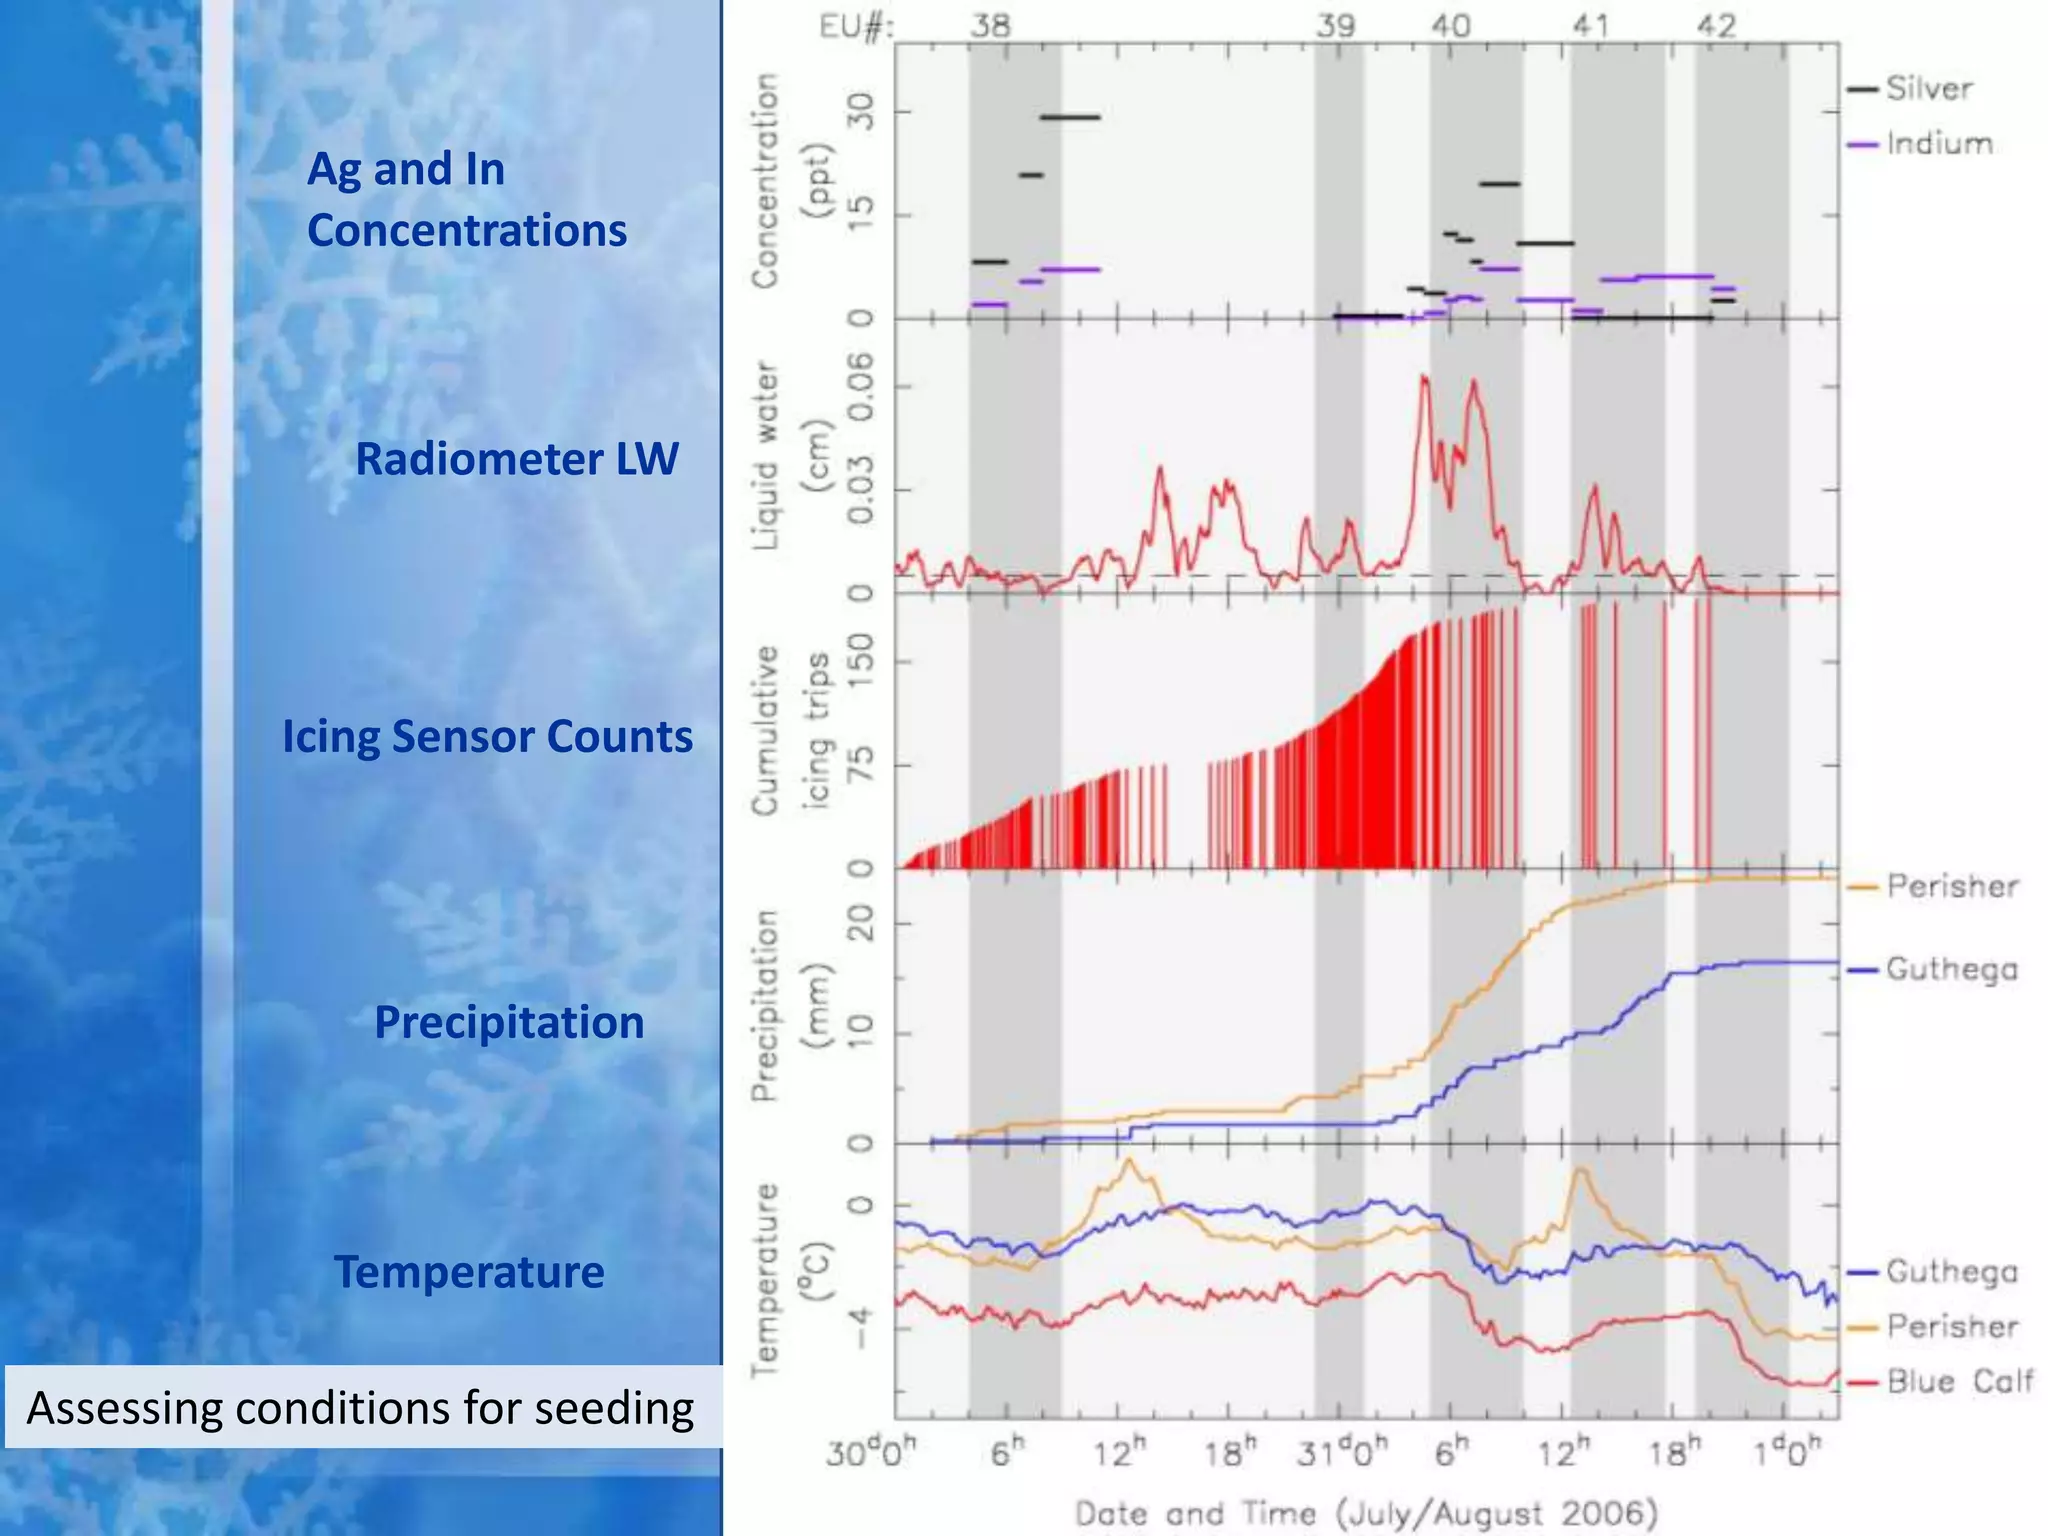
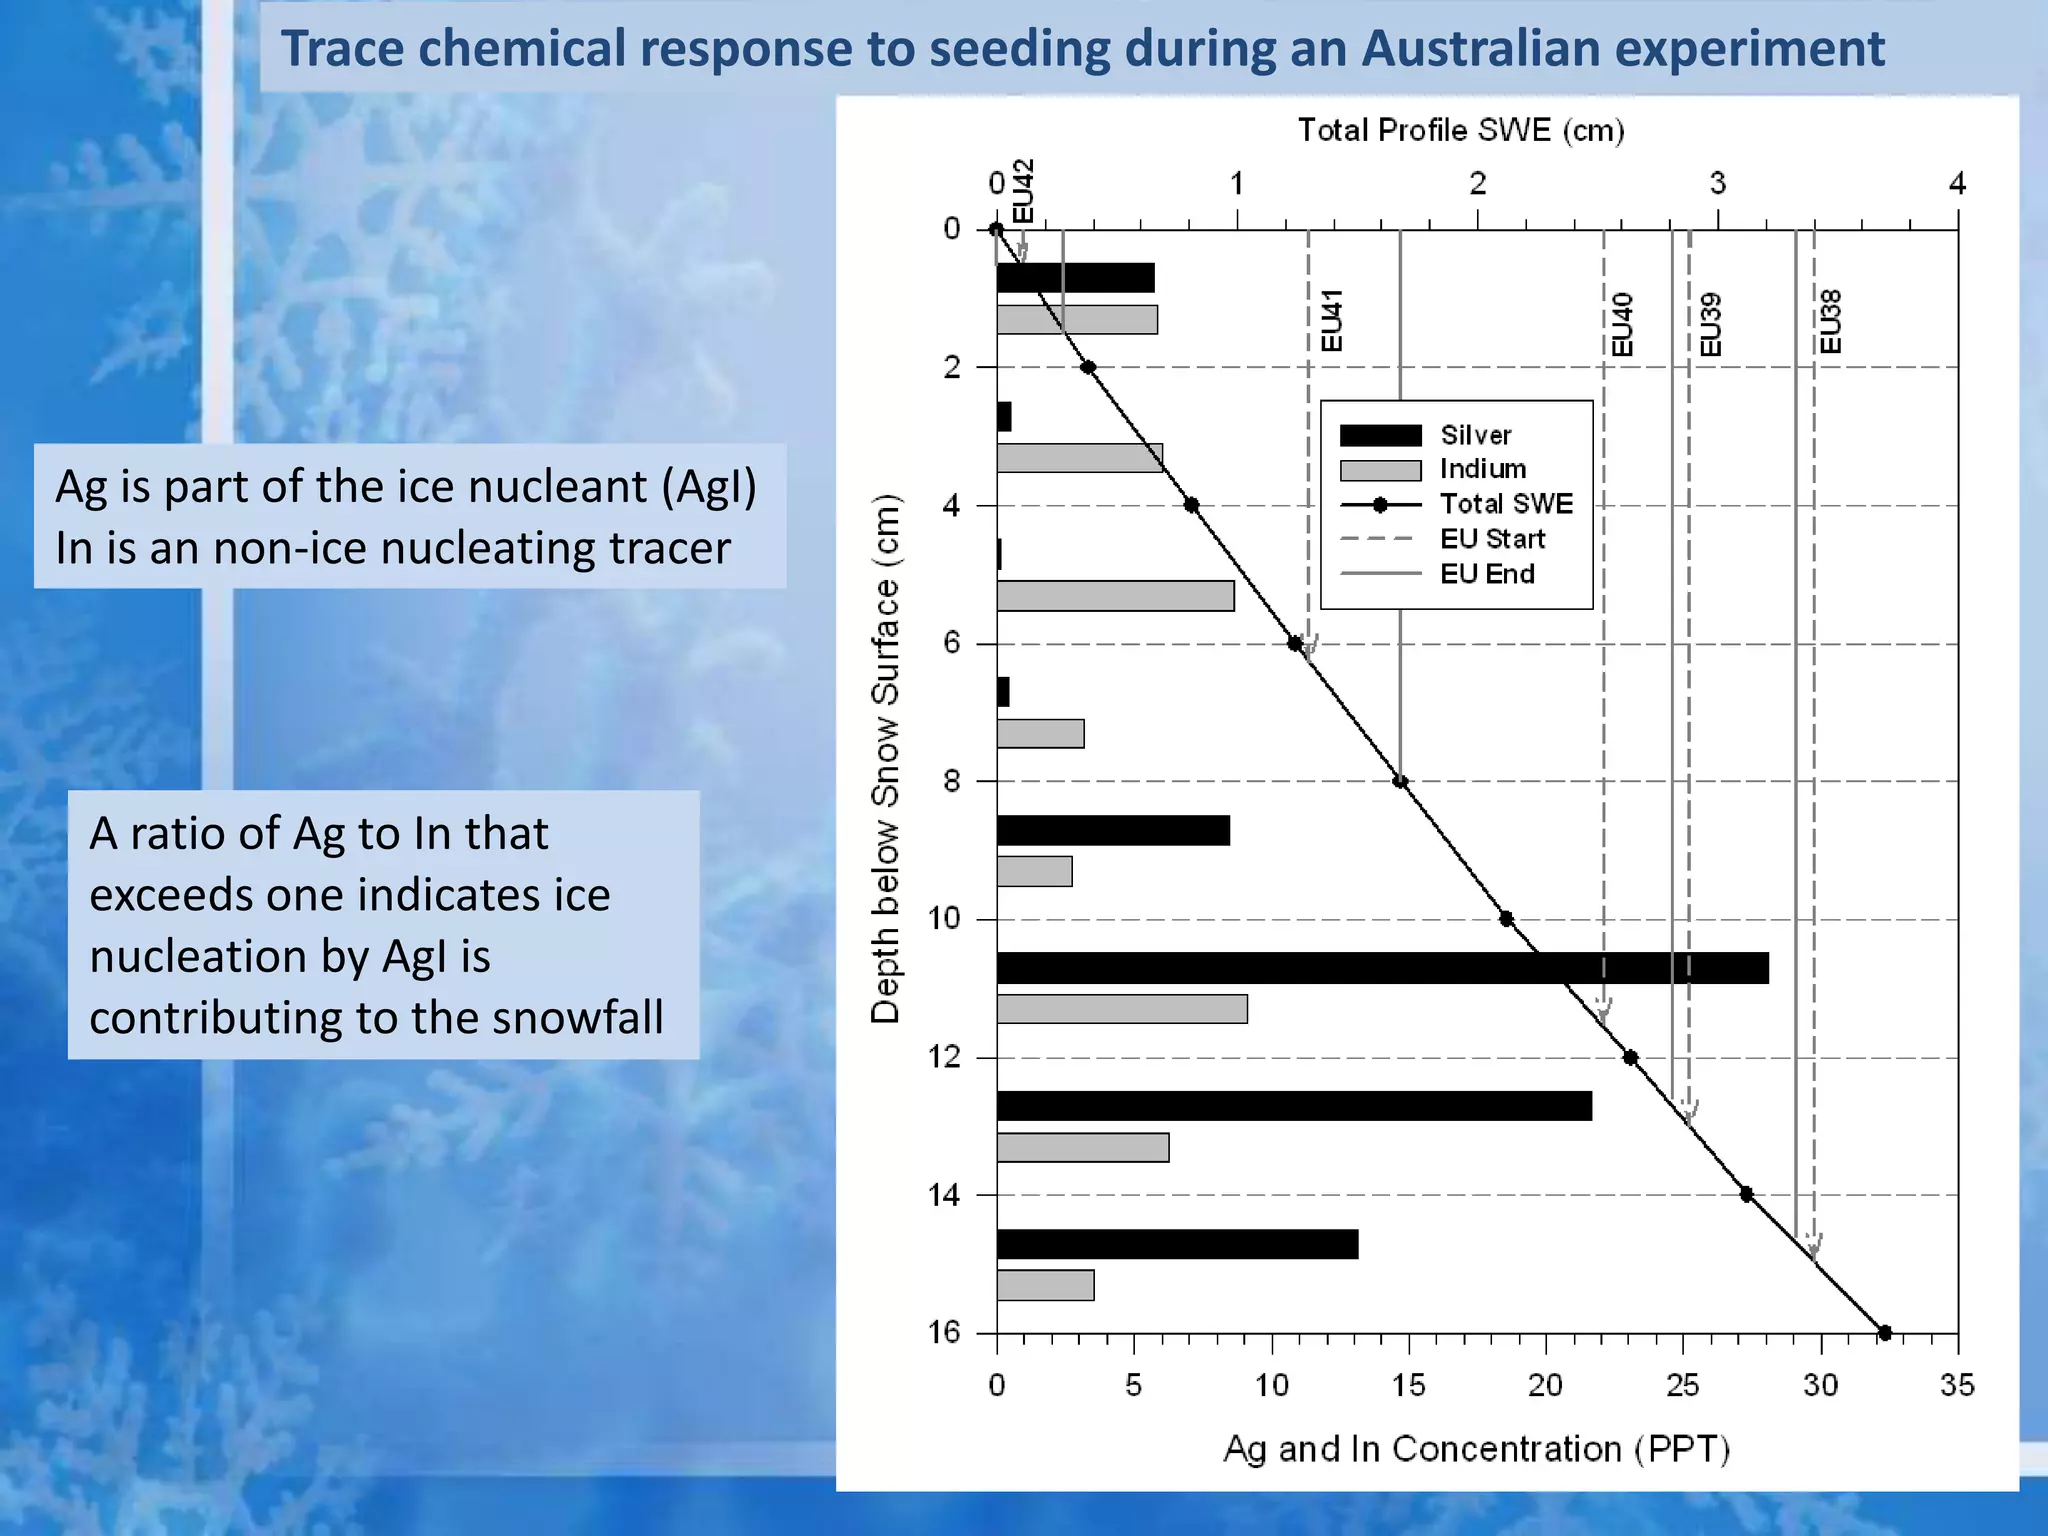
History and Scientific Basis of Cloud Seeding


Forum on Cloud Seeding in the Humboldt River
        Basin to Increase Snowpack
               Reno, Nevada
             22 October 2012


                       Arlen W. Huggins
                    Desert Research Institute
                      Reno, Nevada, USA
 Brief history of cloud seeding
 Cloud seeding conceptual model
 Validation of the conceptual model
 Past and current research
 Trace chemical evaluation techniques
 Hydrologic modeling to assess impact on
streamflow
 Environmental issues
 Summary
Wintertime Seeding Conceptual Model
• Seeding material must be reliably produced
• Seeding material must be successfully transported to
  clouds over the intended target
   • Clouds must contain supercooled liquid water (SLW)
• Dispersion of seeding material
   • Significant cloud volume must be affected by ice
      nuclei, so
   • Significant numbers of ice crystals can be formed
• Seeding material must reach the temperature needed for
  ice crystal formation
   • Depends on seeding material
• Ice crystals must reside in cloud long enough for growth
  and fallout over the target area
Conceptual Diagram of Orographic Cloud Seeding

         Ground-based seeding with silver iodide


-10C

 -5C
Past Research
• Ice nucleating properties of various substances
• Transport and dispersion of seeding material
   – Mapping plumes with aircraft or mobile ground platforms
   – Plume dispersion models
• Supercooled liquid water measurements
   – Aircraft sensors, mountain top icing sensors, microwave
     radiometers
• Seeding-induced (microphysical) changes to clouds
   –   In cloud aircraft measurements
   –   Mobile ground-based measurements
   –   Ground-based remote sensing measurements
   –   Inference from trace chemical analysis of snowfall
• Seeding-induced changes to precipitation/snowfall
   – Randomized experiments
   – Detailed case studies with high-resolution precipitation
     measurements (gauges or laser imaging probes)
Ice-forming Activity of Seeding Materials


Note with AgI
that a very small
mass is needed
to produce a very
large number of
ice nucleating
particles
Weather station
Plume of ice   controls dispenser
crystals


Seeding materials & delivery methods
Availability of supercooled liquid water
 Seeding potential relies on an excess of SLW
 Studies over many mountainous areas have shown
    SLW is present at some stage on nearly every winter storm
    SLW exhibits considerable temporal and spatial variability
    SLW is found mainly over the windward slope and can extend
   upwind
    Maximum SLW exists from below mountain crest to ~1km above
 SLW temperature
    Depends a lot on barrier height and geographic location
    Rocky Mountains: SLW base -2 to -10 C SLW top -10 to -15 C
    Sierra Nevada: SLW base often > 0 C SLW top -12 C or higher
 Seasonal SLW flux can be 50 – 100% of seasonal snowfall
    Suggests significant cloud seeding potential
SLW over a mountain barrier
Ag and In
             Concentrations


               Radiometer LW


            Icing Sensor Counts


                Precipitation


              Temperature

Assessing conditions for seeding
Transport and Dispersion of Seeding Material
 Verification of T and D is Critical
     Documented in several research studies of 1970s, 1980s and 1990s
     Key element in success of randomized Bridger Range experiment
     Consistently successful T&D from high altitude generators
         Generators positioned part way up the windward slope


 Methods of verification
     Aircraft or ground-based detection of tracer gases
     Aircraft or ground-based ice nucleus counters
     Dispersion models for feasibility assessments (with verification)
     Trace chemical analysis of snowfall from the target
T and D Examples:
  Measurements
                                    Aircraft
   from mobile                      Detection
     platforms

Wasatch Plateau
AgI seeding from
a single site

Tracer gas and
ice nuclei
measurements            Ground
                        Detection
Plume dimension
similar to results in
other areas
T and D
            Examples:
          Measurements
         from a fixed site


Seeding plume verified with
Ice nuclei measurements
(NCAR counter)


SLW also verified
(Microwave radiometer)
Measurements of
 microphysical
  effects from
    seeding:
    Use of fixed
    instrument
   sites, aircraft
 instruments, and
mobile ground-based
     platforms
DRI Particle Dispersion Model Results


Two DRI ground
Generator sites

Part of
Dual-tracer
Ice Crystal
Enhancement
Experiment
Cloud Microphysical Responses to Seeding
 Verification of the initiation, growth and fallout of ice crystals
     Strong evidence from ground-based seeding experiments in Bridger Range
    (MT), Grand Mesa (CO) and Wasatch Plateau (UT)
     Significant IC enhancement (>5x background) found in seeding plumes
     Best evidence found in cloud regions colder than -9 C with cloud tops
    warmer than -20 C.


 Method of verification
     Aircraft or ground-based particle imaging probes
     Aircraft detection required flying within 300 m of mountain peaks
     Ground-base instruments at fixed location, or mobile
Microphysical
seeding effect
  examples


 Wasatch Plateau
 AgI seeding from
 a single site

 Aircraft data show
 aerosol and ice
 crystal seeding
 plumes
 6 km or 16.7 min downwind
 of seeding site
Microphysical
seeding effect
  examples


Wasatch Plateau
AgI seeding from
a single site

Aircraft data show
aerosol and ice
crystal seeding
plumes
15 km or 41.7 min downwind
of seeding site
Microphysical seeding effect examples:
Time after
 seeding
                    An aircraft case study


 10 min


 19 min


 22 min


 30 min


 39 min
Seeding Effects in Precipitation

 Last link in the “chain” and hardest to verify
    Physical evidence from ground-based seeding experiments on the
   Grand Mesa (CO) and Wasatch Plateau (UT)
    Statistical evidence from randomized experiments in Bridger
   Range and northern Sierra Nevada – supporting physical evidence
    One randomized propane experiment in UT with significant
   results – 1-hour seeded periods had ~20% more precipitation than
   unseeded periods


 Methods of verification
    Ground-based particle imaging probes
    Precipitation gauges
    Radar occasionally useful
    Statistical assessments of target area precipitation
Radar detection of a
    seeding plume
from Wasatch Plateau
case that documented
aerosol and ice crystal
       plumes
Precipitation from
 gauges inside and
  outside seeding
       plume

Vertical dashed lines
  enclose the time
    period of the
  seeding effect at
   each gauge site
Some of the Best Evidence
               of Precipitation Increases
 Physical evidence from case studies
    Wasatch Plateau (UT) experiments (1990s, 2004)
       Ground releases of silver iodide and liquid propane
       Precipitation rate increases of a few hundredths to > 1
      mm/hour
    Grand Mesa (CO) 1990s
       Ground and aircraft releases of silver iodide
       Precipitation rates in seeded periods >> than unseeded periods
 Statistical results with supporting physical evidence
    Bridger Range randomized experiment (1970s)
       Double ratio analysis showed 15% increase in the target
       Increases in target were much greater in cold storms
       Increases of 15% found within a few km of the source
    Lake Almanor randomized experiment (1960s)
       Statistically significant increase found with cold storm category
       Supported by later trace chemical evaluations
Current Research Projects
• Australian Snowy Mountain Project
  – Funded by Australian government and
    conducted by Snowy Hydro (power company)
  – 5-year study with randomized seeding of a
    single target
  – Published results showed a statistically
    significant 14% increase in target precipitation
    for “seeded” events
  – Statistical results strongly supported by trace
    chemical assessment
• U. of Wyoming airborne radar study
  – Radar signal increase noted during seeding
    periods
  – Radar signal increase corresponds to a
    significant precipitation rate increase
Hydrologic Modeling
     to Assess the Impact
     of Cloud Seeding


 HRU Setup for Walker
          River
  HRUs outlined in red
were given a 10% seeding
         impact
Seeded          Year        Month        Precip         ET        Storage P-Runoff
                                                         (inches) (inches) (inches) (inches)
 Hydrologic                         2003
                                    2003
                                                    10
                                                    11
                                                             1.029
                                                             2.451
                                                                          0.447
                                                                          0.459
                                                                                       1.421
                                                                                       3.128
                                                                                                    0.470
                                                                                                    0.285
 Modeling:                          2003
                                    2004
                                                    12
                                                     1
                                                             9.512
                                                             1.626
                                                                          0.342
                                                                          0.396
                                                                                     11.397
                                                                                     12.047
                                                                                                    0.900
                                                                                                    0.580
Simulation of                       2004             2      11.132        0.386      22.432         0.361
                                    2004             3       4.048        1.009      23.910         1.561
  Seeding                           2004             4       1.732        2.427      18.362         4.853
                                    2004             5       0.000        2.765      11.537         4.060
  Effects*                    *************************************************************************
                              Total                         31.530        8.231      11.537       13.070

                 Not seeded      Year        Month        Precip         ET        Storage P-Runoff
*Estimated at                                            (inches) (inches) (inches) (inches)
10% for                             2003            10       0.932        0.397        1.262        0.402
selected HRU’s                      2003            11       2.274        0.463        2.829        0.244
                                    2003            12        8.64        0.348      10.353         0.768
                                    2004             1       1.471        0.401      10.896         0.526
                                    2004             2      10.124        0.388      20.293         0.339
                                    2004             3       3.653         1.02      21.381         1.545
                                    2004             4       1.558        2.386      16.073         4.481
                                    2004             5            0       2.672        9.835        3.566
                              *************************************************************************
                              Total                         28.652        8.075        9.835      11.871
                              Difference                     2.878        0.156        1.702        1.199
                              % Difference                    10.0           1.9        17.3         10.1
Use of trace chemistry in evaluating cloud seeding
                     projects
  The element silver in silver iodide has a very low background
   concentration in natural snowfall (~4 PPT).
  Analyzing target area precipitation for evidence of Ag above
   background is one means of evaluating targeting
   effectiveness.
  In a randomized seeding project using a target and control
   design trace chemistry can be used to verify that the control
   area is unaffected by seeding.
  Can be used to address environmental concerns regarding Ag
   in snow, soil, water supplies, etc.
  Non-ice nucleating particles used in combination with AgI can
   be used to differentiate between nucleation and scavenging
   processes in target area snowfall.
Trace chemical response to seeding during an Australian experiment


Ag is part of the ice nucleant (AgI)
In is an non-ice nucleating tracer


 A ratio of Ag to In that
 exceeds one indicates ice
 nucleation by AgI is
 contributing to the snowfall
Summary Points on Wintertime Cloud Seeding
                  Research

 All the links in the chain of the conceptual model have been
  verified in physical case studies
 Ice crystal and precipitation enhancement have been
  verified through physical observations
 Precipitation enhancement has been documented by
  statistical methods in several projects where results were
  also validated by physical measurements
 New modeling (atmospheric and hydrologic) and radar
  methods being used to evaluate cloud seeding projects
 Trace chemical techniques used to validate targeting and
  the process of ice nucleation by seeding

DRI Cloud Seeding Forum - Science and Program History

  • 1.
    History and ScientificBasis of Cloud Seeding Forum on Cloud Seeding in the Humboldt River Basin to Increase Snowpack Reno, Nevada 22 October 2012 Arlen W. Huggins Desert Research Institute Reno, Nevada, USA
  • 2.
     Brief historyof cloud seeding  Cloud seeding conceptual model  Validation of the conceptual model  Past and current research  Trace chemical evaluation techniques  Hydrologic modeling to assess impact on streamflow  Environmental issues  Summary
  • 3.
    Wintertime Seeding ConceptualModel • Seeding material must be reliably produced • Seeding material must be successfully transported to clouds over the intended target • Clouds must contain supercooled liquid water (SLW) • Dispersion of seeding material • Significant cloud volume must be affected by ice nuclei, so • Significant numbers of ice crystals can be formed • Seeding material must reach the temperature needed for ice crystal formation • Depends on seeding material • Ice crystals must reside in cloud long enough for growth and fallout over the target area
  • 4.
    Conceptual Diagram ofOrographic Cloud Seeding Ground-based seeding with silver iodide -10C -5C
  • 5.
    Past Research • Icenucleating properties of various substances • Transport and dispersion of seeding material – Mapping plumes with aircraft or mobile ground platforms – Plume dispersion models • Supercooled liquid water measurements – Aircraft sensors, mountain top icing sensors, microwave radiometers • Seeding-induced (microphysical) changes to clouds – In cloud aircraft measurements – Mobile ground-based measurements – Ground-based remote sensing measurements – Inference from trace chemical analysis of snowfall • Seeding-induced changes to precipitation/snowfall – Randomized experiments – Detailed case studies with high-resolution precipitation measurements (gauges or laser imaging probes)
  • 6.
    Ice-forming Activity ofSeeding Materials Note with AgI that a very small mass is needed to produce a very large number of ice nucleating particles
  • 7.
    Weather station Plume ofice controls dispenser crystals Seeding materials & delivery methods
  • 8.
    Availability of supercooledliquid water  Seeding potential relies on an excess of SLW  Studies over many mountainous areas have shown  SLW is present at some stage on nearly every winter storm  SLW exhibits considerable temporal and spatial variability  SLW is found mainly over the windward slope and can extend upwind  Maximum SLW exists from below mountain crest to ~1km above  SLW temperature  Depends a lot on barrier height and geographic location  Rocky Mountains: SLW base -2 to -10 C SLW top -10 to -15 C  Sierra Nevada: SLW base often > 0 C SLW top -12 C or higher  Seasonal SLW flux can be 50 – 100% of seasonal snowfall  Suggests significant cloud seeding potential
  • 10.
    SLW over amountain barrier
  • 11.
    Ag and In Concentrations Radiometer LW Icing Sensor Counts Precipitation Temperature Assessing conditions for seeding
  • 12.
    Transport and Dispersionof Seeding Material  Verification of T and D is Critical  Documented in several research studies of 1970s, 1980s and 1990s  Key element in success of randomized Bridger Range experiment  Consistently successful T&D from high altitude generators  Generators positioned part way up the windward slope  Methods of verification  Aircraft or ground-based detection of tracer gases  Aircraft or ground-based ice nucleus counters  Dispersion models for feasibility assessments (with verification)  Trace chemical analysis of snowfall from the target
  • 13.
    T and DExamples: Measurements Aircraft from mobile Detection platforms Wasatch Plateau AgI seeding from a single site Tracer gas and ice nuclei measurements Ground Detection Plume dimension similar to results in other areas
  • 14.
    T and D Examples: Measurements from a fixed site Seeding plume verified with Ice nuclei measurements (NCAR counter) SLW also verified (Microwave radiometer)
  • 15.
    Measurements of microphysical effects from seeding: Use of fixed instrument sites, aircraft instruments, and mobile ground-based platforms
  • 16.
    DRI Particle DispersionModel Results Two DRI ground Generator sites Part of Dual-tracer Ice Crystal Enhancement Experiment
  • 17.
    Cloud Microphysical Responsesto Seeding  Verification of the initiation, growth and fallout of ice crystals  Strong evidence from ground-based seeding experiments in Bridger Range (MT), Grand Mesa (CO) and Wasatch Plateau (UT)  Significant IC enhancement (>5x background) found in seeding plumes  Best evidence found in cloud regions colder than -9 C with cloud tops warmer than -20 C.  Method of verification  Aircraft or ground-based particle imaging probes  Aircraft detection required flying within 300 m of mountain peaks  Ground-base instruments at fixed location, or mobile
  • 18.
    Microphysical seeding effect examples Wasatch Plateau AgI seeding from a single site Aircraft data show aerosol and ice crystal seeding plumes 6 km or 16.7 min downwind of seeding site
  • 19.
    Microphysical seeding effect examples Wasatch Plateau AgI seeding from a single site Aircraft data show aerosol and ice crystal seeding plumes 15 km or 41.7 min downwind of seeding site
  • 20.
    Microphysical seeding effectexamples: Time after seeding An aircraft case study 10 min 19 min 22 min 30 min 39 min
  • 21.
    Seeding Effects inPrecipitation  Last link in the “chain” and hardest to verify  Physical evidence from ground-based seeding experiments on the Grand Mesa (CO) and Wasatch Plateau (UT)  Statistical evidence from randomized experiments in Bridger Range and northern Sierra Nevada – supporting physical evidence  One randomized propane experiment in UT with significant results – 1-hour seeded periods had ~20% more precipitation than unseeded periods  Methods of verification  Ground-based particle imaging probes  Precipitation gauges  Radar occasionally useful  Statistical assessments of target area precipitation
  • 22.
    Radar detection ofa seeding plume from Wasatch Plateau case that documented aerosol and ice crystal plumes
  • 23.
    Precipitation from gaugesinside and outside seeding plume Vertical dashed lines enclose the time period of the seeding effect at each gauge site
  • 24.
    Some of theBest Evidence of Precipitation Increases  Physical evidence from case studies  Wasatch Plateau (UT) experiments (1990s, 2004)  Ground releases of silver iodide and liquid propane  Precipitation rate increases of a few hundredths to > 1 mm/hour  Grand Mesa (CO) 1990s  Ground and aircraft releases of silver iodide  Precipitation rates in seeded periods >> than unseeded periods  Statistical results with supporting physical evidence  Bridger Range randomized experiment (1970s)  Double ratio analysis showed 15% increase in the target  Increases in target were much greater in cold storms  Increases of 15% found within a few km of the source  Lake Almanor randomized experiment (1960s)  Statistically significant increase found with cold storm category  Supported by later trace chemical evaluations
  • 25.
    Current Research Projects •Australian Snowy Mountain Project – Funded by Australian government and conducted by Snowy Hydro (power company) – 5-year study with randomized seeding of a single target – Published results showed a statistically significant 14% increase in target precipitation for “seeded” events – Statistical results strongly supported by trace chemical assessment • U. of Wyoming airborne radar study – Radar signal increase noted during seeding periods – Radar signal increase corresponds to a significant precipitation rate increase
  • 26.
    Hydrologic Modeling to Assess the Impact of Cloud Seeding HRU Setup for Walker River HRUs outlined in red were given a 10% seeding impact
  • 27.
    Seeded Year Month Precip ET Storage P-Runoff (inches) (inches) (inches) (inches) Hydrologic 2003 2003 10 11 1.029 2.451 0.447 0.459 1.421 3.128 0.470 0.285 Modeling: 2003 2004 12 1 9.512 1.626 0.342 0.396 11.397 12.047 0.900 0.580 Simulation of 2004 2 11.132 0.386 22.432 0.361 2004 3 4.048 1.009 23.910 1.561 Seeding 2004 4 1.732 2.427 18.362 4.853 2004 5 0.000 2.765 11.537 4.060 Effects* ************************************************************************* Total 31.530 8.231 11.537 13.070 Not seeded Year Month Precip ET Storage P-Runoff *Estimated at (inches) (inches) (inches) (inches) 10% for 2003 10 0.932 0.397 1.262 0.402 selected HRU’s 2003 11 2.274 0.463 2.829 0.244 2003 12 8.64 0.348 10.353 0.768 2004 1 1.471 0.401 10.896 0.526 2004 2 10.124 0.388 20.293 0.339 2004 3 3.653 1.02 21.381 1.545 2004 4 1.558 2.386 16.073 4.481 2004 5 0 2.672 9.835 3.566 ************************************************************************* Total 28.652 8.075 9.835 11.871 Difference 2.878 0.156 1.702 1.199 % Difference 10.0 1.9 17.3 10.1
  • 28.
    Use of tracechemistry in evaluating cloud seeding projects  The element silver in silver iodide has a very low background concentration in natural snowfall (~4 PPT).  Analyzing target area precipitation for evidence of Ag above background is one means of evaluating targeting effectiveness.  In a randomized seeding project using a target and control design trace chemistry can be used to verify that the control area is unaffected by seeding.  Can be used to address environmental concerns regarding Ag in snow, soil, water supplies, etc.  Non-ice nucleating particles used in combination with AgI can be used to differentiate between nucleation and scavenging processes in target area snowfall.
  • 29.
    Trace chemical responseto seeding during an Australian experiment Ag is part of the ice nucleant (AgI) In is an non-ice nucleating tracer A ratio of Ag to In that exceeds one indicates ice nucleation by AgI is contributing to the snowfall
  • 30.
    Summary Points onWintertime Cloud Seeding Research  All the links in the chain of the conceptual model have been verified in physical case studies  Ice crystal and precipitation enhancement have been verified through physical observations  Precipitation enhancement has been documented by statistical methods in several projects where results were also validated by physical measurements  New modeling (atmospheric and hydrologic) and radar methods being used to evaluate cloud seeding projects  Trace chemical techniques used to validate targeting and the process of ice nucleation by seeding