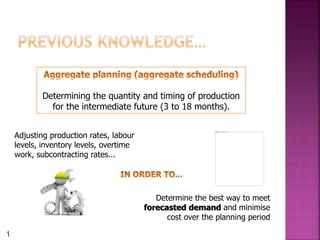
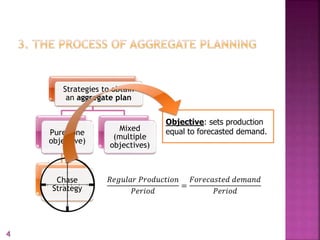
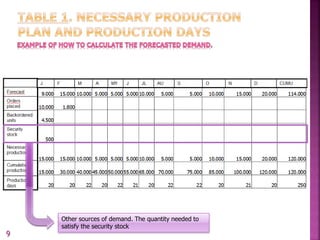
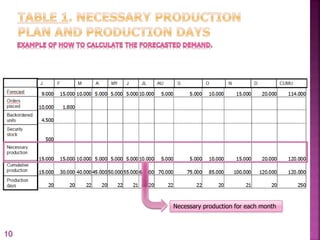
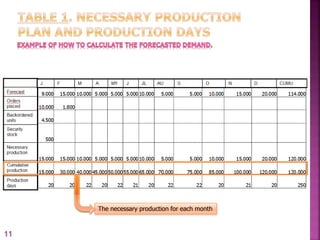
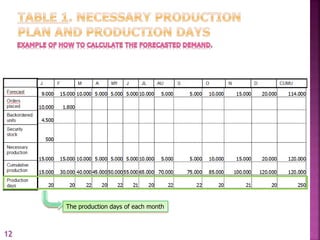
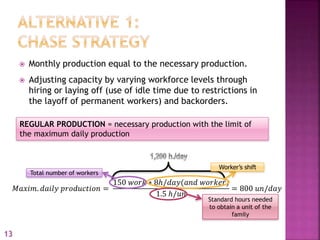
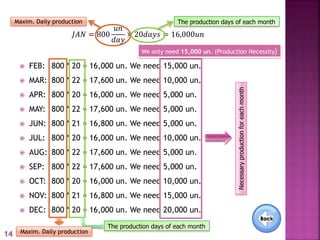
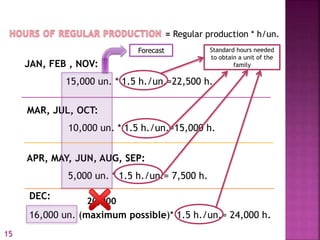
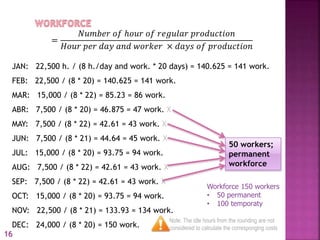
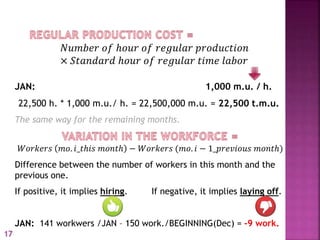
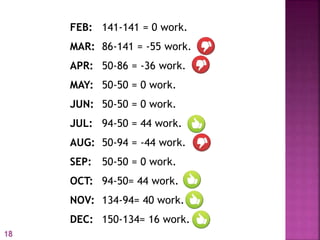
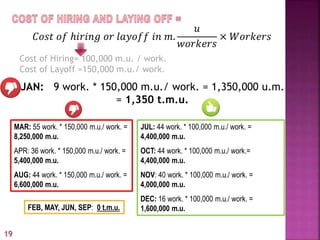
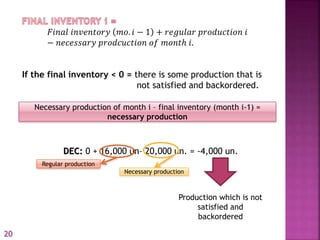
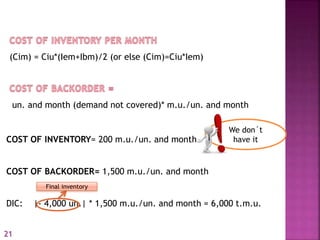
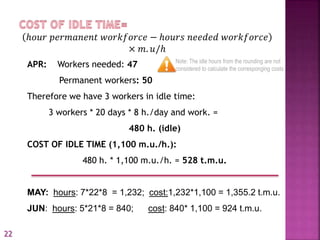
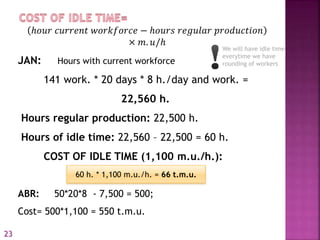
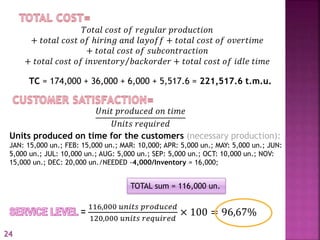
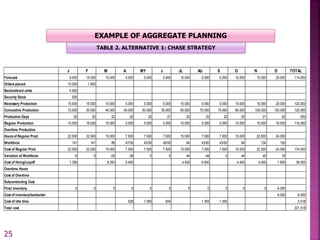
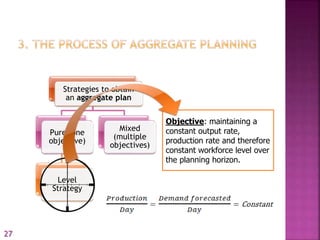
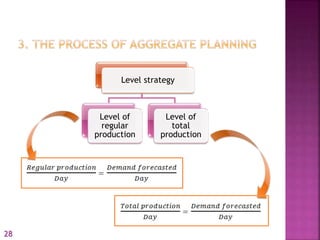
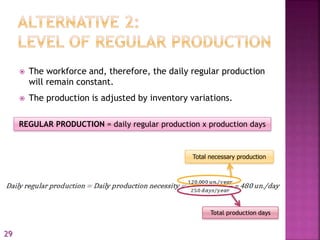
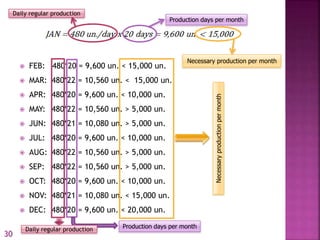
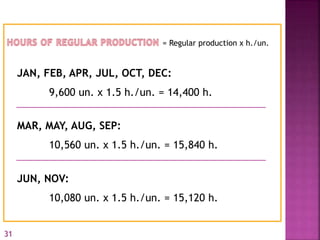
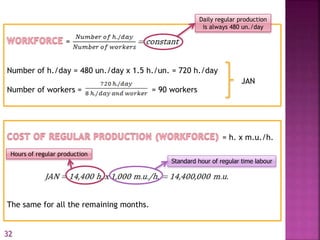
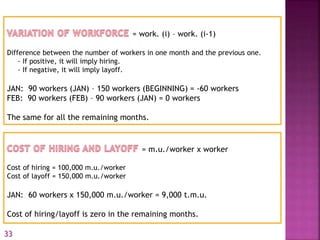
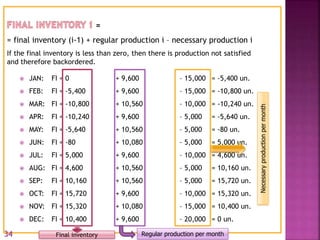
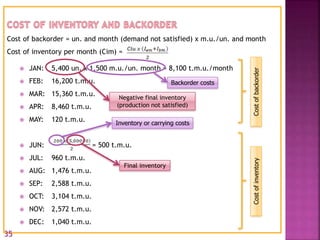
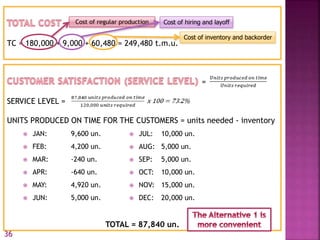
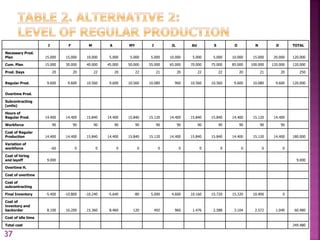
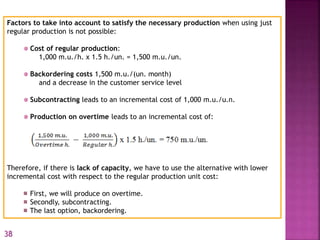
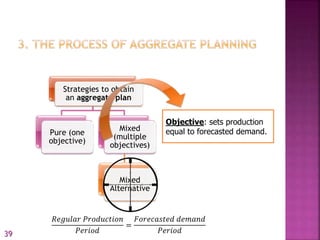
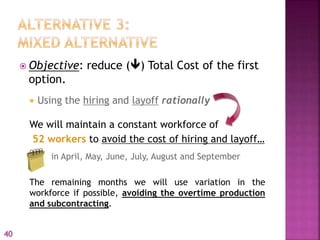
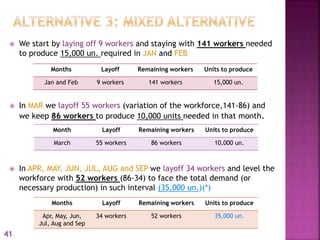
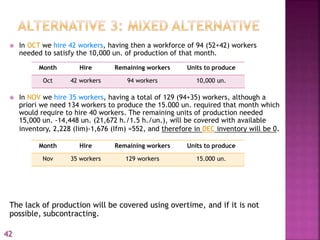
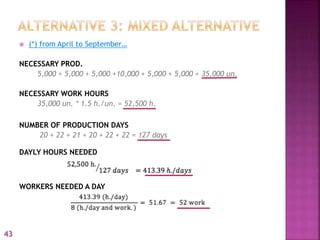
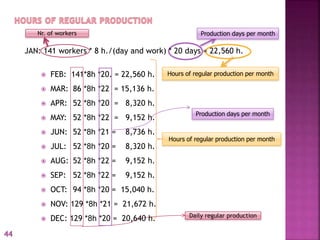
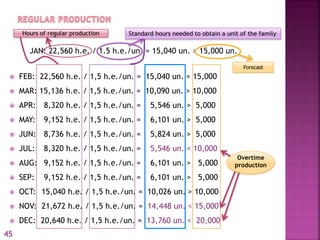
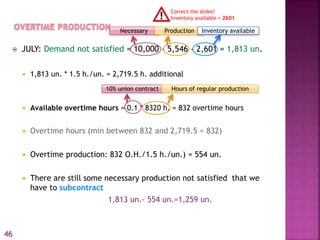
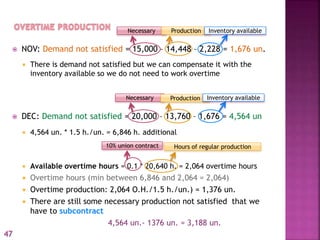
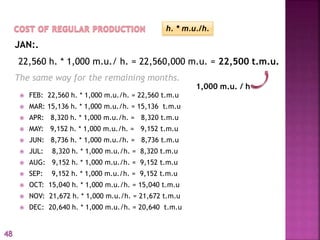
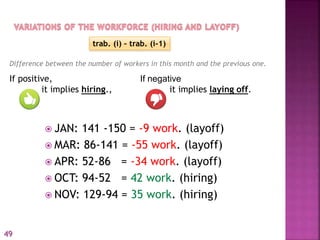
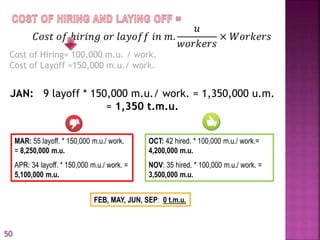
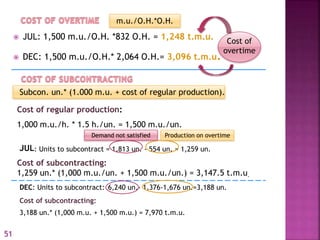
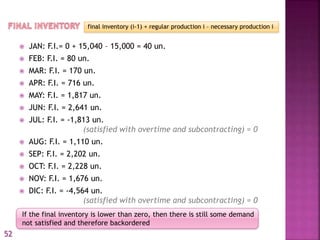
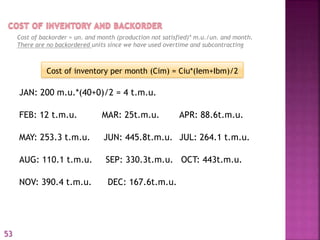
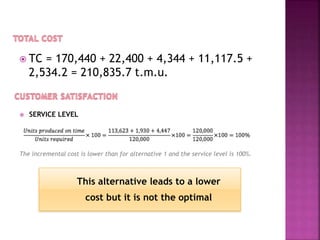
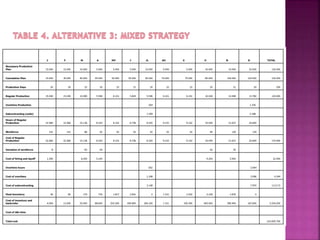
Ana Gómiz Aragón
Laura Rodríguez-León Rodríguez
Manuela Valera Ortega
Group 12
Determining the quantity and timing of production
for the intermediate future (3 to 18 months).
Adjusting production rates, labour
levels, inventory levels, overtime
work, subcontracting rates...
Determine the best way to meet
forecasted demand and minimise
cost over the planning period
1
1. Introduction to Aggregate Planning
2. Aggregate Planning strategies
3. The process of Aggregate Planning
4. Methods for Aggregate Planning
5. Aggregate Planning in services
2
Strategies to obtain an aggregate plan
Pure
Mixed
Pure strategies
Chase
strategy
Level
strategy
Level strategy
Level of regular
production
Level of total
production
3
Strategies to obtain
an aggregate plan
Pure (one
objective)
Chase
Strategy
Mixed
(multiple
objectives)
Objective: sets production
equal to forecasted demand.
𝑅𝑒𝑔𝑢𝑙𝑎𝑟 𝑃𝑟𝑜𝑑𝑢𝑐𝑡𝑖𝑜𝑛
𝑃𝑒𝑟𝑖𝑜𝑑
=
𝐹𝑜𝑟𝑒𝑐𝑎𝑠𝑡𝑒𝑑 𝑑𝑒𝑚𝑎𝑛𝑑
𝑃𝑒𝑟𝑖𝑜𝑑
4
 Assume you are the operations manager of a firm that carries a
single family of products. To obtain a unit of the family we need
1.5 hours (standard hours) of workforce and each worker’s shift is
8 h. a day. At this moment, December, the workforce of the firm is
150 workers (50 permanent and 100 temporary) and, although
the security stock desired is 500 units, the available stock is zero.
 1.5 hours per unit (standards h)
 Worker’s shift 8h a day per
 Workforce 150 workers
 50 permanent
 100 temporary
 Security stock desired 500 units
 Available stock 0
EXAMPLE OF AGGREGATE PLANNING
5
Cost information:
• Materials per unit of product: 5,000 m.u.
• Standard hour of regular time labor: 1,000 m.u.
• Standard hour of overtime labor: 1,500 m.u.
• Standard hour of idle time: 1,100 m.u.
• Hiring: 100,000 m.u./worker
• Layoff of a temporary worker: 150,000 m.u.
• Subcontracting cost per unit: 1,000 m.u., over the regular production cost of one unit.
• Inventory or carrying cost: 200 m.u./unit and month. Cim = Ciu (Iem + Ibm)/2
• Back order cost: 1,500 m.u./ unit and month.
Other factors that need to be considered to develop an aggregate planning,
are the company policies:
• There are three shifts and the maximum number of workers that can work
simultaneously is 50. Therefore, there is a maximum of 1,200 h/day (150 workers x 8
h/day and worker).
• The maximum number of overtime hours allowed is 10% of the hours available in
regular time.
• Permanent workers cannot be laid off.
• All the costs are linear functions.
• The daily demand, within each month, is uniform and continuous.
6
Demand forecast for next year, obtained with the
information provided by the marketing department
7
Additional information obtained from client portfolios The demand
forecast needs to be
corrected using this
information
Orders already placed by the clients in the first
two month
Demand that has not been satisfied from previous
periods and that need to be satisfied as soon as
possible, so they need to be considered as real
demand for January
8
Other sources of demand. The quantity needed to
satisfy the security stock
9
Necessary production for each month
10
The necessary production for each month
11
The production days of each month
12
𝑀𝑎𝑥𝑖𝑚. 𝑑𝑎𝑖𝑙𝑦 𝑝𝑟𝑜𝑑𝑢𝑐𝑡𝑖𝑜𝑛 =
150 𝑤𝑜𝑟𝑘 ∗ 8ℎ/𝑑𝑎𝑦(𝑎𝑛𝑑 𝑤𝑜𝑟𝑘𝑒𝑟)
1.5 ℎ/𝑢𝑛
= 800 𝑢𝑛/𝑑𝑎𝑦
 Monthly production equal to the necessary production.
 Adjusting capacity by varying workforce levels through
hiring or laying off (use of idle time due to restrictions in
the layoff of permanent workers) and backorders.
REGULAR PRODUCTION = necessary production with the limit of
the maximum daily production
Total number of workers
Worker’s shift
Standard hours needed
to obtain a unit of the
family
13
 FEB: 800 * 20 = 16,000 un. We need 15,000 un.
 MAR: 800 * 22 = 17,600 un. We need 10,000 un.
 APR: 800 * 20 = 16,000 un. We need 5,000 un.
 MAY: 800 * 22 = 17,600 un. We need 5,000 un.
 JUN: 800 * 21 = 16,800 un. We need 5,000 un.
 JUL: 800 * 20 = 16,000 un. We need 10,000 un.
 AUG: 800 * 22 = 17,600 un. We need 5,000 un.
 SEP: 800 * 22 = 17,600 un. We need 5,000 un.
 OCT: 800 * 20 = 16,000 un. We need 10,000 un.
 NOV: 800 * 21 = 16,800 un. We need 15,000 un.
 DEC: 800 * 20 = 16,000 un. We need 20,000 un.
The production days of each month
Maxim. Daily production
Necessaryproductionforeachmonth
𝐽𝐴𝑁 = 800
𝑢𝑛
𝑑𝑎𝑦
× 20𝑑𝑎𝑦𝑠 = 16,000𝑢𝑛
Maxim. Daily production The production days of each month
We only need 15,000 un. (Production Necessity)
14
= Regular production * h/un.
JAN, FEB , NOV:
15,000 un. * 1.5 h./un.=22,500 h.
MAR, JUL, OCT:
10,000 un. * 1.5 h./un.=15,000 h.
APR, MAY, JUN, AUG, SEP:
5,000 un. * 1.5 h./un.= 7,500 h.
DEC:
16,000 un. (maximum possible)* 1.5 h./un.= 24,000 h.
Forecast Standard hours needed
to obtain a unit of the
family
20,000
15
=
𝑁𝑢𝑚𝑏𝑒𝑟 𝑜𝑓 ℎ𝑜𝑢𝑟 𝑜𝑓 𝑟𝑒𝑔𝑢𝑙𝑎𝑟 𝑝𝑟𝑜𝑑𝑢𝑐𝑡𝑖𝑜𝑛
𝐻𝑜𝑢𝑟 𝑝𝑒𝑟 𝑑𝑎𝑦 𝑎𝑛𝑑 𝑤𝑜𝑟𝑘𝑒𝑟 × 𝑑𝑎𝑦𝑠 𝑜𝑓 𝑝𝑟𝑜𝑑𝑢𝑐𝑡𝑖𝑜𝑛
JAN: 22,500 h. / (8 h./day and work. * 20 days) = 140.625 = 141 work.
FEB: 22,500 / (8 * 20) = 140.625 = 141 work.
MAR: 15,000 / (8 * 22) = 85.23 = 86 work.
ABR: 7,500 / (8 * 20) = 46.875 = 47 work. X
MAY: 7,500 / (8 * 22) = 42.61 = 43 work. X
JUN: 7,500 / (8 * 21) = 44.64 = 45 work. X
JUL: 15,000 / (8 * 20) = 93.75 = 94 work.
AUG: 7,500 / (8 * 22) = 42.61 = 43 work. X
SEP: 7,500 / (8 * 22) = 42.61 = 43 work. X
OCT: 15,000 / (8 * 20) = 93.75 = 94 work.
NOV: 22,500 / (8 * 21) = 133.93 = 134 work.
DEC: 24,000 / (8 * 20) = 150 work.
50 workers;
permanent
workforce
Workforce 150 workers
• 50 permanent
• 100 temporaty
Note: The idle hours from the rounding are not
considered to calculate the corresponging costs
16
𝑁𝑢𝑚𝑏𝑒𝑟 𝑜𝑓 ℎ𝑜𝑢𝑟 𝑜𝑓 𝑟𝑒𝑔𝑢𝑙𝑎𝑟 𝑝𝑟𝑜𝑑𝑢𝑐𝑡𝑖𝑜𝑛
× 𝑆𝑡𝑎𝑛𝑑𝑎𝑟𝑑 ℎ𝑜𝑢𝑟 𝑜𝑓 𝑟𝑒𝑔𝑢𝑙𝑎𝑟 𝑡𝑖𝑚𝑒 𝑙𝑎𝑏𝑜𝑟
JAN: 1,000 m.u. / h.
22,500 h. * 1,000 m.u./ h. = 22,500,000 m.u. = 22,500 t.m.u.
The same way for the remaining months.
𝑊𝑜𝑟𝑘𝑒𝑟𝑠 𝑚𝑜. 𝑖_𝑡ℎ𝑖𝑠 𝑚𝑜𝑛𝑡ℎ − 𝑊𝑜𝑟𝑘𝑒𝑟𝑠 (𝑚𝑜. 𝑖 − 1_𝑝𝑟𝑒𝑣𝑖𝑜𝑢𝑠 𝑚𝑜𝑛𝑡ℎ)
Difference between the number of workers in this month and the
previous one.
If positive, it implies hiring. If negative, it implies laying off.
JAN: 141 workwers /JAN – 150 work./BEGINNING(Dec) = -9 work.
17
FEB: 141-141 = 0 work.
MAR: 86-141 = -55 work.
APR: 50-86 = -36 work.
MAY: 50-50 = 0 work.
JUN: 50-50 = 0 work.
JUL: 94-50 = 44 work.
AUG: 50-94 = -44 work.
SEP: 50-50 = 0 work.
OCT: 94-50= 44 work.
NOV: 134-94= 40 work.
DEC: 150-134= 16 work.
18
𝐶𝑜𝑠𝑡 𝑜𝑓 ℎ𝑖𝑟𝑖𝑛𝑔 𝑜𝑟 𝑙𝑎𝑦𝑜𝑓𝑓 𝑖𝑛 𝑚.
𝑢
𝑤𝑜𝑟𝑘𝑒𝑟𝑠
× 𝑊𝑜𝑟𝑘𝑒𝑟𝑠
Cost of Hiring= 100,000 m.u. / work.
Cost of Layoff =150,000 m.u./ work.
JAN: 9 work. * 150,000 m.u./ work. = 1,350,000 u.m.
= 1,350 t.m.u.
MAR: 55 work. * 150,000 m.u./ work. =
8,250,000 m.u.
APR: 36 work. * 150,000 m.u./ work. =
5,400,000 m.u.
AUG: 44 work. * 150,000 m.u./ work. =
6,600,000 m.u.
JUL: 44 work. * 100,000 m.u./ work. =
4,400,000 m.u.
OCT: 44 work. * 100,000 m.u./ work.=
4,400,000 m.u.
NOV: 40 work. * 100,000 m.u./ work. =
4,000,000 m.u.
DEC: 16 work. * 100,000 m.u./ work. =
1,600,000 m.u.FEB, MAY, JUN, SEP: 0 t.m.u.
19
𝐹𝑖𝑛𝑎𝑙 𝑖𝑛𝑣𝑒𝑛𝑡𝑜𝑟𝑦 𝑚𝑜. 𝑖 − 1 + 𝑟𝑒𝑔𝑢𝑙𝑎𝑟 𝑝𝑟𝑜𝑑𝑢𝑐𝑡𝑖𝑜𝑛 𝑖
− 𝑛𝑒𝑐𝑒𝑠𝑠𝑎𝑟𝑦 𝑝𝑟𝑜𝑑𝑐𝑢𝑐𝑡𝑖𝑜𝑛 𝑜𝑓 𝑚𝑜𝑛𝑡ℎ 𝑖.
If the final inventory < 0 = there is some production that is
not satisfied and backordered.
DEC: 0 + 16,000 un– 20,000 un. = -4,000 un.
Necessary production of month i – final inventory (month i-1) =
necessary production
Necessary production
Regular production
Production which is not
satisfied and
backordered
20
(Cim) = Ciu*(Iem+Ibm)/2 (or else (Cim)=Ciu*Iem)
un. and month (demand not covered)* m.u./un. and month
COST OF INVENTORY= 200 m.u./un. and month.
COST OF BACKORDER= 1,500 m.u./un. and month
DIC: |- 4,000 un.| * 1,500 m.u./un. and month = 6,000 t.m.u.
We don´t
have it
Final inventory
21
APR: Workers needed: 47
Permanent workers: 50
Therefore we have 3 workers in idle time:
3 workers * 20 days * 8 h./day and work. =
480 h. (idle)
COST OF IDLE TIME (1,100 m.u./h.):
480 h. * 1,100 m.u./h. = 528 t.m.u.
MAY: hours: 7*22*8 = 1,232; cost:1,232*1,100 = 1,355.2 t.m.u.
JUN: hours: 5*21*8 = 840; cost: 840* 1,100 = 924 t.m.u.
ℎ𝑜𝑢𝑟 𝑝𝑒𝑟𝑚𝑎𝑛𝑒𝑛𝑡 𝑤𝑜𝑟𝑘𝑓𝑜𝑟𝑐𝑒 − ℎ𝑜𝑢𝑟𝑠 𝑛𝑒𝑒𝑑𝑒𝑑 𝑤𝑜𝑟𝑘𝑓𝑜𝑟𝑐𝑒
× 𝑚. 𝑢/ℎ
Note: The idle hours from the rounding are not
considered to calculate the corresponging costs
22
ℎ𝑜𝑢𝑟 𝑐𝑢𝑟𝑟𝑒𝑛𝑡 𝑤𝑜𝑟𝑘𝑓𝑜𝑟𝑐𝑒 − ℎ𝑜𝑢𝑟𝑠 𝑟𝑒𝑔𝑢𝑙𝑎𝑟 𝑝𝑟𝑜𝑑𝑢𝑐𝑡𝑖𝑜𝑛
× 𝑚. 𝑢/ℎ
We will have idle time
everytime we have
rounding of workersJAN: Hours with current workforce
141 work. * 20 days * 8 h./day and work. =
22,560 h.
Hours regular production: 22,500 h.
Hours of idle time: 22,560 – 22,500 = 60 h.
COST OF IDLE TIME (1,100 m.u./h.):
ABR: 50*20*8 - 7,500 = 500;
Cost= 500*1,100 = 550 t.m.u.
60 h. * 1,100 m.u./h. = 66 t.m.u.
23
TC = 174,000 + 36,000 + 6,000 + 5,517.6 = 221,517.6 t.m.u.
Units produced on time for the customers (necessary production):
JAN: 15,000 un.; FEB: 15,000 un.; MAR: 10,000; APR: 5,000 un.; MAY: 5,000 un.; JUN:
5,000 un.; JUL: 10,000 un.; AUG: 5,000 un.; SEP: 5,000 un.; OCT: 10,000 un.; NOV:
15,000 un.; DEC: 20,000 un./NEEDED -4,000/Inventory = 16,000;
𝑇𝑜𝑡𝑎𝑙 𝑐𝑜𝑠𝑡 𝑜𝑓 𝑟𝑒𝑔𝑢𝑙𝑎𝑟 𝑝𝑟𝑜𝑑𝑢𝑐𝑡𝑖𝑜𝑛
+ 𝑡𝑜𝑡𝑎𝑙 𝑐𝑜𝑠𝑡 𝑜𝑓 ℎ𝑖𝑟𝑖𝑛𝑔 𝑎𝑛𝑑 𝑙𝑎𝑦𝑜𝑓𝑓 + 𝑡𝑜𝑡𝑎𝑙 𝑐𝑜𝑠𝑡 𝑜𝑓 𝑜𝑣𝑒𝑟𝑡𝑖𝑚𝑒
+ 𝑡𝑜𝑡𝑎𝑙 𝑐𝑜𝑠𝑡 𝑜𝑓 𝑠𝑢𝑏𝑐𝑜𝑛𝑡𝑟𝑎𝑐𝑡𝑖𝑜𝑛
+ 𝑡𝑜𝑡𝑎𝑙 𝑐𝑜𝑠𝑡 𝑜𝑓 𝑖𝑛𝑣𝑒𝑛𝑡𝑜𝑟𝑦 𝑏𝑎𝑐𝑘𝑜𝑟𝑑𝑒𝑟 + 𝑡𝑜𝑡𝑎𝑙 𝑐𝑜𝑠𝑡 𝑜𝑓 𝑖𝑑𝑙𝑒 𝑡𝑖𝑚𝑒
𝑈𝑛𝑖𝑡 𝑝𝑟𝑜𝑑𝑢𝑐𝑒𝑑 𝑜𝑛 𝑡𝑖𝑚𝑒
𝑈𝑛𝑖𝑡𝑠 𝑟𝑒𝑞𝑢𝑖𝑟𝑒𝑑
TOTAL sum = 116,000 un.
=
116,000 𝑢𝑛𝑖𝑡𝑠 𝑝𝑟𝑜𝑑𝑢𝑐𝑒𝑑
120,000 𝑢𝑛𝑖𝑡𝑠 𝑟𝑒𝑞𝑢𝑖𝑟𝑒𝑑
× 100 = 96,67%
24
EXAMPLE OF AGGREGATE PLANNING
TABLE 2. ALTERNATIVE 1: CHASE STRATEGY
J F M A MY J JL AU S O N D TOTAL
Forecast 9.000 15.000 10.000 5.000 5.000 5.000 10.000 5.000 5.000 10.000 15.000 20.000 114.000
Orders placed 10.000 1.800
Backordered units 4.500
Security Stock 500
Necessary Production 15.000 15.000 10.000 5.000 5.000 5.000 10.000 5.000 5.000 10.000 15.000 20.000 120.000
Cumulative Production 15.000 30.000 40.000 45.000 50.000 55.000 65.000 70.000 75.000 85.000 100.000 120.000 120.000
Production Days 20 20 22 20 22 21 20 22 22 20 21 20 250
Regular Production 15.000 15.000 10.000 5.000 5.000 5.000 10.000 5.000 5.000 10.000 15.000 16.000 116.000
Overtime Production
Hours of Regular Prod. 22.500 22.500 15.000 7.500 7.500 7.500 15.000 7.500 7.500 15.000 22.500 24.000
Workforce 141 141 86 47/50 43/50 45/50 94 43/50 43/50 94 134 150
Cost of Regular Prod. 22.500 22.500 15.000 7.500 7.500 7.500 15.000 7.500 7.500 15.000 22.500 24.000 174.000
Variation of Workforce -9 0 -55 -36 0 0 44 -44 0 44 40 16
Cost of Hiring/Layoff 1.350 8.250 5.400 4.400 6.600 4.400 4.000 1.600 36.000
Overtime Hours
Cost of Overtime
Subcontracting Cost
Final Inventory 0 0 0 0 0 0 0 0 0 0 0 -4.000
Cost of inventory/backorder 6.000 6.000
Cost of idle time 528 1.355 924 1.355 1.355 5.518
Total cost 221.518
25
 Frequent layoffs could generate:
 Insecurity.
 Decrease in motivation.
 Decrease in work satisfaction, and
therefore, in productivity.
 It may affect to the predictions made when
elaborating the plan.
26
Strategies to obtain
an aggregate plan
Pure (one
objective)
Level
Strategy
Mixed
(multiple
objectives)
Objective: maintaining a
constant output rate,
production rate and therefore
constant workforce level over
the planning horizon.
27
Level strategy
Level of
regular
production
Level of
total
production
28
 The workforce and, therefore, the daily regular production
will remain constant.
 The production is adjusted by inventory variations.
REGULAR PRODUCTION = daily regular production x production days
Total necessary production
Total production days
29
 FEB: 480*20 = 9,600 un. < 15,000 un.
 MAR: 480*22 = 10,560 un. < 15,000 un.
 APR: 480*20 = 9,600 un. < 10,000 un.
 MAY: 480*22 = 10,560 un. > 5,000 un.
 JUN: 480*21 = 10,080 un. > 5,000 un.
 JUL: 480*20 = 9,600 un. < 10,000 un.
 AUG: 480*22 = 10,560 un. > 5,000 un.
 SEP: 480*22 = 10,560 un. > 5,000 un.
 OCT: 480*20 = 9,600 un. < 10,000 un.
 NOV: 480*21 = 10,080 un. < 15,000 un.
 DEC: 480*20 = 9,600 un. < 20,000 un.
Production days per monthDaily regular production
Necessaryproductionpermonth
Daily regular production
Production days per month
Necessary production per month
30
= Regular production x h./un.
JAN, FEB, APR, JUL, OCT, DEC:
9,600 un. x 1.5 h./un. = 14,400 h.
MAR, MAY, AUG, SEP:
10,560 un. x 1.5 h./un. = 15,840 h.
JUN, NOV:
10,080 un. x 1.5 h./un. = 15,120 h.
31
Hours of regular production
Standard hour of regular time labour
= h. x m.u./h.
=
Number of h./day = 480 un./day x 1.5 h./un. = 720 h./day
Number of workers = = 90 workers
The same for all the remaining months.
JAN
Daily regular production
is always 480 un./day
32
= work. (i) – work. (i-1)
Difference between the number of workers in one month and the previous one.
- If positive, it will imply hiring.
- If negative, it will imply layoff.
JAN: 90 workers (JAN) – 150 workers (BEGINNING) = -60 workers
FEB: 90 workers (FEB) – 90 workers (JAN) = 0 workers
The same for all the remaining months.
= m.u./worker x worker
Cost of hiring = 100,000 m.u./worker
Cost of layoff = 150,000 m.u./worker
JAN: 60 workers x 150,000 m.u./worker = 9,000 t.m.u.
Cost of hiring/layoff is zero in the remaining months.
33
=
= final inventory (i-1) + regular production i – necessary production i
If the final inventory is less than zero, then there is production not satisfied
and therefore backordered.
 JAN: FI = 0 + 9,600 – 15,000 = -5,400 un.
 FEB: FI = -5,400 + 9,600 – 15,000 = -10,800 un.
 MAR: FI = -10,800 + 10,560 – 10,000 = -10,240 un.
 APR: FI = -10,240 + 9,600 – 5,000 = -5,640 un.
 MAY: FI = -5,640 + 10,560 – 5,000 = -80 un.
 JUN: FI = -80 + 10,080 – 5,000 = 5,000 un.
 JUL: FI = 5,000 + 9,600 – 10,000 = 4,600 un.
 AUG: FI = 4,600 + 10,560 – 5,000 = 10,160 un.
 SEP: FI = 10,160 + 10,560 – 5,000 = 15,720 un.
 OCT: FI = 15,720 + 9,600 – 10,000 = 15,320 un.
 NOV: FI = 15,320 + 10,080 – 15,000 = 10,400 un.
 DEC: FI = 10,400 + 9,600 – 20,000 = 0 un.
Final inventory
Necessaryproductionpermonth
Regular production per month34
 JAN: 5,400 un. x 1,500 m.u./un. month = 8,100 t.m.u./month
 FEB: 16,200 t.m.u.
 MAR: 15,360 t.m.u.
 APR: 8,460 t.m.u.
 MAY: 120 t.m.u.
 JUN: = 500 t.m.u.
 JUL: 960 t.m.u.
 AUG: 1,476 t.m.u.
 SEP: 2,588 t.m.u.
 OCT: 3,104 t.m.u.
 NOV: 2,572 t.m.u.
 DEC: 1,040 t.m.u.
Cost of backorder = un. and month (demand not satisfied) x m.u./un. and month
Cost of inventory per month (Cim) =
CostofbackorderCostofinventory
Negative final inventory
(production not satisfied)
Inventory or carrying costs
Final inventory
Backorder costs
35
TC = 180,000 + 9,000 + 60,480 = 249,480 t.m.u.
=
SERVICE LEVEL =
UNITS PRODUCED ON TIME FOR THE CUSTOMERS = units needed - inventory
 JAN: 9,600 un.
 FEB: 4,200 un.
 MAR: -240 un.
 APR: -640 un.
 MAY: 4,920 un.
 JUN: 5,000 un.
TOTAL = 87,840 un.
 JUL: 10,000 un.
 AUG: 5,000 un.
 SEP: 5,000 un.
 OCT: 10,000 un.
 NOV: 15,000 un.
 DEC: 20,000 un.
Cost of regular production Cost of hiring and layoff
Cost of inventory and backorder
36
37
J F M A MY J JL AU S O N D TOTAL
Necessary Prod.
Plan 15.000 15.000 10.000 5.000 5.000 5.000 10.000 5.000 5.000 10.000 15.000 20.000 120.000
Cum. Plan 15.000 30.000 40.000 45.000 50.000 55.000 65.000 70.000 75.000 85.000 100.000 120.000 120.000
Prod. Days 20 20 22 20 22 21 20 22 22 20 21 20 250
Regular Prod. 9.600 9.600 10.560 9.600 10.560 10.080 960 10.560 10.560 9.600 10.080 9.600 120.000
Overtime Prod.
Subcontracting
(units)
Hours of
Regular Prod. 14.400 14.400 15.840 14.400 15.840 15.120 14.400 15.840 15.840 14.400 15.120 14.400
Workforce 90 90 90 90 90 90 90 90 90 90 90 90
Cost of Regular
Production 14.400 14.400 15.840 14.400 15.840 15.120 14.400 15.840 15.840 14.400 15.120 14.400 180.000
Variation of
workforce -60 0 0 0 0 0 0 0 0 0 0 0
Cost of hiring
and layoff 9.000 9.000
Overtime H.
Cost of overtime
Cost of
subcontracting
Final Inventory -5.400 -10.800 -10.240 -5.640 -80 5.000 4.600 10.160 15.720 15.320 10.400 0
Cost of
inventory and
backorder 8.100 16.200 15.360 8.460 120 492 960 1.476 2.588 3.104 2.572 1.040 60.480
Cost of idle time
Total cost 249.480
Factors to take into account to satisfy the necessary production when using just
regular production is not possible:
Cost of regular production:
1,000 m.u./h. x 1.5 h./un. = 1,500 m.u./un.
Backordering costs 1,500 m.u./(un. month)
and a decrease in the customer service level
Subcontracting leads to an incremental cost of 1,000 m.u./u.n.
Production on overtime leads to an incremental cost of:
Therefore, if there is lack of capacity, we have to use the alternative with lower
incremental cost with respect to the regular production unit cost:
First, we will produce on overtime.
Secondly, subcontracting.
The last option, backordering.
38
Strategies to obtain
an aggregate plan
Pure (one
objective)
Mixed
(multiple
objectives)
Mixed
Alternative
Objective: sets production
equal to forecasted demand.
𝑅𝑒𝑔𝑢𝑙𝑎𝑟 𝑃𝑟𝑜𝑑𝑢𝑐𝑡𝑖𝑜𝑛
𝑃𝑒𝑟𝑖𝑜𝑑
=
𝐹𝑜𝑟𝑒𝑐𝑎𝑠𝑡𝑒𝑑 𝑑𝑒𝑚𝑎𝑛𝑑
𝑃𝑒𝑟𝑖𝑜𝑑39
 Objective: reduce () Total Cost of the first
option.
 Using the hiring and layoff rationally
We will maintain a constant workforce of
52 workers to avoid the cost of hiring and layoff…
in April, May, June, July, August and September
The remaining months we will use variation in the
workforce if possible, avoiding the overtime production
and subcontracting.
40
 We start by laying off 9 workers and staying with 141 workers needed
to produce 15,000 un. required in JAN and FEB
 In MAR we layoff 55 workers (variation of the workforce,141-86) and
we keep 86 workers to produce 10,000 units needed in that month.
 In APR, MAY, JUN, JUL, AUG and SEP we layoff 34 workers and level the
workforce with 52 workers (86-34) to face the total demand (or
necessary production) in such interval (35,000 un.)(*)
Months Layoff Remaining workers Units to produce
Jan and Feb 9 workers 141 workers 15,000 un.
Month Layoff Remaining workers Units to produce
March 55 workers 86 workers 10,000 un.
Months Layoff Remaining workers Units to produce
Apr, May, Jun,
Jul, Aug and Sep
34 workers 52 workers 35,000 un.
41
 In OCT we hire 42 workers, having then a workforce of 94 (52+42) workers
needed to satisfy the 10,000 un. of production of that month.
 In NOV we hire 35 workers, having a total of 129 (94+35) workers, although a
priori we need 134 workers to produce the 15.000 un. required that month which
would require to hire 40 workers. The remaining units of production needed
15,000 un. -14,448 un. (21,672 h./1.5 h./un.), will be covered with available
inventory, 2,228 (Iim)-1,676 (Ifm) =552, and therefore in DEC inventory will be 0.
The lack of production will be covered using overtime, and if it is not
possible, subcontracting.
Month Hire Remaining workers Units to produce
Oct 42 workers 94 workers 10,000 un.
Month Hire Remaining workers Units to produce
Nov 35 workers 129 workers 15.000 un.
42
 (*) from April to September…
NECESSARY PROD.
5,000 + 5,000 + 5,000 +10,000 + 5,000 + 5,000 = 35,000 un.
NECESSARY WORK HOURS
35,000 un. * 1.5 h./un. = 52,500 h.
NUMBER OF PRODUCTION DAYS
20 + 22 + 21 + 20 + 22 + 22 = 127 days
DAYLY HOURS NEEDED
WORKERS NEEDED A DAY
43
 FEB: 141*8h *20. = 22,560 h.
 MAR: 86 *8h *22 = 15,136 h.
 APR: 52 *8h *20 = 8,320 h.
 MAY: 52 *8h *22 = 9,152 h.
 JUN: 52 *8h *21 = 8,736 h.
 JUL: 52 *8h *20 = 8,320 h.
 AUG: 52 *8h *22 = 9,152 h.
 SEP: 52 *8h *22 = 9,152 h.
 OCT: 94 *8h *20 = 15,040 h.
 NOV: 129 *8h *21 = 21,672 h.
 DEC: 129 *8h *20 = 20,640 h.
Production days per month
Daily regular production
Nr. of workers Production days per month
Hours of regular production per month
44
JAN: 141 workers * 8 h./(day and work) * 20 days = 22,560 h.
Hours of regular production per month
JAN: 22,560 h.e. / 1.5 h.e./un. = 15,040 un. > 15,000 un.
Hours of regular production Standard hours needed to obtain a unit of the family
Forecast
 FEB: 22,560 h.e. / 1,5 h.e./un. = 15,040 un. > 15,000
 MAR: 15,136 h.e. / 1,5 h.e./un. = 10,090 un. > 10,000
 APR: 8,320 h.e. / 1,5 h.e./un. = 5,546 un. > 5,000
 MAY: 9,152 h.e. / 1,5 h.e./un. = 6,101 un. > 5,000
 JUN: 8,736 h.e. / 1,5 h.e./un. = 5,824 un. > 5,000
 JUL: 8,320 h.e. / 1,5 h.e./un. = 5,546 un. < 10,000
 AUG: 9,152 h.e. / 1,5 h.e./un. = 6,101 un. > 5,000
 SEP: 9,152 h.e. / 1,5 h.e./un. = 6,101 un. > 5,000
 OCT: 15,040 h.e. / 1,5 h.e./un. = 10,026 un. > 10,000
 NOV: 21,672 h.e. / 1,5 h.e./un. = 14,448 un. < 15,000
 DEC: 20,640 h.e. / 1,5 h.e./un. = 13,760 un. < 20,000
Overtime
production
45
Necessary Production Inventory available
 JULY: Demand not satisfied = 10,000 – 5,546 – 2,601 = 1,813 un.
 1,813 un. * 1.5 h./un. = 2,719.5 h. additional
 Available overtime hours = 0.1 * 8320 h. = 832 overtime hours
 Overtime hours (min between 832 and 2,719.5 = 832)
 Overtime production: 832 O.H./1.5 h./un.) = 554 un.
 There are still some necessary production not satisfied that we
have to subcontract
1,813 un.- 554 un.=1,259 un.
Correct the slides!
Inventory available = 2601
10% union contract Hours of regular production
46
Necessary Production Inventory available
 NOV: Demand not satisfied = 15,000 – 14,448 – 2,228 = 1,676 un.
 There is demand not satisfied but we can compensate it with the
inventory available so we do not need to work overtime
 DEC: Demand not satisfied = 20,000 – 13,760 – 1,676 = 4,564 un
 4,564 un. * 1.5 h./un. = 6,846 h. additional
 Available overtime hours = 0.1 * 20,640 h. = 2,064 overtime hours
 Overtime hours (min between 6,846 and 2,064 = 2,064)
 Overtime production: 2,064 O.H./1.5 h./un.) = 1,376 un.
 There are still some necessary production not satisfied that we
have to subcontract
4,564 un.- 1376 un. = 3,188 un.
Necessary Production Inventory available
10% union contract Hours of regular production
47
 FEB: 22,560 h. * 1,000 m.u./h. = 22,560 t.m.u
 MAR: 15,136 h. * 1,000 m.u./h. = 15,136 t.m.u
 APR: 8,320 h. * 1,000 m.u./h. = 8,320 t.m.u
 MAY: 9,152 h. * 1,000 m.u./h. = 9,152 t.m.u
 JUN: 8,736 h. * 1,000 m.u./h. = 8,736 t.m.u
 JUL: 8,320 h. * 1,000 m.u./h. = 8,320 t.m.u
 AUG: 9,152 h. * 1,000 m.u./h. = 9,152 t.m.u
 SEP: 9,152 h. * 1,000 m.u./h. = 9,152 t.m.u
 OCT: 15,040 h. * 1,000 m.u./h. = 15,040 t.m.u
 NOV: 21,672 h. * 1,000 m.u./h. = 21,672 t.m.u
 DEC: 20,640 h. * 1,000 m.u./h. = 20,640 t.m.u
JAN:.
22,560 h. * 1,000 m.u./ h. = 22,560,000 m.u. = 22,500 t.m.u.
The same way for the remaining months.
48
1,000 m.u. / h
h. * m.u./h.
 JAN: 141 -150 = -9 work. (layoff)
 MAR: 86-141 = -55 work. (layoff)
 APR: 52-86 = -34 work. (layoff)
 OCT: 94-52 = 42 work. (hiring)
 NOV: 129-94 = 35 work. (hiring)
49
trab. (i) – trab. (i-1)
Difference between the number of workers in this month and the previous one.
If positive, If negative
it implies hiring., it implies laying off.
𝐶𝑜𝑠𝑡 𝑜𝑓 ℎ𝑖𝑟𝑖𝑛𝑔 𝑜𝑟 𝑙𝑎𝑦𝑜𝑓𝑓 𝑖𝑛 𝑚.
𝑢
𝑤𝑜𝑟𝑘𝑒𝑟𝑠
× 𝑊𝑜𝑟𝑘𝑒𝑟𝑠
Cost of Hiring= 100,000 m.u. / work.
Cost of Layoff =150,000 m.u./ work.
JAN: 9 layoff * 150,000 m.u./ work. = 1,350,000 u.m.
= 1,350 t.m.u.
MAR: 55 layoff. * 150,000 m.u./ work.
= 8,250,000 m.u.
APR: 34 layoff. * 150,000 m.u./ work. =
5,100,000 m.u.
OCT: 42 hired. * 100,000 m.u./ work.=
4,200,000 m.u.
NOV: 35 hired. * 100,000 m.u./ work. =
3,500,000 m.u.
FEB, MAY, JUN, SEP: 0 t.m.u.
50
m.u./O.H.*O.H.
 JUL: 1,500 m.u./O.H. *832 O.H. = 1,248 t.m.u.
 DEC: 1,500 m.u./O.H.* 2,064 O.H.= 3,096 t.m.u.
Cost of
overtime
Subcon. un.* (1.000 m.u. + cost of regular production).
JUL: Units to subcontract = 1,813 un. - 554 un. = 1,259 un.
Cost of regular production:
1,000 m.u./h. * 1.5 h./un. = 1,500 m.u./un.
Demand not satisfied Production on overtime
Cost of subcontracting:
1,259 un.* (1,000 m.u./un. + 1,500 m.u./un.) = 3,147.5 t.m.u.
DEC: Units to subcontract: 6,240 un.- 1,376-1,676 un.=3,188 un.
Cost of subcontracting:
3,188 un.* (1,000 m.u. + 1,500 m.u.) = 7,970 t.m.u.
51
 JAN: F.I.= 0 + 15,040 – 15,000 = 40 un.
 FEB: F.I. = 80 un.
 MAR: F.I. = 170 un.
 APR: F.I. = 716 un.
 MAY: F.I. = 1,817 un.
 JUN: F.I. = 2,641 un.
 JUL: F.I. = -1,813 un.
(satisfied with overtime and subcontracting) = 0
 AUG: F.I. = 1,110 un.
 SEP: F.I. = 2,202 un.
 OCT: F.I. = 2,228 un.
 NOV: F.I. = 1,676 un.
 DIC: F.I. = -4,564 un.
(satisfied with overtime and subcontracting) = 0
final inventory (i-1) + regular production i – necessary production i
If the final inventory is lower than zero, then there is still some demand
not satisfied and therefore backordered
52
JAN: 200 m.u.*(40+0)/2 = 4 t.m.u.
FEB: 12 t.m.u. MAR: 25t.m.u. APR: 88.6t.m.u.
MAY: 253.3 t.m.u. JUN: 445.8t.m.u. JUL: 264.1 t.m.u.
AUG: 110.1 t.m.u. SEP: 330.3t.m.u. OCT: 443t.m.u.
NOV: 390.4 t.m.u. DEC: 167.6t.m.u.
Cost of backorder = un. and month (production not satisfied)* m.u./un. and month.
There are no backordered units since we have used overtime and subcontracting
Cost of inventory per month (Cim) = Ciu*(Iem+Ibm)/2
53
 TC = 170,440 + 22,400 + 4,344 + 11,117.5 +
2,534.2 = 210,835.7 t.m.u.
 SERVICE LEVEL
The incremental cost is lower than for alternative 1 and the service level is 100%.
This alternative leads to a lower
cost but it is not the optimal
Presentation aggregate planning

Presentation aggregate planning

  • 1.
    Ana Gómiz Aragón LauraRodríguez-León Rodríguez Manuela Valera Ortega Group 12
  • 2.
    Determining the quantityand timing of production for the intermediate future (3 to 18 months). Adjusting production rates, labour levels, inventory levels, overtime work, subcontracting rates... Determine the best way to meet forecasted demand and minimise cost over the planning period 1
  • 3.
    1. Introduction toAggregate Planning 2. Aggregate Planning strategies 3. The process of Aggregate Planning 4. Methods for Aggregate Planning 5. Aggregate Planning in services 2
  • 4.
    Strategies to obtainan aggregate plan Pure Mixed Pure strategies Chase strategy Level strategy Level strategy Level of regular production Level of total production 3
  • 5.
    Strategies to obtain anaggregate plan Pure (one objective) Chase Strategy Mixed (multiple objectives) Objective: sets production equal to forecasted demand. 𝑅𝑒𝑔𝑢𝑙𝑎𝑟 𝑃𝑟𝑜𝑑𝑢𝑐𝑡𝑖𝑜𝑛 𝑃𝑒𝑟𝑖𝑜𝑑 = 𝐹𝑜𝑟𝑒𝑐𝑎𝑠𝑡𝑒𝑑 𝑑𝑒𝑚𝑎𝑛𝑑 𝑃𝑒𝑟𝑖𝑜𝑑 4
  • 6.
     Assume youare the operations manager of a firm that carries a single family of products. To obtain a unit of the family we need 1.5 hours (standard hours) of workforce and each worker’s shift is 8 h. a day. At this moment, December, the workforce of the firm is 150 workers (50 permanent and 100 temporary) and, although the security stock desired is 500 units, the available stock is zero.  1.5 hours per unit (standards h)  Worker’s shift 8h a day per  Workforce 150 workers  50 permanent  100 temporary  Security stock desired 500 units  Available stock 0 EXAMPLE OF AGGREGATE PLANNING 5
  • 7.
    Cost information: • Materialsper unit of product: 5,000 m.u. • Standard hour of regular time labor: 1,000 m.u. • Standard hour of overtime labor: 1,500 m.u. • Standard hour of idle time: 1,100 m.u. • Hiring: 100,000 m.u./worker • Layoff of a temporary worker: 150,000 m.u. • Subcontracting cost per unit: 1,000 m.u., over the regular production cost of one unit. • Inventory or carrying cost: 200 m.u./unit and month. Cim = Ciu (Iem + Ibm)/2 • Back order cost: 1,500 m.u./ unit and month. Other factors that need to be considered to develop an aggregate planning, are the company policies: • There are three shifts and the maximum number of workers that can work simultaneously is 50. Therefore, there is a maximum of 1,200 h/day (150 workers x 8 h/day and worker). • The maximum number of overtime hours allowed is 10% of the hours available in regular time. • Permanent workers cannot be laid off. • All the costs are linear functions. • The daily demand, within each month, is uniform and continuous. 6
  • 8.
    Demand forecast fornext year, obtained with the information provided by the marketing department 7
  • 9.
    Additional information obtainedfrom client portfolios The demand forecast needs to be corrected using this information Orders already placed by the clients in the first two month Demand that has not been satisfied from previous periods and that need to be satisfied as soon as possible, so they need to be considered as real demand for January 8
  • 10.
    Other sources ofdemand. The quantity needed to satisfy the security stock 9
  • 11.
  • 12.
    The necessary productionfor each month 11
  • 13.
    The production daysof each month 12
  • 14.
    𝑀𝑎𝑥𝑖𝑚. 𝑑𝑎𝑖𝑙𝑦 𝑝𝑟𝑜𝑑𝑢𝑐𝑡𝑖𝑜𝑛= 150 𝑤𝑜𝑟𝑘 ∗ 8ℎ/𝑑𝑎𝑦(𝑎𝑛𝑑 𝑤𝑜𝑟𝑘𝑒𝑟) 1.5 ℎ/𝑢𝑛 = 800 𝑢𝑛/𝑑𝑎𝑦  Monthly production equal to the necessary production.  Adjusting capacity by varying workforce levels through hiring or laying off (use of idle time due to restrictions in the layoff of permanent workers) and backorders. REGULAR PRODUCTION = necessary production with the limit of the maximum daily production Total number of workers Worker’s shift Standard hours needed to obtain a unit of the family 13
  • 15.
     FEB: 800* 20 = 16,000 un. We need 15,000 un.  MAR: 800 * 22 = 17,600 un. We need 10,000 un.  APR: 800 * 20 = 16,000 un. We need 5,000 un.  MAY: 800 * 22 = 17,600 un. We need 5,000 un.  JUN: 800 * 21 = 16,800 un. We need 5,000 un.  JUL: 800 * 20 = 16,000 un. We need 10,000 un.  AUG: 800 * 22 = 17,600 un. We need 5,000 un.  SEP: 800 * 22 = 17,600 un. We need 5,000 un.  OCT: 800 * 20 = 16,000 un. We need 10,000 un.  NOV: 800 * 21 = 16,800 un. We need 15,000 un.  DEC: 800 * 20 = 16,000 un. We need 20,000 un. The production days of each month Maxim. Daily production Necessaryproductionforeachmonth 𝐽𝐴𝑁 = 800 𝑢𝑛 𝑑𝑎𝑦 × 20𝑑𝑎𝑦𝑠 = 16,000𝑢𝑛 Maxim. Daily production The production days of each month We only need 15,000 un. (Production Necessity) 14
  • 16.
    = Regular production* h/un. JAN, FEB , NOV: 15,000 un. * 1.5 h./un.=22,500 h. MAR, JUL, OCT: 10,000 un. * 1.5 h./un.=15,000 h. APR, MAY, JUN, AUG, SEP: 5,000 un. * 1.5 h./un.= 7,500 h. DEC: 16,000 un. (maximum possible)* 1.5 h./un.= 24,000 h. Forecast Standard hours needed to obtain a unit of the family 20,000 15
  • 17.
    = 𝑁𝑢𝑚𝑏𝑒𝑟 𝑜𝑓 ℎ𝑜𝑢𝑟𝑜𝑓 𝑟𝑒𝑔𝑢𝑙𝑎𝑟 𝑝𝑟𝑜𝑑𝑢𝑐𝑡𝑖𝑜𝑛 𝐻𝑜𝑢𝑟 𝑝𝑒𝑟 𝑑𝑎𝑦 𝑎𝑛𝑑 𝑤𝑜𝑟𝑘𝑒𝑟 × 𝑑𝑎𝑦𝑠 𝑜𝑓 𝑝𝑟𝑜𝑑𝑢𝑐𝑡𝑖𝑜𝑛 JAN: 22,500 h. / (8 h./day and work. * 20 days) = 140.625 = 141 work. FEB: 22,500 / (8 * 20) = 140.625 = 141 work. MAR: 15,000 / (8 * 22) = 85.23 = 86 work. ABR: 7,500 / (8 * 20) = 46.875 = 47 work. X MAY: 7,500 / (8 * 22) = 42.61 = 43 work. X JUN: 7,500 / (8 * 21) = 44.64 = 45 work. X JUL: 15,000 / (8 * 20) = 93.75 = 94 work. AUG: 7,500 / (8 * 22) = 42.61 = 43 work. X SEP: 7,500 / (8 * 22) = 42.61 = 43 work. X OCT: 15,000 / (8 * 20) = 93.75 = 94 work. NOV: 22,500 / (8 * 21) = 133.93 = 134 work. DEC: 24,000 / (8 * 20) = 150 work. 50 workers; permanent workforce Workforce 150 workers • 50 permanent • 100 temporaty Note: The idle hours from the rounding are not considered to calculate the corresponging costs 16
  • 18.
    𝑁𝑢𝑚𝑏𝑒𝑟 𝑜𝑓 ℎ𝑜𝑢𝑟𝑜𝑓 𝑟𝑒𝑔𝑢𝑙𝑎𝑟 𝑝𝑟𝑜𝑑𝑢𝑐𝑡𝑖𝑜𝑛 × 𝑆𝑡𝑎𝑛𝑑𝑎𝑟𝑑 ℎ𝑜𝑢𝑟 𝑜𝑓 𝑟𝑒𝑔𝑢𝑙𝑎𝑟 𝑡𝑖𝑚𝑒 𝑙𝑎𝑏𝑜𝑟 JAN: 1,000 m.u. / h. 22,500 h. * 1,000 m.u./ h. = 22,500,000 m.u. = 22,500 t.m.u. The same way for the remaining months. 𝑊𝑜𝑟𝑘𝑒𝑟𝑠 𝑚𝑜. 𝑖_𝑡ℎ𝑖𝑠 𝑚𝑜𝑛𝑡ℎ − 𝑊𝑜𝑟𝑘𝑒𝑟𝑠 (𝑚𝑜. 𝑖 − 1_𝑝𝑟𝑒𝑣𝑖𝑜𝑢𝑠 𝑚𝑜𝑛𝑡ℎ) Difference between the number of workers in this month and the previous one. If positive, it implies hiring. If negative, it implies laying off. JAN: 141 workwers /JAN – 150 work./BEGINNING(Dec) = -9 work. 17
  • 19.
    FEB: 141-141 =0 work. MAR: 86-141 = -55 work. APR: 50-86 = -36 work. MAY: 50-50 = 0 work. JUN: 50-50 = 0 work. JUL: 94-50 = 44 work. AUG: 50-94 = -44 work. SEP: 50-50 = 0 work. OCT: 94-50= 44 work. NOV: 134-94= 40 work. DEC: 150-134= 16 work. 18
  • 20.
    𝐶𝑜𝑠𝑡 𝑜𝑓 ℎ𝑖𝑟𝑖𝑛𝑔𝑜𝑟 𝑙𝑎𝑦𝑜𝑓𝑓 𝑖𝑛 𝑚. 𝑢 𝑤𝑜𝑟𝑘𝑒𝑟𝑠 × 𝑊𝑜𝑟𝑘𝑒𝑟𝑠 Cost of Hiring= 100,000 m.u. / work. Cost of Layoff =150,000 m.u./ work. JAN: 9 work. * 150,000 m.u./ work. = 1,350,000 u.m. = 1,350 t.m.u. MAR: 55 work. * 150,000 m.u./ work. = 8,250,000 m.u. APR: 36 work. * 150,000 m.u./ work. = 5,400,000 m.u. AUG: 44 work. * 150,000 m.u./ work. = 6,600,000 m.u. JUL: 44 work. * 100,000 m.u./ work. = 4,400,000 m.u. OCT: 44 work. * 100,000 m.u./ work.= 4,400,000 m.u. NOV: 40 work. * 100,000 m.u./ work. = 4,000,000 m.u. DEC: 16 work. * 100,000 m.u./ work. = 1,600,000 m.u.FEB, MAY, JUN, SEP: 0 t.m.u. 19
  • 21.
    𝐹𝑖𝑛𝑎𝑙 𝑖𝑛𝑣𝑒𝑛𝑡𝑜𝑟𝑦 𝑚𝑜.𝑖 − 1 + 𝑟𝑒𝑔𝑢𝑙𝑎𝑟 𝑝𝑟𝑜𝑑𝑢𝑐𝑡𝑖𝑜𝑛 𝑖 − 𝑛𝑒𝑐𝑒𝑠𝑠𝑎𝑟𝑦 𝑝𝑟𝑜𝑑𝑐𝑢𝑐𝑡𝑖𝑜𝑛 𝑜𝑓 𝑚𝑜𝑛𝑡ℎ 𝑖. If the final inventory < 0 = there is some production that is not satisfied and backordered. DEC: 0 + 16,000 un– 20,000 un. = -4,000 un. Necessary production of month i – final inventory (month i-1) = necessary production Necessary production Regular production Production which is not satisfied and backordered 20
  • 22.
    (Cim) = Ciu*(Iem+Ibm)/2(or else (Cim)=Ciu*Iem) un. and month (demand not covered)* m.u./un. and month COST OF INVENTORY= 200 m.u./un. and month. COST OF BACKORDER= 1,500 m.u./un. and month DIC: |- 4,000 un.| * 1,500 m.u./un. and month = 6,000 t.m.u. We don´t have it Final inventory 21
  • 23.
    APR: Workers needed:47 Permanent workers: 50 Therefore we have 3 workers in idle time: 3 workers * 20 days * 8 h./day and work. = 480 h. (idle) COST OF IDLE TIME (1,100 m.u./h.): 480 h. * 1,100 m.u./h. = 528 t.m.u. MAY: hours: 7*22*8 = 1,232; cost:1,232*1,100 = 1,355.2 t.m.u. JUN: hours: 5*21*8 = 840; cost: 840* 1,100 = 924 t.m.u. ℎ𝑜𝑢𝑟 𝑝𝑒𝑟𝑚𝑎𝑛𝑒𝑛𝑡 𝑤𝑜𝑟𝑘𝑓𝑜𝑟𝑐𝑒 − ℎ𝑜𝑢𝑟𝑠 𝑛𝑒𝑒𝑑𝑒𝑑 𝑤𝑜𝑟𝑘𝑓𝑜𝑟𝑐𝑒 × 𝑚. 𝑢/ℎ Note: The idle hours from the rounding are not considered to calculate the corresponging costs 22
  • 24.
    ℎ𝑜𝑢𝑟 𝑐𝑢𝑟𝑟𝑒𝑛𝑡 𝑤𝑜𝑟𝑘𝑓𝑜𝑟𝑐𝑒− ℎ𝑜𝑢𝑟𝑠 𝑟𝑒𝑔𝑢𝑙𝑎𝑟 𝑝𝑟𝑜𝑑𝑢𝑐𝑡𝑖𝑜𝑛 × 𝑚. 𝑢/ℎ We will have idle time everytime we have rounding of workersJAN: Hours with current workforce 141 work. * 20 days * 8 h./day and work. = 22,560 h. Hours regular production: 22,500 h. Hours of idle time: 22,560 – 22,500 = 60 h. COST OF IDLE TIME (1,100 m.u./h.): ABR: 50*20*8 - 7,500 = 500; Cost= 500*1,100 = 550 t.m.u. 60 h. * 1,100 m.u./h. = 66 t.m.u. 23
  • 25.
    TC = 174,000+ 36,000 + 6,000 + 5,517.6 = 221,517.6 t.m.u. Units produced on time for the customers (necessary production): JAN: 15,000 un.; FEB: 15,000 un.; MAR: 10,000; APR: 5,000 un.; MAY: 5,000 un.; JUN: 5,000 un.; JUL: 10,000 un.; AUG: 5,000 un.; SEP: 5,000 un.; OCT: 10,000 un.; NOV: 15,000 un.; DEC: 20,000 un./NEEDED -4,000/Inventory = 16,000; 𝑇𝑜𝑡𝑎𝑙 𝑐𝑜𝑠𝑡 𝑜𝑓 𝑟𝑒𝑔𝑢𝑙𝑎𝑟 𝑝𝑟𝑜𝑑𝑢𝑐𝑡𝑖𝑜𝑛 + 𝑡𝑜𝑡𝑎𝑙 𝑐𝑜𝑠𝑡 𝑜𝑓 ℎ𝑖𝑟𝑖𝑛𝑔 𝑎𝑛𝑑 𝑙𝑎𝑦𝑜𝑓𝑓 + 𝑡𝑜𝑡𝑎𝑙 𝑐𝑜𝑠𝑡 𝑜𝑓 𝑜𝑣𝑒𝑟𝑡𝑖𝑚𝑒 + 𝑡𝑜𝑡𝑎𝑙 𝑐𝑜𝑠𝑡 𝑜𝑓 𝑠𝑢𝑏𝑐𝑜𝑛𝑡𝑟𝑎𝑐𝑡𝑖𝑜𝑛 + 𝑡𝑜𝑡𝑎𝑙 𝑐𝑜𝑠𝑡 𝑜𝑓 𝑖𝑛𝑣𝑒𝑛𝑡𝑜𝑟𝑦 𝑏𝑎𝑐𝑘𝑜𝑟𝑑𝑒𝑟 + 𝑡𝑜𝑡𝑎𝑙 𝑐𝑜𝑠𝑡 𝑜𝑓 𝑖𝑑𝑙𝑒 𝑡𝑖𝑚𝑒 𝑈𝑛𝑖𝑡 𝑝𝑟𝑜𝑑𝑢𝑐𝑒𝑑 𝑜𝑛 𝑡𝑖𝑚𝑒 𝑈𝑛𝑖𝑡𝑠 𝑟𝑒𝑞𝑢𝑖𝑟𝑒𝑑 TOTAL sum = 116,000 un. = 116,000 𝑢𝑛𝑖𝑡𝑠 𝑝𝑟𝑜𝑑𝑢𝑐𝑒𝑑 120,000 𝑢𝑛𝑖𝑡𝑠 𝑟𝑒𝑞𝑢𝑖𝑟𝑒𝑑 × 100 = 96,67% 24
  • 26.
    EXAMPLE OF AGGREGATEPLANNING TABLE 2. ALTERNATIVE 1: CHASE STRATEGY J F M A MY J JL AU S O N D TOTAL Forecast 9.000 15.000 10.000 5.000 5.000 5.000 10.000 5.000 5.000 10.000 15.000 20.000 114.000 Orders placed 10.000 1.800 Backordered units 4.500 Security Stock 500 Necessary Production 15.000 15.000 10.000 5.000 5.000 5.000 10.000 5.000 5.000 10.000 15.000 20.000 120.000 Cumulative Production 15.000 30.000 40.000 45.000 50.000 55.000 65.000 70.000 75.000 85.000 100.000 120.000 120.000 Production Days 20 20 22 20 22 21 20 22 22 20 21 20 250 Regular Production 15.000 15.000 10.000 5.000 5.000 5.000 10.000 5.000 5.000 10.000 15.000 16.000 116.000 Overtime Production Hours of Regular Prod. 22.500 22.500 15.000 7.500 7.500 7.500 15.000 7.500 7.500 15.000 22.500 24.000 Workforce 141 141 86 47/50 43/50 45/50 94 43/50 43/50 94 134 150 Cost of Regular Prod. 22.500 22.500 15.000 7.500 7.500 7.500 15.000 7.500 7.500 15.000 22.500 24.000 174.000 Variation of Workforce -9 0 -55 -36 0 0 44 -44 0 44 40 16 Cost of Hiring/Layoff 1.350 8.250 5.400 4.400 6.600 4.400 4.000 1.600 36.000 Overtime Hours Cost of Overtime Subcontracting Cost Final Inventory 0 0 0 0 0 0 0 0 0 0 0 -4.000 Cost of inventory/backorder 6.000 6.000 Cost of idle time 528 1.355 924 1.355 1.355 5.518 Total cost 221.518 25
  • 27.
     Frequent layoffscould generate:  Insecurity.  Decrease in motivation.  Decrease in work satisfaction, and therefore, in productivity.  It may affect to the predictions made when elaborating the plan. 26
  • 28.
    Strategies to obtain anaggregate plan Pure (one objective) Level Strategy Mixed (multiple objectives) Objective: maintaining a constant output rate, production rate and therefore constant workforce level over the planning horizon. 27
  • 29.
  • 30.
     The workforceand, therefore, the daily regular production will remain constant.  The production is adjusted by inventory variations. REGULAR PRODUCTION = daily regular production x production days Total necessary production Total production days 29
  • 31.
     FEB: 480*20= 9,600 un. < 15,000 un.  MAR: 480*22 = 10,560 un. < 15,000 un.  APR: 480*20 = 9,600 un. < 10,000 un.  MAY: 480*22 = 10,560 un. > 5,000 un.  JUN: 480*21 = 10,080 un. > 5,000 un.  JUL: 480*20 = 9,600 un. < 10,000 un.  AUG: 480*22 = 10,560 un. > 5,000 un.  SEP: 480*22 = 10,560 un. > 5,000 un.  OCT: 480*20 = 9,600 un. < 10,000 un.  NOV: 480*21 = 10,080 un. < 15,000 un.  DEC: 480*20 = 9,600 un. < 20,000 un. Production days per monthDaily regular production Necessaryproductionpermonth Daily regular production Production days per month Necessary production per month 30
  • 32.
    = Regular productionx h./un. JAN, FEB, APR, JUL, OCT, DEC: 9,600 un. x 1.5 h./un. = 14,400 h. MAR, MAY, AUG, SEP: 10,560 un. x 1.5 h./un. = 15,840 h. JUN, NOV: 10,080 un. x 1.5 h./un. = 15,120 h. 31
  • 33.
    Hours of regularproduction Standard hour of regular time labour = h. x m.u./h. = Number of h./day = 480 un./day x 1.5 h./un. = 720 h./day Number of workers = = 90 workers The same for all the remaining months. JAN Daily regular production is always 480 un./day 32
  • 34.
    = work. (i)– work. (i-1) Difference between the number of workers in one month and the previous one. - If positive, it will imply hiring. - If negative, it will imply layoff. JAN: 90 workers (JAN) – 150 workers (BEGINNING) = -60 workers FEB: 90 workers (FEB) – 90 workers (JAN) = 0 workers The same for all the remaining months. = m.u./worker x worker Cost of hiring = 100,000 m.u./worker Cost of layoff = 150,000 m.u./worker JAN: 60 workers x 150,000 m.u./worker = 9,000 t.m.u. Cost of hiring/layoff is zero in the remaining months. 33
  • 35.
    = = final inventory(i-1) + regular production i – necessary production i If the final inventory is less than zero, then there is production not satisfied and therefore backordered.  JAN: FI = 0 + 9,600 – 15,000 = -5,400 un.  FEB: FI = -5,400 + 9,600 – 15,000 = -10,800 un.  MAR: FI = -10,800 + 10,560 – 10,000 = -10,240 un.  APR: FI = -10,240 + 9,600 – 5,000 = -5,640 un.  MAY: FI = -5,640 + 10,560 – 5,000 = -80 un.  JUN: FI = -80 + 10,080 – 5,000 = 5,000 un.  JUL: FI = 5,000 + 9,600 – 10,000 = 4,600 un.  AUG: FI = 4,600 + 10,560 – 5,000 = 10,160 un.  SEP: FI = 10,160 + 10,560 – 5,000 = 15,720 un.  OCT: FI = 15,720 + 9,600 – 10,000 = 15,320 un.  NOV: FI = 15,320 + 10,080 – 15,000 = 10,400 un.  DEC: FI = 10,400 + 9,600 – 20,000 = 0 un. Final inventory Necessaryproductionpermonth Regular production per month34
  • 36.
     JAN: 5,400un. x 1,500 m.u./un. month = 8,100 t.m.u./month  FEB: 16,200 t.m.u.  MAR: 15,360 t.m.u.  APR: 8,460 t.m.u.  MAY: 120 t.m.u.  JUN: = 500 t.m.u.  JUL: 960 t.m.u.  AUG: 1,476 t.m.u.  SEP: 2,588 t.m.u.  OCT: 3,104 t.m.u.  NOV: 2,572 t.m.u.  DEC: 1,040 t.m.u. Cost of backorder = un. and month (demand not satisfied) x m.u./un. and month Cost of inventory per month (Cim) = CostofbackorderCostofinventory Negative final inventory (production not satisfied) Inventory or carrying costs Final inventory Backorder costs 35
  • 37.
    TC = 180,000+ 9,000 + 60,480 = 249,480 t.m.u. = SERVICE LEVEL = UNITS PRODUCED ON TIME FOR THE CUSTOMERS = units needed - inventory  JAN: 9,600 un.  FEB: 4,200 un.  MAR: -240 un.  APR: -640 un.  MAY: 4,920 un.  JUN: 5,000 un. TOTAL = 87,840 un.  JUL: 10,000 un.  AUG: 5,000 un.  SEP: 5,000 un.  OCT: 10,000 un.  NOV: 15,000 un.  DEC: 20,000 un. Cost of regular production Cost of hiring and layoff Cost of inventory and backorder 36
  • 38.
    37 J F MA MY J JL AU S O N D TOTAL Necessary Prod. Plan 15.000 15.000 10.000 5.000 5.000 5.000 10.000 5.000 5.000 10.000 15.000 20.000 120.000 Cum. Plan 15.000 30.000 40.000 45.000 50.000 55.000 65.000 70.000 75.000 85.000 100.000 120.000 120.000 Prod. Days 20 20 22 20 22 21 20 22 22 20 21 20 250 Regular Prod. 9.600 9.600 10.560 9.600 10.560 10.080 960 10.560 10.560 9.600 10.080 9.600 120.000 Overtime Prod. Subcontracting (units) Hours of Regular Prod. 14.400 14.400 15.840 14.400 15.840 15.120 14.400 15.840 15.840 14.400 15.120 14.400 Workforce 90 90 90 90 90 90 90 90 90 90 90 90 Cost of Regular Production 14.400 14.400 15.840 14.400 15.840 15.120 14.400 15.840 15.840 14.400 15.120 14.400 180.000 Variation of workforce -60 0 0 0 0 0 0 0 0 0 0 0 Cost of hiring and layoff 9.000 9.000 Overtime H. Cost of overtime Cost of subcontracting Final Inventory -5.400 -10.800 -10.240 -5.640 -80 5.000 4.600 10.160 15.720 15.320 10.400 0 Cost of inventory and backorder 8.100 16.200 15.360 8.460 120 492 960 1.476 2.588 3.104 2.572 1.040 60.480 Cost of idle time Total cost 249.480
  • 39.
    Factors to takeinto account to satisfy the necessary production when using just regular production is not possible: Cost of regular production: 1,000 m.u./h. x 1.5 h./un. = 1,500 m.u./un. Backordering costs 1,500 m.u./(un. month) and a decrease in the customer service level Subcontracting leads to an incremental cost of 1,000 m.u./u.n. Production on overtime leads to an incremental cost of: Therefore, if there is lack of capacity, we have to use the alternative with lower incremental cost with respect to the regular production unit cost: First, we will produce on overtime. Secondly, subcontracting. The last option, backordering. 38
  • 40.
    Strategies to obtain anaggregate plan Pure (one objective) Mixed (multiple objectives) Mixed Alternative Objective: sets production equal to forecasted demand. 𝑅𝑒𝑔𝑢𝑙𝑎𝑟 𝑃𝑟𝑜𝑑𝑢𝑐𝑡𝑖𝑜𝑛 𝑃𝑒𝑟𝑖𝑜𝑑 = 𝐹𝑜𝑟𝑒𝑐𝑎𝑠𝑡𝑒𝑑 𝑑𝑒𝑚𝑎𝑛𝑑 𝑃𝑒𝑟𝑖𝑜𝑑39
  • 41.
     Objective: reduce() Total Cost of the first option.  Using the hiring and layoff rationally We will maintain a constant workforce of 52 workers to avoid the cost of hiring and layoff… in April, May, June, July, August and September The remaining months we will use variation in the workforce if possible, avoiding the overtime production and subcontracting. 40
  • 42.
     We startby laying off 9 workers and staying with 141 workers needed to produce 15,000 un. required in JAN and FEB  In MAR we layoff 55 workers (variation of the workforce,141-86) and we keep 86 workers to produce 10,000 units needed in that month.  In APR, MAY, JUN, JUL, AUG and SEP we layoff 34 workers and level the workforce with 52 workers (86-34) to face the total demand (or necessary production) in such interval (35,000 un.)(*) Months Layoff Remaining workers Units to produce Jan and Feb 9 workers 141 workers 15,000 un. Month Layoff Remaining workers Units to produce March 55 workers 86 workers 10,000 un. Months Layoff Remaining workers Units to produce Apr, May, Jun, Jul, Aug and Sep 34 workers 52 workers 35,000 un. 41
  • 43.
     In OCTwe hire 42 workers, having then a workforce of 94 (52+42) workers needed to satisfy the 10,000 un. of production of that month.  In NOV we hire 35 workers, having a total of 129 (94+35) workers, although a priori we need 134 workers to produce the 15.000 un. required that month which would require to hire 40 workers. The remaining units of production needed 15,000 un. -14,448 un. (21,672 h./1.5 h./un.), will be covered with available inventory, 2,228 (Iim)-1,676 (Ifm) =552, and therefore in DEC inventory will be 0. The lack of production will be covered using overtime, and if it is not possible, subcontracting. Month Hire Remaining workers Units to produce Oct 42 workers 94 workers 10,000 un. Month Hire Remaining workers Units to produce Nov 35 workers 129 workers 15.000 un. 42
  • 44.
     (*) fromApril to September… NECESSARY PROD. 5,000 + 5,000 + 5,000 +10,000 + 5,000 + 5,000 = 35,000 un. NECESSARY WORK HOURS 35,000 un. * 1.5 h./un. = 52,500 h. NUMBER OF PRODUCTION DAYS 20 + 22 + 21 + 20 + 22 + 22 = 127 days DAYLY HOURS NEEDED WORKERS NEEDED A DAY 43
  • 45.
     FEB: 141*8h*20. = 22,560 h.  MAR: 86 *8h *22 = 15,136 h.  APR: 52 *8h *20 = 8,320 h.  MAY: 52 *8h *22 = 9,152 h.  JUN: 52 *8h *21 = 8,736 h.  JUL: 52 *8h *20 = 8,320 h.  AUG: 52 *8h *22 = 9,152 h.  SEP: 52 *8h *22 = 9,152 h.  OCT: 94 *8h *20 = 15,040 h.  NOV: 129 *8h *21 = 21,672 h.  DEC: 129 *8h *20 = 20,640 h. Production days per month Daily regular production Nr. of workers Production days per month Hours of regular production per month 44 JAN: 141 workers * 8 h./(day and work) * 20 days = 22,560 h. Hours of regular production per month
  • 46.
    JAN: 22,560 h.e./ 1.5 h.e./un. = 15,040 un. > 15,000 un. Hours of regular production Standard hours needed to obtain a unit of the family Forecast  FEB: 22,560 h.e. / 1,5 h.e./un. = 15,040 un. > 15,000  MAR: 15,136 h.e. / 1,5 h.e./un. = 10,090 un. > 10,000  APR: 8,320 h.e. / 1,5 h.e./un. = 5,546 un. > 5,000  MAY: 9,152 h.e. / 1,5 h.e./un. = 6,101 un. > 5,000  JUN: 8,736 h.e. / 1,5 h.e./un. = 5,824 un. > 5,000  JUL: 8,320 h.e. / 1,5 h.e./un. = 5,546 un. < 10,000  AUG: 9,152 h.e. / 1,5 h.e./un. = 6,101 un. > 5,000  SEP: 9,152 h.e. / 1,5 h.e./un. = 6,101 un. > 5,000  OCT: 15,040 h.e. / 1,5 h.e./un. = 10,026 un. > 10,000  NOV: 21,672 h.e. / 1,5 h.e./un. = 14,448 un. < 15,000  DEC: 20,640 h.e. / 1,5 h.e./un. = 13,760 un. < 20,000 Overtime production 45
  • 47.
    Necessary Production Inventoryavailable  JULY: Demand not satisfied = 10,000 – 5,546 – 2,601 = 1,813 un.  1,813 un. * 1.5 h./un. = 2,719.5 h. additional  Available overtime hours = 0.1 * 8320 h. = 832 overtime hours  Overtime hours (min between 832 and 2,719.5 = 832)  Overtime production: 832 O.H./1.5 h./un.) = 554 un.  There are still some necessary production not satisfied that we have to subcontract 1,813 un.- 554 un.=1,259 un. Correct the slides! Inventory available = 2601 10% union contract Hours of regular production 46
  • 48.
    Necessary Production Inventoryavailable  NOV: Demand not satisfied = 15,000 – 14,448 – 2,228 = 1,676 un.  There is demand not satisfied but we can compensate it with the inventory available so we do not need to work overtime  DEC: Demand not satisfied = 20,000 – 13,760 – 1,676 = 4,564 un  4,564 un. * 1.5 h./un. = 6,846 h. additional  Available overtime hours = 0.1 * 20,640 h. = 2,064 overtime hours  Overtime hours (min between 6,846 and 2,064 = 2,064)  Overtime production: 2,064 O.H./1.5 h./un.) = 1,376 un.  There are still some necessary production not satisfied that we have to subcontract 4,564 un.- 1376 un. = 3,188 un. Necessary Production Inventory available 10% union contract Hours of regular production 47
  • 49.
     FEB: 22,560h. * 1,000 m.u./h. = 22,560 t.m.u  MAR: 15,136 h. * 1,000 m.u./h. = 15,136 t.m.u  APR: 8,320 h. * 1,000 m.u./h. = 8,320 t.m.u  MAY: 9,152 h. * 1,000 m.u./h. = 9,152 t.m.u  JUN: 8,736 h. * 1,000 m.u./h. = 8,736 t.m.u  JUL: 8,320 h. * 1,000 m.u./h. = 8,320 t.m.u  AUG: 9,152 h. * 1,000 m.u./h. = 9,152 t.m.u  SEP: 9,152 h. * 1,000 m.u./h. = 9,152 t.m.u  OCT: 15,040 h. * 1,000 m.u./h. = 15,040 t.m.u  NOV: 21,672 h. * 1,000 m.u./h. = 21,672 t.m.u  DEC: 20,640 h. * 1,000 m.u./h. = 20,640 t.m.u JAN:. 22,560 h. * 1,000 m.u./ h. = 22,560,000 m.u. = 22,500 t.m.u. The same way for the remaining months. 48 1,000 m.u. / h h. * m.u./h.
  • 50.
     JAN: 141-150 = -9 work. (layoff)  MAR: 86-141 = -55 work. (layoff)  APR: 52-86 = -34 work. (layoff)  OCT: 94-52 = 42 work. (hiring)  NOV: 129-94 = 35 work. (hiring) 49 trab. (i) – trab. (i-1) Difference between the number of workers in this month and the previous one. If positive, If negative it implies hiring., it implies laying off.
  • 51.
    𝐶𝑜𝑠𝑡 𝑜𝑓 ℎ𝑖𝑟𝑖𝑛𝑔𝑜𝑟 𝑙𝑎𝑦𝑜𝑓𝑓 𝑖𝑛 𝑚. 𝑢 𝑤𝑜𝑟𝑘𝑒𝑟𝑠 × 𝑊𝑜𝑟𝑘𝑒𝑟𝑠 Cost of Hiring= 100,000 m.u. / work. Cost of Layoff =150,000 m.u./ work. JAN: 9 layoff * 150,000 m.u./ work. = 1,350,000 u.m. = 1,350 t.m.u. MAR: 55 layoff. * 150,000 m.u./ work. = 8,250,000 m.u. APR: 34 layoff. * 150,000 m.u./ work. = 5,100,000 m.u. OCT: 42 hired. * 100,000 m.u./ work.= 4,200,000 m.u. NOV: 35 hired. * 100,000 m.u./ work. = 3,500,000 m.u. FEB, MAY, JUN, SEP: 0 t.m.u. 50
  • 52.
    m.u./O.H.*O.H.  JUL: 1,500m.u./O.H. *832 O.H. = 1,248 t.m.u.  DEC: 1,500 m.u./O.H.* 2,064 O.H.= 3,096 t.m.u. Cost of overtime Subcon. un.* (1.000 m.u. + cost of regular production). JUL: Units to subcontract = 1,813 un. - 554 un. = 1,259 un. Cost of regular production: 1,000 m.u./h. * 1.5 h./un. = 1,500 m.u./un. Demand not satisfied Production on overtime Cost of subcontracting: 1,259 un.* (1,000 m.u./un. + 1,500 m.u./un.) = 3,147.5 t.m.u. DEC: Units to subcontract: 6,240 un.- 1,376-1,676 un.=3,188 un. Cost of subcontracting: 3,188 un.* (1,000 m.u. + 1,500 m.u.) = 7,970 t.m.u. 51
  • 53.
     JAN: F.I.=0 + 15,040 – 15,000 = 40 un.  FEB: F.I. = 80 un.  MAR: F.I. = 170 un.  APR: F.I. = 716 un.  MAY: F.I. = 1,817 un.  JUN: F.I. = 2,641 un.  JUL: F.I. = -1,813 un. (satisfied with overtime and subcontracting) = 0  AUG: F.I. = 1,110 un.  SEP: F.I. = 2,202 un.  OCT: F.I. = 2,228 un.  NOV: F.I. = 1,676 un.  DIC: F.I. = -4,564 un. (satisfied with overtime and subcontracting) = 0 final inventory (i-1) + regular production i – necessary production i If the final inventory is lower than zero, then there is still some demand not satisfied and therefore backordered 52
  • 54.
    JAN: 200 m.u.*(40+0)/2= 4 t.m.u. FEB: 12 t.m.u. MAR: 25t.m.u. APR: 88.6t.m.u. MAY: 253.3 t.m.u. JUN: 445.8t.m.u. JUL: 264.1 t.m.u. AUG: 110.1 t.m.u. SEP: 330.3t.m.u. OCT: 443t.m.u. NOV: 390.4 t.m.u. DEC: 167.6t.m.u. Cost of backorder = un. and month (production not satisfied)* m.u./un. and month. There are no backordered units since we have used overtime and subcontracting Cost of inventory per month (Cim) = Ciu*(Iem+Ibm)/2 53
  • 55.
     TC =170,440 + 22,400 + 4,344 + 11,117.5 + 2,534.2 = 210,835.7 t.m.u.  SERVICE LEVEL The incremental cost is lower than for alternative 1 and the service level is 100%. This alternative leads to a lower cost but it is not the optimal