Downloaded 335 times


![© 2014 MapR Technologies 15
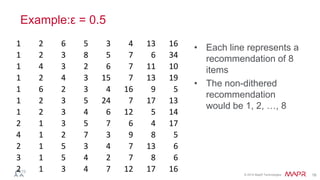
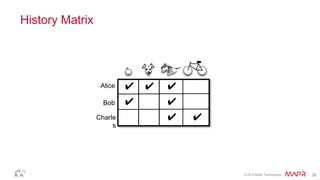
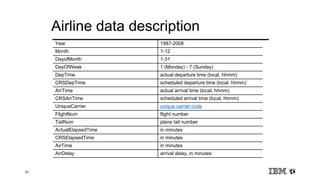
Simple Dithering Algorithm
• Generate synthetic score from log rank plus Gaussian
• Pick noise scale to provide desired level of mixing
• Typically:
• Oh… use floor(t/T) as seed so results don‟t change too often
s = logr + N(0,e)
e Î 0.4, 0.8[ ]
Dr µrexpe](https://image.slidesharecdn.com/wed1620-1750effectenbeurszaal-140424144536-phpapp02/85/Predictive-Analytics-with-Hadoop-15-320.jpg)


![47
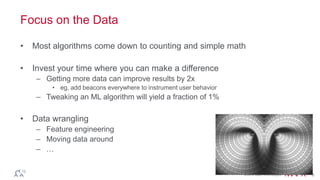
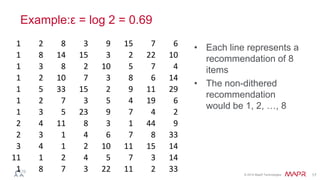
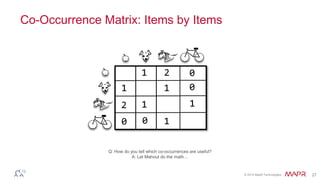
RHadoop Example (contd.)
csvtextinputformat = function(line) keyval(NULL, unlist(strsplit(line, ",")))
deptdelay = function (input, output) {
mapreduce(input = input,
output = output,
textinputformat = csvtextinputformat,
map = function(k, fields) {
# Skip header lines and bad records:
if (!(identical(fields[[1]], "Year")) & length(fields) == 29) {
deptDelay <- fields[[16]]
# Skip records where departure dalay is "NA":
if (!(identical(deptDelay, "NA"))) {
# field[9] is carrier, field[1] is year, field[2] is month:
keyval(c(fields[[9]], fields[[1]], fields[[2]]), deptDelay)}}},
reduce = function(keySplit, vv) {
keyval(keySplit[[2]], c(keySplit[[3]], length(vv), keySplit[[1]], mean(as.numeric(vv))))})}
from.dfs(deptdelay("/data/airline/1987.csv", "/dept-delay-month"))
Source: http://blog.revolutionanalytics.com/2012/03/r-and-hadoop-step-by-step-tutorials.html](https://image.slidesharecdn.com/wed1620-1750effectenbeurszaal-140424144536-phpapp02/85/Predictive-Analytics-with-Hadoop-46-320.jpg)


![53
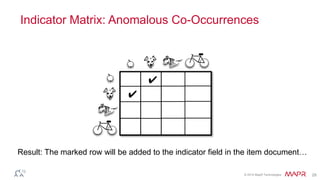
Explore, visualize, transform, model Hadoop data with
R
• Represent Big Data objects as R datatypes
• R's programming syntax and paradigm
• Data stays in HDFS
• R classes (e.g. bigr.data.frame) as proxies
• No low-level map/reduce constructs
• No underlying scripting languages
1
# Construct a bigr.frame to access large data set
air <- bigr.frame(dataPath="airline_demo.csv", …)
# How many flights were flown by United or Delta?
length(UniqueCarrier[UniqueCarrier %in% c("UA", "DL")])
# Filter all flights that were delayed by 15+ minutes at departure or arrival.
airSubset <- air[air$Cancelled == 0 & (air$DepDelay >= 15 | air$ArrDelay >= 15),
c("UniqueCarrier", "Origin", "Dest", "DepDelay", "ArrDelay")]
# For these filtered flights, compute key statistics (# of flights,
# average flying distance and flying time), grouped by airline
summary(count(UniqueCarrier) + mean(Distance) + mean(CRSElapsedTime) ~
UniqueCarrier, dataset = airSubset)
Bigr.boxplot(air$Distance ~ air$UniqueCarrier, …)](https://image.slidesharecdn.com/wed1620-1750effectenbeurszaal-140424144536-phpapp02/85/Predictive-Analytics-with-Hadoop-52-320.jpg)
![54
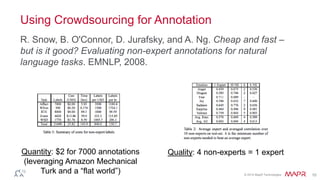
Scale out R in Hadoop
• Support parallel / partitioned execution of R
• Work around R’s memory limitations
• Execute R snippets on chunks of data
• Partitioned by key, by #rows, via sampling, …
• Follows R’s “apply” model
• Parallelized seamlessly Map/Reduce engine
2
# Filter the airline data on United and Hawaiian
bf <- air[air$UniqueCarrier %in% c("HA", "UA"),]
# Build one decision-tree model per airliner
models <- groupApply(data = bf, groupingColumns = list(bf$UniqueCarrier),
rfunction = function(df) { library(rpart)
predcols <- c('ArrDelay', 'DepDelay', 'DepTime'', 'Distance')
return (rpart(ArrDelay ~ ., df[,predcols]))})
# Pull the model for HA to the client
modelHA <- bigr.pull(models$HA)
# Visualize the model
prettyTree(modelHA)](https://image.slidesharecdn.com/wed1620-1750effectenbeurszaal-140424144536-phpapp02/85/Predictive-Analytics-with-Hadoop-53-320.jpg)


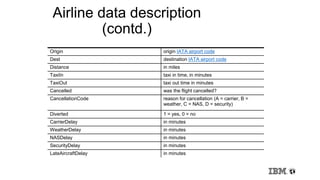
![57
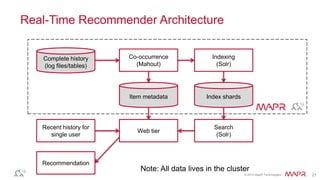
Example: What is the average scheduled flight time, actual
gate-to-gate time, and actual airtime for each city pair per
year?
mapper.year.market.enroute_time = function(key, val) {
# Skip header lines, cancellations, and diversions:
if ( !identical(as.character(val['Year']), 'Year')
& identical(as.numeric(val['Cancelled']), 0)
& identical(as.numeric(val['Diverted']), 0) ) {
# We don't care about direction of travel, so construct 'market'
# with airports ordered alphabetically
# (e.g, LAX to JFK becomes 'JFK-LAX'
if (val['Origin'] < val['Dest'])
market = paste(val['Origin'], val['Dest'], sep='-')
else
market = paste(val['Dest'], val['Origin'], sep='-')
# key consists of year, market
output.key = c(val['Year'], market)
# output gate-to-gate elapsed times (CRS and actual) + time in
air
output.val =
c(val['CRSElapsedTime'], val['ActualElapsedTime'], val['AirTime'])
return( keyval(output.key, output.val) )
}
}
reducer.year.market.enroute_time = function(key, val.list) {
# val.list is a list of row vectors
# a data.frame is a list of column vectors
# plyr's ldply() is the easiest way to convert IMHO
if ( require(plyr) )
val.df = ldply(val.list, as.numeric)
else { # this is as close as my deficient *apply skills can come w/o
plyr
val.list = lapply(val.list, as.numeric)
val.df = data.frame( do.call(rbind, val.list) )
}
colnames(val.df) = c('actual','crs','air')
output.key = key
output.val = c( nrow(val.df), mean(val.df$actual, na.rm=T),
mean(val.df$crs, na.rm=T),
mean(val.df$air, na.rm=T) )
return( keyval(output.key, output.val) )
}
mr.year.market.enroute_time = function (input, output) {
mapreduce(input = input,
output = output,
input.format = asa.csvtextinputformat,
map = mapper.year.market.enroute_time,
reduce = reducer.year.market.enroute_time,
backend.parameters = list(
hadoop = list(D = "mapred.reduce.tasks=10")
),
verbose=T)
}
hdfs.output.path = file.path(hdfs.output.root, 'enroute-time')
results =
mr.year.market.enroute_time(hdfs.input.path, hdfs.output.path)
results.df = from.dfs(results, to.data.frame=T)
colnames(results.df) = c('year', 'market', 'flights', 'scheduled',
'actual', 'in.air')
save(results.df, file="out/enroute.time.RData")
RHadoop Implementation
(>35 lines of code)
Equivalent Big R Implementation
(4 lines of code)
air <- bigr.frame(dataPath = "airline.csv", dataSource = “DEL", na.string="NA")
air$City1 <- ifelse(air$Origin < air$Dest, air$Origin, air$Dest)
air$City2 <- ifelse(air$Origin >= air$Dest, air$Origin, air$Dest)
summary(count(UniqueCarrier) + mean(ActualElapsedTime) +
mean(CRSElapsedTime) + mean(AirTime) ~ Year + City1 + City2 ,
dataset = air[air$Cancelled == 0 & air$Diverted == 0,])](https://image.slidesharecdn.com/wed1620-1750effectenbeurszaal-140424144536-phpapp02/85/Predictive-Analytics-with-Hadoop-56-320.jpg)


![63
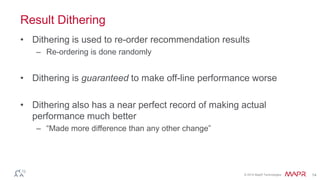
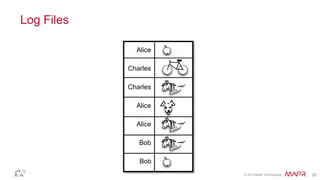
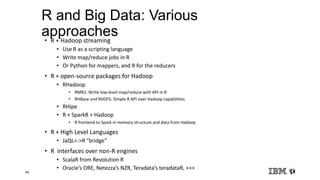
Example: Gaussian Non-negative Matrix Factorization
package gnmf;
import java.io.IOException;
import java.net.URISyntaxException;
import org.apache.hadoop.fs.FileSystem;
import org.apache.hadoop.fs.Path;
import org.apache.hadoop.mapred.JobConf;
public class MatrixGNMF
{
public static void main(String[] args) throws IOException, URISyntaxException
{
if(args.length < 10)
{
System.out.println("missing parameters");
System.out.println("expected parameters: [directory of v] [directory of w] [directory of h] " +
"[k] [num mappers] [num reducers] [replication] [working directory] " +
"[final directory of w] [final directory of h]");
System.exit(1);
}
String vDir = args[0];
String wDir = args[1];
String hDir = args[2];
int k = Integer.parseInt(args[3]);
int numMappers = Integer.parseInt(args[4]);
int numReducers = Integer.parseInt(args[5]);
int replication = Integer.parseInt(args[6]);
String outputDir = args[7];
String wFinalDir = args[8];
String hFinalDir = args[9];
JobConf mainJob = new JobConf(MatrixGNMF.class);
String vDirectory;
String wDirectory;
String hDirectory;
FileSystem.get(mainJob).delete(new Path(outputDir));
vDirectory = vDir;
hDirectory = hDir;
wDirectory = wDir;
String workingDirectory;
String resultDirectoryX;
String resultDirectoryY;
long start = System.currentTimeMillis();
System.gc();
System.out.println("starting calculation");
System.out.print("calculating X = WT * V... ");
workingDirectory = UpdateWHStep1.runJob(numMappers, numReducers, replication,
UpdateWHStep1.UPDATE_TYPE_H, vDirectory, wDirectory, outputDir, k);
resultDirectoryX = UpdateWHStep2.runJob(numMappers, numReducers, replication,
workingDirectory, outputDir);
FileSystem.get(mainJob).delete(new Path(workingDirectory));
System.out.println("done");
System.out.print("calculating Y = WT * W * H... ");
workingDirectory = UpdateWHStep3.runJob(numMappers, numReducers, replication,
wDirectory, outputDir);
resultDirectoryY = UpdateWHStep4.runJob(numMappers, replication, workingDirectory,
UpdateWHStep4.UPDATE_TYPE_H, hDirectory, outputDir);
FileSystem.get(mainJob).delete(new Path(workingDirectory));
System.out.println("done");
System.out.print("calculating H = H .* X ./ Y... ");
workingDirectory = UpdateWHStep5.runJob(numMappers, numReducers, replication,
hDirectory, resultDirectoryX, resultDirectoryY, hFinalDir, k);
System.out.println("done");
FileSystem.get(mainJob).delete(new Path(resultDirectoryX));
FileSystem.get(mainJob).delete(new Path(resultDirectoryY));
System.out.print("storing back H... ");
FileSystem.get(mainJob).delete(new Path(hDirectory));
hDirectory = workingDirectory;
System.out.println("done");
System.out.print("calculating X = V * HT... ");
workingDirectory = UpdateWHStep1.runJob(numMappers, numReducers, replication,
UpdateWHStep1.UPDATE_TYPE_W, vDirectory, hDirectory, outputDir, k);
resultDirectoryX = UpdateWHStep2.runJob(numMappers, numReducers, replication,
workingDirectory, outputDir);
FileSystem.get(mainJob).delete(new Path(workingDirectory));
System.out.println("done");
System.out.print("calculating Y = W * H * HT... ");
workingDirectory = UpdateWHStep3.runJob(numMappers, numReducers, replication,
hDirectory, outputDir);
resultDirectoryY = UpdateWHStep4.runJob(numMappers, replication, workingDirectory,
UpdateWHStep4.UPDATE_TYPE_W, wDirectory, outputDir);
FileSystem.get(mainJob).delete(new Path(workingDirectory));
System.out.println("done");
System.out.print("calculating W = W .* X ./ Y... ");
workingDirectory = UpdateWHStep5.runJob(numMappers, numReducers, replication,
wDirectory, resultDirectoryX, resultDirectoryY, wFinalDir, k);
System.out.println("done");
FileSystem.get(mainJob).delete(new Path(resultDirectoryX));
FileSystem.get(mainJob).delete(new Path(resultDirectoryY));
System.out.print("storing back W... ");
FileSystem.get(mainJob).delete(new Path(wDirectory));
wDirectory = workingDirectory;
System.out.println("done");
package gnmf;
import gnmf.io.MatrixObject;
import gnmf.io.MatrixVector;
import gnmf.io.TaggedIndex;
import java.io.IOException;
import java.util.Iterator;
import org.apache.hadoop.fs.Path;
import org.apache.hadoop.mapred.FileInputFormat;
import org.apache.hadoop.mapred.FileOutputFormat;
import org.apache.hadoop.mapred.JobClient;
import org.apache.hadoop.mapred.JobConf;
import org.apache.hadoop.mapred.MapReduceBase;
import org.apache.hadoop.mapred.Mapper;
import org.apache.hadoop.mapred.OutputCollector;
import org.apache.hadoop.mapred.Reducer;
import org.apache.hadoop.mapred.Reporter;
import org.apache.hadoop.mapred.SequenceFileInputFormat;
import org.apache.hadoop.mapred.SequenceFileOutputFormat;
public class UpdateWHStep2
{
static class UpdateWHStep2Mapper extends MapReduceBase
implements Mapper<TaggedIndex, MatrixVector, TaggedIndex, MatrixVector>
{
@Override
public void map(TaggedIndex key, MatrixVector value,
OutputCollector<TaggedIndex, MatrixVector> out,
Reporter reporter) throws IOException
{
out.collect(key, value);
}
}
static class UpdateWHStep2Reducer extends MapReduceBase
implements Reducer<TaggedIndex, MatrixVector, TaggedIndex, MatrixObject>
{
@Override
public void reduce(TaggedIndex key, Iterator<MatrixVector> values,
OutputCollector<TaggedIndex, MatrixObject> out, Reporter reporter)
throws IOException
{
MatrixVector result = null;
while(values.hasNext())
{
MatrixVector current = values.next();
if(result == null)
{
result = current.getCopy();
} else
{
result.addVector(current);
}
}
if(result != null)
{
out.collect(new TaggedIndex(key.getIndex(), TaggedIndex.TYPE_VECTOR_X),
new MatrixObject(result));
}
}
}
public static String runJob(int numMappers, int numReducers, int replication,
String inputDir, String outputDir) throws IOException
{
String workingDirectory = outputDir + System.currentTimeMillis() + "-UpdateWHStep2/";
JobConf job = new JobConf(UpdateWHStep2.class);
job.setJobName("MatrixGNMFUpdateWHStep2");
job.setInputFormat(SequenceFileInputFormat.class);
FileInputFormat.setInputPaths(job, new Path(inputDir));
job.setOutputFormat(SequenceFileOutputFormat.class);
FileOutputFormat.setOutputPath(job, new Path(workingDirectory));
job.setNumMapTasks(numMappers);
job.setMapperClass(UpdateWHStep2Mapper.class);
job.setMapOutputKeyClass(TaggedIndex.class);
job.setMapOutputValueClass(MatrixVector.class);
package gnmf;
import gnmf.io.MatrixCell;
import gnmf.io.MatrixFormats;
import gnmf.io.MatrixObject;
import gnmf.io.MatrixVector;
import gnmf.io.TaggedIndex;
import java.io.IOException;
import java.util.Iterator;
import org.apache.hadoop.filecache.DistributedCache;
import org.apache.hadoop.fs.FileSystem;
import org.apache.hadoop.fs.Path;
import org.apache.hadoop.mapred.FileInputFormat;
import org.apache.hadoop.mapred.FileOutputFormat;
import org.apache.hadoop.mapred.JobClient;
import org.apache.hadoop.mapred.JobConf;
import org.apache.hadoop.mapred.MapReduceBase;
import org.apache.hadoop.mapred.Mapper;
import org.apache.hadoop.mapred.OutputCollector;
import org.apache.hadoop.mapred.Reducer;
import org.apache.hadoop.mapred.Reporter;
import org.apache.hadoop.mapred.SequenceFileInputFormat;
import org.apache.hadoop.mapred.SequenceFileOutputFormat;
public class UpdateWHStep1
{
public static final int UPDATE_TYPE_H = 0;
public static final int UPDATE_TYPE_W = 1;
static class UpdateWHStep1Mapper extends MapReduceBase
implements Mapper<TaggedIndex, MatrixObject, TaggedIndex, MatrixObject>
{
private int updateType;
@Override
public void map(TaggedIndex key, MatrixObject value,
OutputCollector<TaggedIndex, MatrixObject> out,
Reporter reporter) throws IOException
{
if(updateType == UPDATE_TYPE_W && key.getType() == TaggedIndex.TYPE_CELL)
{
MatrixCell current = (MatrixCell) value.getObject();
out.collect(new TaggedIndex(current.getColumn(), TaggedIndex.TYPE_CELL),
new MatrixObject(new MatrixCell(key.getIndex(), current.getValue())));
} else
{
out.collect(key, value);
}
}
@Override
public void configure(JobConf job)
{
updateType = job.getInt("gnmf.updateType", 0);
}
}
static class UpdateWHStep1Reducer extends MapReduceBase
implements Reducer<TaggedIndex, MatrixObject, TaggedIndex, MatrixVector>
{
private double[] baseVector = null;
private int vectorSizeK;
@Override
public void reduce(TaggedIndex key, Iterator<MatrixObject> values,
OutputCollector<TaggedIndex, MatrixVector> out, Reporter reporter)
throws IOException
{
if(key.getType() == TaggedIndex.TYPE_VECTOR)
{
if(!values.hasNext())
throw new RuntimeException("expected vector");
MatrixFormats current = values.next().getObject();
if(!(current instanceof MatrixVector))
throw new RuntimeException("expected vector");
baseVector = ((MatrixVector) current).getValues();
} else
{
while(values.hasNext())
{
MatrixCell current = (MatrixCell) values.next().getObject();
if(baseVector == null)
{
out.collect(new TaggedIndex(current.getColumn(), TaggedIndex.TYPE_VECTOR),
new MatrixVector(vectorSizeK));
} else
{
if(baseVector.length == 0)
throw new RuntimeException("base vector is corrupted");
MatrixVector resultingVector = new MatrixVector(baseVector);
resultingVector.multiplyWithScalar(current.getValue());
if(resultingVector.getValues().length == 0)
throw new RuntimeException("multiplying with scalar failed");
out.collect(new TaggedIndex(current.getColumn(), TaggedIndex.TYPE_VECTOR),
resultingVector);
}
}
baseVector = null;
}
}
@Override
public void configure(JobConf job)
{
vectorSizeK = job.getInt("dml.matrix.gnmf.k", 0);
if(vectorSizeK == 0)
Java Implementation
(>1500 lines of code)
Equivalent Big R - SystemML Implementation
(12 lines of code)
# Perform matrix operations, say non-negative factorization
# V ~~ WH
V <- bigr.matrix("V.mtx”); # initial matrix on HDFS
W <- bigr.matrix(nrow=nrow(V), ncols=k); # initialize starting points
H <- bigr.matrix(nrow=k, ncols=ncols(V));
for (i in 1:numiterations) {
H <- H * (t(W) %*% V / t(W) %*% W %*% H);
W <- W * (V %*% t(H) / W %*% H %*% t(H));
}](https://image.slidesharecdn.com/wed1620-1750effectenbeurszaal-140424144536-phpapp02/85/Predictive-Analytics-with-Hadoop-62-320.jpg)


This document discusses predictive analytics using Hadoop. It provides examples of recommendation and classification using big data. It describes obtaining large training datasets through crowdsourcing and implicit feedback. It also discusses operational considerations for predictive models, including snapshotting data, leveraging NFS for ingestion, and ensuring high availability. The document concludes with a question and answer section.