Download to read offline


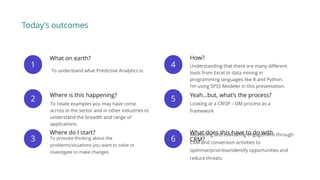

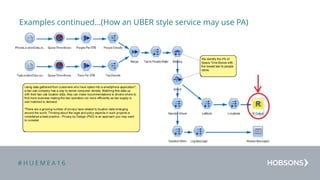
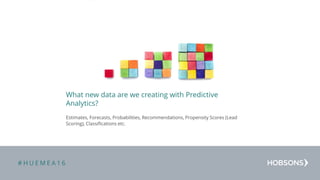

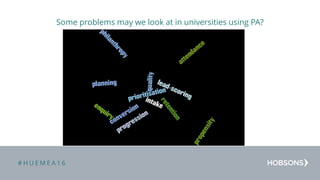
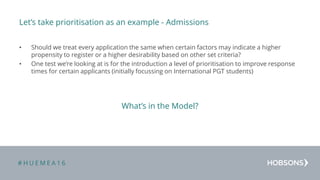


The document discusses predictive analytics and its application in marketing and recruitment strategies within educational institutions. It outlines a structured approach (CRISP-DM) for modeling using historical data to optimize admissions processes and improve conversion rates. Key methods and examples are given, highlighting how data can be leveraged to prioritize applications and enhance overall marketing efforts.


![Reporting External Training 2016 11.18.2016 [Autosaved]](https://cdn.slidesharecdn.com/ss_thumbnails/cc947194-6e7e-447a-8e1c-b32e79b86338-161227222534-thumbnail.jpg?width=640&height=640&fit=bounds)