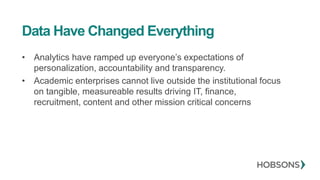
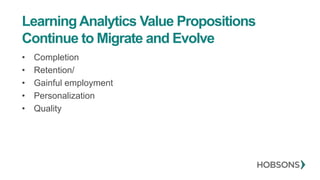
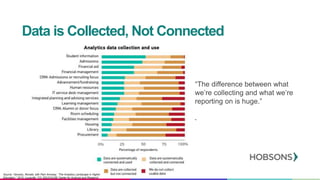
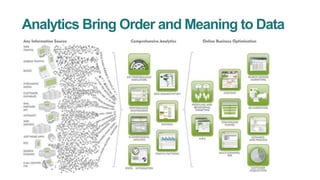
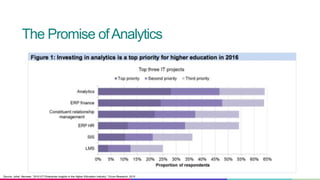
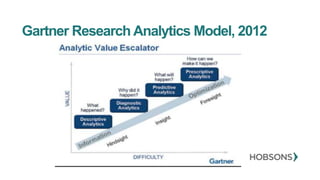
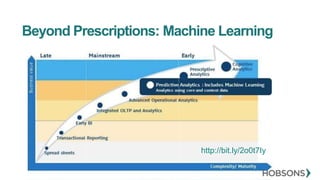
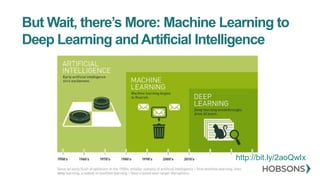
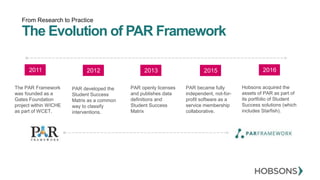
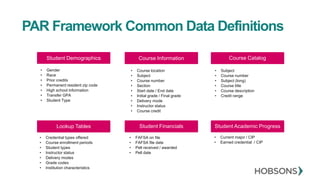
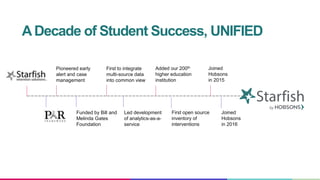
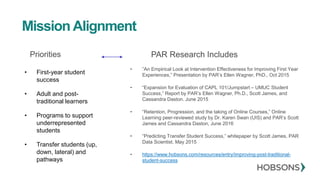
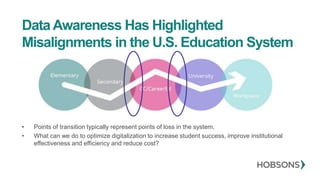
Student Success forAll: Common Data Definiti
at Work
Ellen D. Wagner, Ph.D
VP Research, Hobsons
Hae Okimoto, Ph.D.
Dir Academic Technologies
University of Hawaii
Our nation’s focus on student success has generated
multiple ways of measuring progress and completion. The
commonly defined, openly shared data definitions developed
by the PAR Framework give Hobsons’s customers the
opportunities for conducting research comparative
evaluation and sharing best practices that are valid, reliable
and generalizable for ALL students and the people working
to ensure their success.
Student Success forAll: Common Data
Definitions at Work
Source: Tyton Partners, “Driving Towards a Degree, The Evolution of Planning and Advising in Higher Education, Part i,” 2016.
AChanging Landscape
Data Have Changed Everything
• Analytics have ramped up everyone’s expectations of
personalization, accountability and transparency.
• Academic enterprises cannot live outside the institutional focus
on tangible, measureable results driving IT, finance,
recruitment, content and other mission critical concerns
Learning Analytics Value Propositions
Continue to Migrate and Evolve
• Completion
• Retention/
• Gainful employment
• Personalization
• Quality
“The difference between what
we’re collecting and what we’re
reporting on is huge.”
-
Source: Yanosky, Ronald, with Pam Arroway. “The Analytics Landscape in Higher
Education,” 2015. Louisville, CO: EDUCAUSE Center for Analysis and Research
Data is Collected, Not Connected
Analytics Bring Order and Meaning to Data
Source: Johal, Navneet, “2015 ICT Enterprise Insights in the Higher Education Industry,” Ovum Research, 2015
The Promise ofAnalytics
Gartner Research Analytics Model, 2012
http://bit.ly/2o0t7Iy
Beyond Prescriptions: Machine Learning
http://bit.ly/2aoQwIx
But Wait, there’s More: Machine Learning to
Deep Learning andArtificial Intelligence
From Research to Practice
The Evolution of PAR Framework
2011
The PAR Framework
was founded as a
Gates Foundation
project within WICHE
as part of WCET.
PAR openly licenses
and publishes data
definitions and
Student Success
Matrix
2012
PAR became fully
independent, not-for-
profit software as a
service membership
collaborative.
2015
Hobsons acquired the
assets of PAR as part of
its portfolio of Student
Success solutions (which
includes Starfish).
20162013
PAR developed the
Student Success
Matrix as a common
way to classify
interventions.
PAR Framework Research Questions
• Can predictive analytics find students at risk with the data we have
in hand?
• Can risk differences between and among student sub-populations
in an institution be discerned?
• Will students from anomalous institutions be discernable?
PAR Framework Common Data Definitions
Student Demographics
• Gender
• Race
• Prior credits
• Permanent resident zip code
• High school information
• Transfer GPA
• Student Type
Course CatalogCourse Information
Student Academic ProgressStudent FinancialsLookup Tables
• Course location
• Subject
• Course number
• Section
• Start date / End date
• Initial grade / Final grade
• Delivery mode
• Instructor status
• Course credit
• Subject
• Course number
• Subject (long)
• Course title
• Course description
• Credit range
• Credential types offered
• Course enrollment periods
• Student types
• Instructor status
• Delivery modes
• Grade codes
• Institution characteristics
• FAFSA on file
• FAFSA file date
• Pell received / awarded
• Pell date
• Current major / CIP
• Earned credential / CIP
Pioneered early
alert and case
management
First to integrate
multi-source data
into common view
Added our 200th
higher education
institution
Joined
Hobsons
in 2015
Funded by Bill and
Melinda Gates
Foundation
Led development
of analytics-as-a-
service
First open source
inventory of
interventions
Joined
Hobsons
in 2016
ADecade of Student Success, UNIFIED
Priorities
• First-year student
success
• Adult and post-
traditional learners
• Programs to support
underrepresented
students
• Transfer students (up,
down, lateral) and
pathways
PAR Research Includes
• ”An Empirical Look at Intervention Effectiveness for Improving First Year
Experiences,” Presentation by PAR’s Ellen Wagner, PhD., Oct 2015
• “Expansion for Evaluation of CAPL 101/Jumpstart – UMUC Student
Success,” Report by PAR’s Ellen Wagner, Ph.D., Scott James, and
Cassandra Daston. June 2015
• “Retention, Progression, and the taking of Online Courses,” Online
Learning peer-reviewed study by Dr. Karen Swan (UIS) and PAR’s Scott
James and Cassandra Daston, June 2016
• “Predicting Transfer Student Success,” whitepaper by Scott James, PAR
Data Scientist. May 2015
• https://www.hobsons.com/resources/entry/improving-post-traditional-
student-success
Mission Alignment
DataAwareness Has Highlighted
Misalignments in the U.S. Education System
• Points of transition typically represent points of loss in the system.
• What can we do to optimize digitalization to increase student success, improve institutional
effectiveness and efficiency and reduce cost?
Hae Okimoto, Ph.D.
Interim VP, Student Affairs
Director, Academic Technologies
University of Hawaii System: On
Becoming a Data-Empowered System
University of Hawaii System
“55% of Hawai‘i’s working age adults to have a 2- or 4-
year college degree by the year 2025.”
43% 42%
44%
0%
55%
2007 2011 2015 2019 2022 2025
%ofPopulationw/
Degree
Current Trend
GOAL
Cumulative
Degree Gap:
42,932 degree holders
Source: UH Institutional Research and Analysis Office, NCHEMS, & U.S. Census Bureau,
American Community Survey, 1-year estimates, 2006 to 2012
}
HGIStrategic Direction Measures-2016
Degrees &
Certificates
Earned
Grad Rates
4-YR
Grad &
Success
Rates 6-Yr or
150% CC
Enrollment
to Degree
Gap – NH
Enrollment
to Degree
Gap – Pell
STEM
Degrees &
Certificates
Awarded
UH Mānoa
UH Hilo
UH West
O‘ahu
Hawai‘i CC
Honolulu CC
Kapi‘olani CC
Kaua‘i CC
Leeward CC
Maui College
Windward CC
Met or Exceeded Goal Within 0.3% of Goal for “Enrollment to Degree Gap” measure. Met or exceeded baseline for other measures.Did Not Meet Goal
http://blog.hawaii.edu/hawaiigradinitiative/strategic-priorities/
PAR Student Watch List
Honolulu Community College – Associate in Science
Selected Students
Home Campus: Honolulu Community College
Program: HON-Natural Sciences
Pre-Major: Pre-Medicine
PAR Level 1
PAR Factors: #1 Associates student, #2 Enter with no prior credits, #3 Low cred...
1
COMPASS Reading: 27
Semester Entered: Fall 2014
Registered for: 13 Credits at any UH institution Spring 2016
Registered for: 12 Credits at any UH institution Fall 2015
High School: Central High School 5/2014
Registered for: 15 Credits at any UH institution Fall 2016
Applications: 201510 Applicant Accepted at Honolulu, 201510 Accepted at Leeward
ORG_MEMBERSHIP: HON-ALL-STUDENTS-FA2015, HON-FINANCIALAID-FA2015…
COMPASS Math: 28
Career Interest: Health Science (medicine, dentistry, pharmacy, nursing, physical t….
Immediate Ed Goal: Take courses to transfer to another college
Highest Ed Goal: Earn a Medical Degree
Highest Ed Goal Institution: University of Hawaii Manoa
GPS
60%
64%
35%
0% 50% 100%
Corequisite Remediation
StudentsCompletingwith%Corbetter
ENG 22 + ENG 100
ENG 100/100S
ENG 19 +ENG 22 + ENG 100
ENG 100/100T 56%
27%
82%
27%
0% 50% 100%
MATH 22 + MATH 82
(Consecutive Semesters)
MATH 82
(4 credits)
MATH 75
(1 Semester)
75%
29%
70%
29%
0% 50% 100%
MATH 82 + MATH 100*
(Earned “C” or better 2nd
Semester)
MATH 103/88
(1 Semester)
MATH 100/78
(1 Semester)
CollegeMathTrackCollegeAlgebraTrack
MATH 22 + MATH 82
(Consecutive Semesters)
MATH 82 + MATH 103
(Earned “C” or better 2nd
Semester)
* Transfer level courses MATH 100 / 111 / 115
2+ levels below transfer level 1 level below transfer level
Honolulu Community College Leeward Community College
25%
21%
28%
17%
25%
34%
19%
28%
37%
22%
31%
38%
23%
0%
10%
20%
30%
40%
50%
Total ≥15 Credits <15 Credits
2009 2010 2011 2012
UHMānoa4-YearGraduationRatesof
First-TimeFreshmenCohorts,2009-12
GraduationYears2013-16
The Right 1515 to Finish
Action
is Imperative
Evidence
is Essential
Connections
are Critical
Time
is Valuable
Our Four Principles
Good data can
challenge and validate
your assumptions, and
catalyse innovation.
Knowledge is only the
beginning. You need to
turn data into action to
help all students.
To support students
effectively at scale, you
need to work together,
across functional groups.
Your students need your
best help now. You must
act both quickly and
strategically.
“This work has allowed us to
eliminate the duplication of services
by multiple departments and
streamline our programming to offer
first class interventions to our
student population.
Michelle Wiley, Student Support
Specialist, Penn State World
Campus
Evidence is Essential
“In order to achieve the
goals in our strategic plan,
it’s absolutely essential that
we approach student
success in a holistic way,
with good data to drive
decisions.
Mark Askren, CIO,
University of Nebraska -
Lincoln
Evidence is Essential
“We can’t just throw data at
faculty and expect them to
embrace it – and understand it –
unless they realize that there’s a
problem they’re trying to solve.”
Larry Dugan, Director of
Instructional Technologies,
Monroe Community College
(SUNY)
Connections are Critical
Source: Jankowski, Natasha A, “Unpacking Relationships: Instruction and Student Outcomes.” American Council on Education, 2017
Action is Imperative
“I believe that as an institution of
higher education, we have a
moral obligation to offer all that is
possible to assist with a student’s
success. “
Dr. Francis L. Battisti, Executive
Vice President and Chief
Academic Officer, SUNY Broome
Community College
Discussion and Questions
Thank you for joining us!

Common Data Definitions

  • 1.
    Student Success forAll:Common Data Definiti at Work Ellen D. Wagner, Ph.D VP Research, Hobsons Hae Okimoto, Ph.D. Dir Academic Technologies University of Hawaii
  • 2.
    Our nation’s focuson student success has generated multiple ways of measuring progress and completion. The commonly defined, openly shared data definitions developed by the PAR Framework give Hobsons’s customers the opportunities for conducting research comparative evaluation and sharing best practices that are valid, reliable and generalizable for ALL students and the people working to ensure their success. Student Success forAll: Common Data Definitions at Work
  • 3.
    Source: Tyton Partners,“Driving Towards a Degree, The Evolution of Planning and Advising in Higher Education, Part i,” 2016. AChanging Landscape
  • 4.
    Data Have ChangedEverything • Analytics have ramped up everyone’s expectations of personalization, accountability and transparency. • Academic enterprises cannot live outside the institutional focus on tangible, measureable results driving IT, finance, recruitment, content and other mission critical concerns
  • 5.
    Learning Analytics ValuePropositions Continue to Migrate and Evolve • Completion • Retention/ • Gainful employment • Personalization • Quality
  • 6.
    “The difference betweenwhat we’re collecting and what we’re reporting on is huge.” - Source: Yanosky, Ronald, with Pam Arroway. “The Analytics Landscape in Higher Education,” 2015. Louisville, CO: EDUCAUSE Center for Analysis and Research Data is Collected, Not Connected
  • 7.
    Analytics Bring Orderand Meaning to Data
  • 8.
    Source: Johal, Navneet,“2015 ICT Enterprise Insights in the Higher Education Industry,” Ovum Research, 2015 The Promise ofAnalytics
  • 9.
  • 10.
  • 11.
    http://bit.ly/2aoQwIx But Wait, there’sMore: Machine Learning to Deep Learning andArtificial Intelligence
  • 12.
    From Research toPractice The Evolution of PAR Framework 2011 The PAR Framework was founded as a Gates Foundation project within WICHE as part of WCET. PAR openly licenses and publishes data definitions and Student Success Matrix 2012 PAR became fully independent, not-for- profit software as a service membership collaborative. 2015 Hobsons acquired the assets of PAR as part of its portfolio of Student Success solutions (which includes Starfish). 20162013 PAR developed the Student Success Matrix as a common way to classify interventions.
  • 13.
    PAR Framework ResearchQuestions • Can predictive analytics find students at risk with the data we have in hand? • Can risk differences between and among student sub-populations in an institution be discerned? • Will students from anomalous institutions be discernable?
  • 14.
    PAR Framework CommonData Definitions Student Demographics • Gender • Race • Prior credits • Permanent resident zip code • High school information • Transfer GPA • Student Type Course CatalogCourse Information Student Academic ProgressStudent FinancialsLookup Tables • Course location • Subject • Course number • Section • Start date / End date • Initial grade / Final grade • Delivery mode • Instructor status • Course credit • Subject • Course number • Subject (long) • Course title • Course description • Credit range • Credential types offered • Course enrollment periods • Student types • Instructor status • Delivery modes • Grade codes • Institution characteristics • FAFSA on file • FAFSA file date • Pell received / awarded • Pell date • Current major / CIP • Earned credential / CIP
  • 15.
    Pioneered early alert andcase management First to integrate multi-source data into common view Added our 200th higher education institution Joined Hobsons in 2015 Funded by Bill and Melinda Gates Foundation Led development of analytics-as-a- service First open source inventory of interventions Joined Hobsons in 2016 ADecade of Student Success, UNIFIED
  • 16.
    Priorities • First-year student success •Adult and post- traditional learners • Programs to support underrepresented students • Transfer students (up, down, lateral) and pathways PAR Research Includes • ”An Empirical Look at Intervention Effectiveness for Improving First Year Experiences,” Presentation by PAR’s Ellen Wagner, PhD., Oct 2015 • “Expansion for Evaluation of CAPL 101/Jumpstart – UMUC Student Success,” Report by PAR’s Ellen Wagner, Ph.D., Scott James, and Cassandra Daston. June 2015 • “Retention, Progression, and the taking of Online Courses,” Online Learning peer-reviewed study by Dr. Karen Swan (UIS) and PAR’s Scott James and Cassandra Daston, June 2016 • “Predicting Transfer Student Success,” whitepaper by Scott James, PAR Data Scientist. May 2015 • https://www.hobsons.com/resources/entry/improving-post-traditional- student-success Mission Alignment
  • 17.
    DataAwareness Has Highlighted Misalignmentsin the U.S. Education System • Points of transition typically represent points of loss in the system. • What can we do to optimize digitalization to increase student success, improve institutional effectiveness and efficiency and reduce cost?
  • 18.
    Hae Okimoto, Ph.D. InterimVP, Student Affairs Director, Academic Technologies University of Hawaii System: On Becoming a Data-Empowered System
  • 19.
  • 20.
    “55% of Hawai‘i’sworking age adults to have a 2- or 4- year college degree by the year 2025.” 43% 42% 44% 0% 55% 2007 2011 2015 2019 2022 2025 %ofPopulationw/ Degree Current Trend GOAL Cumulative Degree Gap: 42,932 degree holders Source: UH Institutional Research and Analysis Office, NCHEMS, & U.S. Census Bureau, American Community Survey, 1-year estimates, 2006 to 2012 }
  • 21.
    HGIStrategic Direction Measures-2016 Degrees& Certificates Earned Grad Rates 4-YR Grad & Success Rates 6-Yr or 150% CC Enrollment to Degree Gap – NH Enrollment to Degree Gap – Pell STEM Degrees & Certificates Awarded UH Mānoa UH Hilo UH West O‘ahu Hawai‘i CC Honolulu CC Kapi‘olani CC Kaua‘i CC Leeward CC Maui College Windward CC Met or Exceeded Goal Within 0.3% of Goal for “Enrollment to Degree Gap” measure. Met or exceeded baseline for other measures.Did Not Meet Goal http://blog.hawaii.edu/hawaiigradinitiative/strategic-priorities/
  • 22.
    PAR Student WatchList Honolulu Community College – Associate in Science Selected Students
  • 23.
    Home Campus: HonoluluCommunity College Program: HON-Natural Sciences Pre-Major: Pre-Medicine PAR Level 1 PAR Factors: #1 Associates student, #2 Enter with no prior credits, #3 Low cred... 1 COMPASS Reading: 27 Semester Entered: Fall 2014 Registered for: 13 Credits at any UH institution Spring 2016 Registered for: 12 Credits at any UH institution Fall 2015 High School: Central High School 5/2014 Registered for: 15 Credits at any UH institution Fall 2016 Applications: 201510 Applicant Accepted at Honolulu, 201510 Accepted at Leeward ORG_MEMBERSHIP: HON-ALL-STUDENTS-FA2015, HON-FINANCIALAID-FA2015… COMPASS Math: 28 Career Interest: Health Science (medicine, dentistry, pharmacy, nursing, physical t…. Immediate Ed Goal: Take courses to transfer to another college Highest Ed Goal: Earn a Medical Degree Highest Ed Goal Institution: University of Hawaii Manoa
  • 24.
  • 25.
    60% 64% 35% 0% 50% 100% CorequisiteRemediation StudentsCompletingwith%Corbetter ENG 22 + ENG 100 ENG 100/100S ENG 19 +ENG 22 + ENG 100 ENG 100/100T 56% 27% 82% 27% 0% 50% 100% MATH 22 + MATH 82 (Consecutive Semesters) MATH 82 (4 credits) MATH 75 (1 Semester) 75% 29% 70% 29% 0% 50% 100% MATH 82 + MATH 100* (Earned “C” or better 2nd Semester) MATH 103/88 (1 Semester) MATH 100/78 (1 Semester) CollegeMathTrackCollegeAlgebraTrack MATH 22 + MATH 82 (Consecutive Semesters) MATH 82 + MATH 103 (Earned “C” or better 2nd Semester) * Transfer level courses MATH 100 / 111 / 115 2+ levels below transfer level 1 level below transfer level Honolulu Community College Leeward Community College 25%
  • 26.
    21% 28% 17% 25% 34% 19% 28% 37% 22% 31% 38% 23% 0% 10% 20% 30% 40% 50% Total ≥15 Credits<15 Credits 2009 2010 2011 2012 UHMānoa4-YearGraduationRatesof First-TimeFreshmenCohorts,2009-12 GraduationYears2013-16 The Right 1515 to Finish
  • 27.
    Action is Imperative Evidence is Essential Connections areCritical Time is Valuable Our Four Principles Good data can challenge and validate your assumptions, and catalyse innovation. Knowledge is only the beginning. You need to turn data into action to help all students. To support students effectively at scale, you need to work together, across functional groups. Your students need your best help now. You must act both quickly and strategically. “This work has allowed us to eliminate the duplication of services by multiple departments and streamline our programming to offer first class interventions to our student population. Michelle Wiley, Student Support Specialist, Penn State World Campus Evidence is Essential
  • 28.
    “In order toachieve the goals in our strategic plan, it’s absolutely essential that we approach student success in a holistic way, with good data to drive decisions. Mark Askren, CIO, University of Nebraska - Lincoln Evidence is Essential
  • 29.
    “We can’t justthrow data at faculty and expect them to embrace it – and understand it – unless they realize that there’s a problem they’re trying to solve.” Larry Dugan, Director of Instructional Technologies, Monroe Community College (SUNY) Connections are Critical Source: Jankowski, Natasha A, “Unpacking Relationships: Instruction and Student Outcomes.” American Council on Education, 2017
  • 30.
    Action is Imperative “Ibelieve that as an institution of higher education, we have a moral obligation to offer all that is possible to assist with a student’s success. “ Dr. Francis L. Battisti, Executive Vice President and Chief Academic Officer, SUNY Broome Community College
  • 31.
  • 32.
    Thank you forjoining us!

Editor's Notes

  • #4 And that’s why we’re seeing this – not just in 4YRPR, but all throughout higher education.
  • #7 For 2017, EDUCAUSE named data-informed decision-making and data management to its top 10 IT issues list. Data is collected, but it doesn’ty do what you want it to do. What do you want it to do??
  • #9 … but we’re collecting a TON of data, you say!!
  • #16 Key Objective: Establish credibility – Why should they even listen to us? Our history is strong. ----- So that’s why we’re in the same room together; necause you have some problems that need solving. Real problems, involving students, advisors, faculty, technology, funding, initiatives,…. And more. And that’s why I am really here. SHORT VERSION: Starfish was the first to bring student success solutions to now over 300 campuses in the US; we started back in 2008. PAR, another pioneer, was the first to bring student success analytics, they’ve been working with higher ed since 2011. So although this is an exciting new combination, neither one is a new solution. And those experiences have been working experiences. Our solutions are not just “what is the latest idea” but vetting, testing, validating, refining, constantly. Thought leadershup isn’t separate from tools for us – it is deeply embedded. That is how we got to be who we are, and that is why Hobsons had the brilliant idea of bringing us together. LONGER VERSION: I’m here talking about Starfish, of course. But the Starfish today has in interesting history. The original Starfish Retention Solutions was founded in 2008, before anyone at your college had titles like “VP of Student Success.” We worked with higher education institutions as partners to develop data integration methods to bring campus systems together. We built tools for outreach – early alerts, messages, meetings, Kudos - and basically focused on helping advisors approach their jobs with a student-centric viewpoint. We started seeing improved outcomes right away. Our work resonated with a lot of different types of institutions, who were trying to find ways to accommodate a changing population of students, overwhelmed advising staff, and increased state and federal pressure to produce quality graduates. While that was all going on, a group called the Predictive Analytics Reporting (PAR) Framework was formed in 2011out of an institution-driven research project. The project’s initial challenge was “Can we actually create a set of data definitions that all institutions could use for catalyzing conversations, measuring progress, and benchmarking against one another?” Once they were able to say YES (no small feat), the group stayed together to focus on research, developing rigorous models that tied student risk to established predictors, and helping other institutions manage student success data initiatives on their campuses. In 2015, Hobsons acquired Starfish and, in 2016, acquired PAR. The saying ”the whole is greater than the sum of its parts” has never been more true. Bringing PAR into the Starfish has given us our missing piece. Today, ”Starfish” means ALL of this <<wave at the whole timeline>>. Of course, being at Hobsons has other advantages. Hobsons is famous for its K12 college and career readiness solution, Naviance, and it’s higher ed CRM, Radius. All together, we are a pretty comprehensive suite of solutions for institutions with different needs. Starfish alone works with more than 350 institutions today – the Hobsons footprint in education is much much larger.
  • #21 Our strategic direction around the Hawaii Graduation Initiative If we are going to reach this goal – we have much to do
  • #23 The analysis goes down to the individual student level and identifies retention risk, GPA levels, credit ratio levels, and velocity or credits accumulated. Add starfish screen
  • #24 The PAR retention scores and contributing factors were put into the starfish overview page.
  • #25 Currently, we have two huge initiatives taking place. The first is moving our fifteen to finish campaign to the next step V2, the Right 15. To some degree, we have made course selection more automatic and registration easier. structurally improving how students register for courses in their program of study In the background – a program sheet that students were provided in the past in order to graduate In the foreground – a visual representation laid out for the full completion of the degree with required courses starred. Semester by semester Pathways have been developed for each major, and the student is offered those 15 credits as their default. Similar to a GPS – the ”path” to degree/certification is laid out and if students use personal choice to select something not in their path, they are alerted to it Includes multi-campus transfer pathways (formerly just first sem frosh at manoa) We know 15-to-finish works. This drives the right 15 without requiring advisers. Also helps decision makers know what courses will be required moving forward
  • #26 Our data showed that failure to complete gateway courses in M & E a significant negative impact on retention and success. After years of creating more and more developmental & remedial (basic math), trying one pilot after another – and not seeing results. CC leaderships began some serious discussions and research in Fall 2014, and the decision was made in Spring 2016 to move to a co-requisite model by Fall 2016. Policy change announced: 1 level below = college level + supplemental/co-requisite, etc (campus can decide). 2 level below = all developmental in 1 semester multiple measures for placement: ACT/SAT, Smarter Balance scores + senior yr course + specific grade; COMPASS/Accupacer [will use the students BEST] We have now completed the first semester. And the results are incredible. Showing our two best our campuses. Double and triple pass rates as compared to the past. But we are recognizing that the quick implementation, meant that we didn’t get everybody on-board. Even if we moved to multiple measures for placement, more than 60% of students were still placed with Compass (all we have for open door). And 55% of students took a lower level math class than their placement level.
  • #27 Due to our work with folks like PAR – thinking now about how PAR can help find the BEST 15 at the individual student level