Download as PDF, PPTX


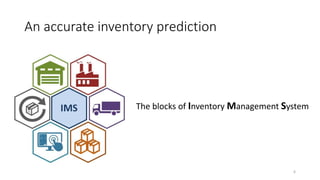
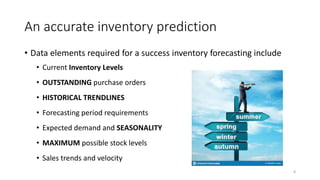
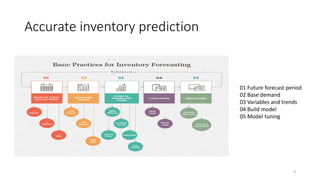
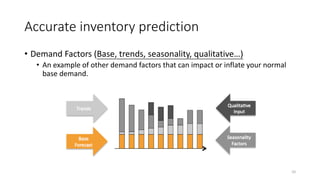
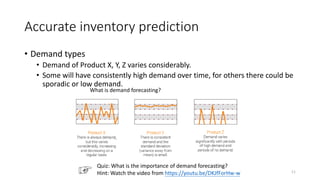

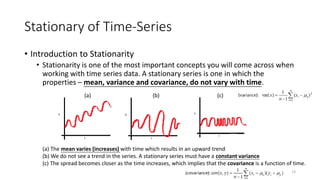
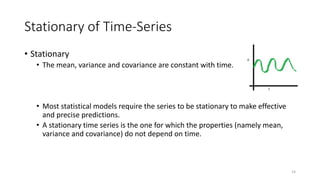

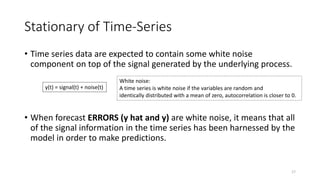
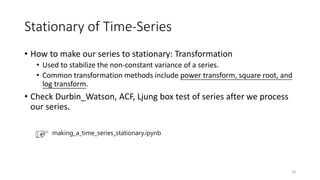
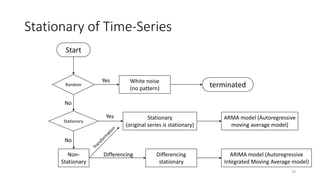
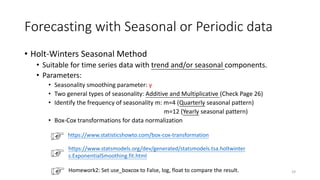
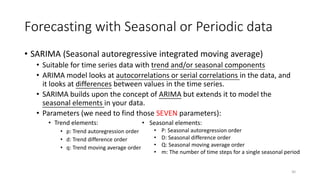
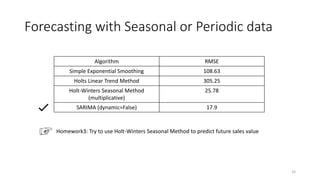
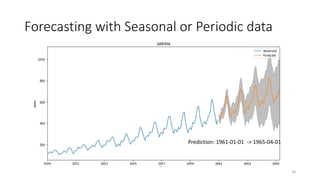

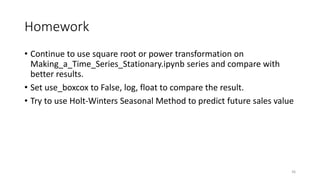

This document provides an overview of demand forecasting and inventory prediction techniques. It discusses the importance of accurate forecasting to ensure sufficient inventory levels. Key elements for successful forecasting include historical data on inventory levels, orders, trends, seasonality, and expected demand. Common forecasting models are explained, including simple exponential smoothing, Holt's linear trend method, and Holt-Winters seasonal method. The document also covers concepts like stationarity, differencing time series data to make it stationary, and using autoregressive integrated moving average (ARIMA) and seasonal ARIMA (SARIMA) models to forecast time series with trends or seasonal patterns. Homework is assigned to further experiment with transforming time series to achieve stationarity


![Getting Started with Apache Spark: Big Data Made Simple [Free Meetup]](https://cdn.slidesharecdn.com/ss_thumbnails/apachesparkgettingstarted-260203175547-8361bcc3-thumbnail.jpg?width=640&height=640&fit=bounds)


