SlideShare a Scribd company logo
1 of 15
Download to read offline
Page 1 of 15
LECTURE 6: POWER SYSTEM AUTOMATION
6.1 Introduction:
Power System Automation is one of the important aspects in an electrical power network that needs
careful investigation. In power system automation, data acquisition system plays a major role as a
base of the power system automation. From the recent trends and developments in Power System
Automation, Computerized system Automation is most efficient compared to normal systems.
Computerized Power Network for Data Acquisition system helps the system and controller to meter
and monitor the values for further manipulations for full-scale power system automation and system
controlling.
The Computerized Data Acquisition for Metering and Monitoring of Power System Automation can be
divided into three general categories as Data collection, Metering & Monitoring. The Data collection
system collects the data from the Power system Network using the Digital Power Monitors through the
current transformers and potential transformers. The collected data will be Metered by the Digital
Power Monitor where the Monitor consists of a Micro Controller with the peripherals like memory, A/D
converter and Sample and hold circuitry. According to the programming done in the Microcontroller
the Power Monitor will store the parameters in the memory and it will do all the logical and arithmetic
calculations to manipulate the parameters and to calculate the different Power data’s like KWH,
KVAR, KVA, PF etc,. The collected parameters of the Power System and the calculated power data
can be monitored on the screen of the Digital Power Monitor. The values will be sent to the Computer
System using the Communication system like Serial Communication RS485 and RS 232 for n no of
Power Monitors using the Data Converter.
This section describes power system automation protection and control which is aimed at the
improvement of the management of power networks is being adopted by increasing by number of
supply authorities. Automation, Protection, Local control, Operator interfaces, Communication,
Remote control and Monitoring functions, most of which were previously utilized with relays or
modules for each function, are now integrated into multi-function PLC (programmable logic Controller)
based units and interconnected on various types of local area networks. The components of the
system will have a better communication with each other sharing information through the local area
network and systems work similarly because one sensor is enough to collect one network information
and transferred the information through out the network using LAN and communication mediums
instead of one sensor per each component as before. To achieve we need a better system apart from
different systems like protection, Communication, RTU’s, IED’s etc. called as Data acquisition system
with out the perfect data communication system the components of the total system cant perform the
right tasks at right time because of the disturbance in the collected. To overcome this problem we
have designed a better Data Acquisition system with the efficient technology and with the perfect
communication systems to transfer the data. The system is named as “Computerized Power Network
Data Acquisition and Monitoring for Power System Automation”. The system acquires the data from
the power network (data acquisition) for monitoring. The software was developed to do all the
manipulations and the parameters and data of the system can be viewed in different forms (analog,
digital, graphical). The software developed will be used to view the captured data’s from the Power
Monitor in different forms like Analog Metering, Digital data and in graphical form. The software will
generate the reports for all the different types of manipulations like power fail, CT or PT fail Low PF
etc, the software will save the data 6 times per day in form of reports.
Page 2 of 15
6.2 BENEFITS OF POWER SYSTEM AUTOMATION
Important benefits of automation can be listed as follows
1. Improved quality of service and reduced manpower requirements
2. Improved reliability with reduced system implementation costs
3. Maintenance/expansion of customer base and Reduced operating costs
4. High value service provider and reduced maintenance costs
5. Added value services with the ability to defer capacity addition projects
6. Improved customer access to information and also improved information for engineering
decisions
7. Enterprise information accessibility along with improved information for planning decisions
8. Flexible Billing Options and reduced customer outage minutes
6.3 POWER SYSTEM AUTOMATION
Power System Automation is a system for managing, controlling and protecting the various
components connected to the power network. It obtains the real time information from the system,
local and remote control applications with advanced electrical system protection. The core of power
system automation stands on local intelligence, data communications with supervisory control and
monitoring.
Structure of Power System Automation
The functional structure of power system automation will be as shown in fig 6.1.
 Electrical Protection
 Control
 Measurement
 Monitoring
 Data Communications
Fig 6.1 Functional structure of Power System Automation
Electrical Protection
Electrical Protection is the most important concept of the Power system Automation, to protect the
equipment and personnel and to limit the damage at fault. It is a local function and it has the capability
to function independently from the Automation if necessary, although it is a part of Power system
Automation the function of electrical protection never restricted in Power system Automation.
Control
Page 3 of 15
Control application of a Power system Automation includes local and remote control. Local control
consists of actions the control device can logically take by it self (Bay interlocking, switching
sequences, and synchronizing check). Human intervention is limited and the risk was greatly reduced.
Remote control functions to control Substations remotely from the SCADA. Commands can be given
directly to the remote control devices (open and close of circuit breakers, relay settings, requests for
information from the SCADA station). This eliminates the personnel performance switching
operations, actions can be performed faster. A safe working environment is created for personnel and
the operator or engineer at the SCADA has a complete over view of the entire Power network.
Measurement
Measurement is one of important concept in Power system Automation. The real time information
about a substation or equipment is collected and displayed in the control center and stored in a data
base for further manipulations, It erases the personnel to go to substation or switching area collect the
information cutting down workloads. The information collected can assist in doing network studies like
load flow analysis, planning ahead and preventing disturbances in the Power network. Previously the
word ‘Measurement’ refer to voltage, current and frequency, and the word ‘Metering’ refer to power,
reactive power and energy (KWh). The different terms used because different instruments were used
for these applications, now the two functions are integrated in modern devices hence the terms are
used interchangeably in the text.
Monitoring
Monitoring is specified for the maintenance of the Power system Automation. It monitors sequence of
records, status and condition of the system, maintenance information and relay settings etc. The
information can help in fault analysis, what where when why it happened. It is used to improve the
efficiency of the system.
Data Communication
Normally Communication forms a core for any system, in Power system Automation Data
communication forms core of the power system Automation. With out communication the local device
and protection tasks can be performed individually. But with out data communication there is no
mean to say Power system Automation.
6.2 ARCHITECTURE FOR POWER SYSTEM AUTOMATION
Figure 6.2 shows the generalized architecture for Power System Automation. There are three levels
which are connected to each other through communication medium.
Page 4 of 15
Level 1: This level contains the field equipment and Switch gear, CTs, PTS, etc. Monitoring and
measurement of system parameters are carried out at this layer.
Level 2: This level contains the protection and control equipment. Protective relays, RTUS and IEDs
constitute this layer. The collected information for layer 1 is processed here.
Level 3: This level contains the Operator Display and Engineering Workstation for executing the
programs. This level is also called as the Energy Management Systems (EMS) Level or Layer, where
network analysis programs are run for operating the system
Power system automation is concerned mostly with levels 1 and 2. The RTUs and IEDs on receiving
information determine the tasks to be carried out for automation. The usual tasks in automation are
1) Switching (on or off) of Equipment like Capacitors, Reactors
2) Network Switching (on or off) or Reconfiguration of Transmission or distribution lines
3) Changing settings on equipment (Transformer on-load tap changing),
Fig 6.2. Architecture for Power System Automation
Page 5 of 15
6.3 Classification of Power system Automation
a) Substation Automation
b) Distribution Automation
Substation Automation
Substation automation is not a new concept. Substations have been equipped to perform automatic re
closing, bus sectionalizing, load transfers, capacitor switching, etc. for many years. In the past, these
and other functions were implemented using a combination of control panels, auxiliary relays,
switches, lights, meters, transducers and extensive wiring and cabling. In many applications today,
this perception is probably because developments in substation equipment have expanded the
potential capabilities of substation. Automation far beyond that which could previously be reasonably
accomplished. The principal development is generically defined as an Intelligent Electronic Device
(IED) which typically consists of one or more Programmable Logic Controllers and communications
ports; with the ability to transmit data and execute control commands, and frequently provide a local
user interface. Typical examples are relays, meters, and specialized sensors. Prior to the introduction
of Numerical relays, the protection and control of a very small substation consisting of one incoming
line, one transformer and two feeders would require four large panels filled with relays, switches and
lights. Only one panel is required when Numerical relays are used. Interestingly, at the same time the
space requirements are reduced by a factor of four, so the installed cost.
Advances in communications technology are used to tie everything together into a useful network.
Within the substation, a single high-speed Local Area Network (LAN) is used to transmit data and
control commands, replacing the extensive and costly cables that had been required. At the present
time, a number of different LAN techniques and protocols are in use. The industry is actively working
on development of a new standard LAN definition that will be based on the use of Ethernet and
Manufacturing Messaging Specification (MMS) and will be compatible with the Utility Communications
Architecture (UCA). There are already many techniques for moving data out of the substation to a
master station or to other substations. These include the use of leased or dedicated telephone lines,
dial-up phone lines, cellular telemetry techniques, satellite transmissions, various flavors of radio
techniques and fiber-optic networks. Basically, this variety of communications methods results in the
ability to transmit large amounts of information at a rapidly declining cost per bit. The combination of
PLC based devices and communications technology creates the ability to obtain more information
about the power system and the equipment being used. Power system variables include magnitude
and angle of voltages and currents, real and reactive power, frequency, power factors etc. Information
is available regarding the initiating event for relay operation, the location of faults, and fault analysis.
Specialized sensors and transducers are used to build a database relating to equipment condition and
use; so that analysis techniques can be used to determine equipment condition and base
maintenance activities on actual condition rather than time schedules. Within the substation, the use
of Programmable Logic Controllers or other types of computers opens up a vast array of automation
possibilities. Complex schemes for dead bus and dead line re-closing can be implemented, with the
sequence being based on actual power system conditions that exist at the time. Re-closing of circuits
can be modified based on cold load pickup requirements. Load transfers between busses and
transformers can be made to protect against transformer overloads. Bus voltages and power factors
can be tightly controlled to minimize losses or voltage variations. Supplementary measurements and
inputs can be used to initiate automatic equipment re energizing after a transformer or bus differential.
Distribution Automation
Distribution Automation systems have been defined as system that enable an electric utility to
monitor, coordinate and operate system components in a real time mode from remote locations the
Page 6 of 15
distribution automation is modular and may be implemented in phases to include remote monitoring
and control of substation, feeder and consumer devices and loads.
The goals of Distribution Automation are:
 Reduced costs
 Improve service reliability
 Better consumer service
 Enhance government relations

Distribution Automation system postulates are:
 Deferred capital expenditures
 Reduced operations and maintenance expenses
 Improved outage response and restoration
 Enhanced system efficiencies
 Enhanced consumer satisfaction
 Improved data information
 Positive public image

Distribution Automation system de postulates are:
 Prevent outages
 Alleviate the need for a sound maintenance program
 Replace good operation practices
 Eliminate the need for appropriate planning
As utility managers and engineers interested in effective approaches to increasing efficiency and
productivity the latest “high tech” developments must be continuously reviewed by the utility.
Increased competition has led large existing and potential commercial consumers to carefully
evaluate both the direct cost of electric service and the monetary value of reliable electric service.
These activities in conjunction with increased awareness by residential consumers of even the
shortest loss of electric service have resulted in increased emphasis by regulatory agencies in
qualifying the cost to consumers of outages. It is important to identify the costs and benefits of each
project including the value of improved reliability to the consumer.
1.4 Problem Description
The problem at hand is to develop a better Data Acquisition System. This involves the hardware and
the software used in a Data Acquisition system and Power System Automation. This paper focuses on
developing the hardware and software for the system. The software component can be considered
the soul of the data acquisition system as it is the very presence of software as the decision making
entity in the system that makes the system unique. All existing data acquisition systems had to
undergo hardware changes in order to change the settings or functional parameters. This involved the
tedious task of rewiring the existing system. The fact that data acquisition system makes the base of
the power system automation in all the causes of various applications and simple software to monitor
the total system with the acquired data makes the problem at hand simple. For instance, earlier, if the
data to be collected from the system or from the components of the system the controller or engineer
should go to the field with a large equipment and the time take for the collection of data will be very
high and where the data collected data is not accurate it will not matches with the calculated values
and the decision making for any thing is to difficult where the data what we have is not sufficient to do
some thing these are the problems exists in the previous data acquisition system.
Data acquisition refers to acquiring, or collecting, data. This data is collected in the form of measured
analog current or voltage values or the open or closed status of contact points. Acquired data can be
Page 7 of 15
used locally within the device collecting it, sent to another device in a substation, or sent from the
substation to one or several databases for use by operators, engineers, planners, and administration.
In order to overcome the situation digital technology has been adopted for the better data acquisition
system. The digital system will have a sampling rate where it samples each data collected from the
systems, takes the average of the data and gives the perfect accurate value of the system value
which can be useful to do any manipulations at the effective. The computerized power network uses
the PLC based Data Acquisition technology which collects the data from the Power system through
the sensors and transducers and sends the data to the PLC the system will manipulate the data and
sends the data to the human interface system. The controller will have the better understand on the
system situation and he can take perfect decision at right time. The Digital systems are programmable
so they have the capability to understand the situation of the system and they can take the pre
commanded decisions without the interference of the human, which increases the efficiency of the
total system.
Monitoring
The word monitoring in Data Acquisition means the over view of all the system. The acquisition
system will collect the data from the Power system network and store the online data in the main data
base, and it will be monitored at the controller section on the HMI. As the acquisition system is self
programmed the decisions can be made by the system also where normally the controller won’t have
that information. So the system monitoring will have the complete view on the total system means the
online system parameters, decisions taken by the system, time of system shutdown, switch on relay
trip fault location, type of fault, power drawn by the bus bars etc. where using this the controller can
say that what the system is doing at any particular time while he have the perfect command on the
total system
. Meter Placement
The placement of meters also plays a role in the Power system Automation and Data Acquisition
system. If the meters are placed as such with out any perfect survey some of the meters m ay be over
loaded and some of them may ideal so unnecessary things will arise in the system. The solution is to
have optimal placement of meters using the developed software for the optimal placement of meters
we can find out where the meters to be placed from the n number of nodes where the system will
have the better working part and cost effective.
1.5 IMPLEMENTATION OF POWER SYSTEM AUTOMATION AND PROTECTION USING SCADA
The Computerized power network data Acquisition and monitoring for Power system Automation have
been implemented using part of software and hardware. The hardware involves different type of
digital, communication equipment with a Computing system. The software involves the data collection
and monitoring software with the AMP (Automatic Meter Placement).
5.1. Hardware Development
The Computerized Power Network for Data Acquisition Metering & Monitoring System for Power
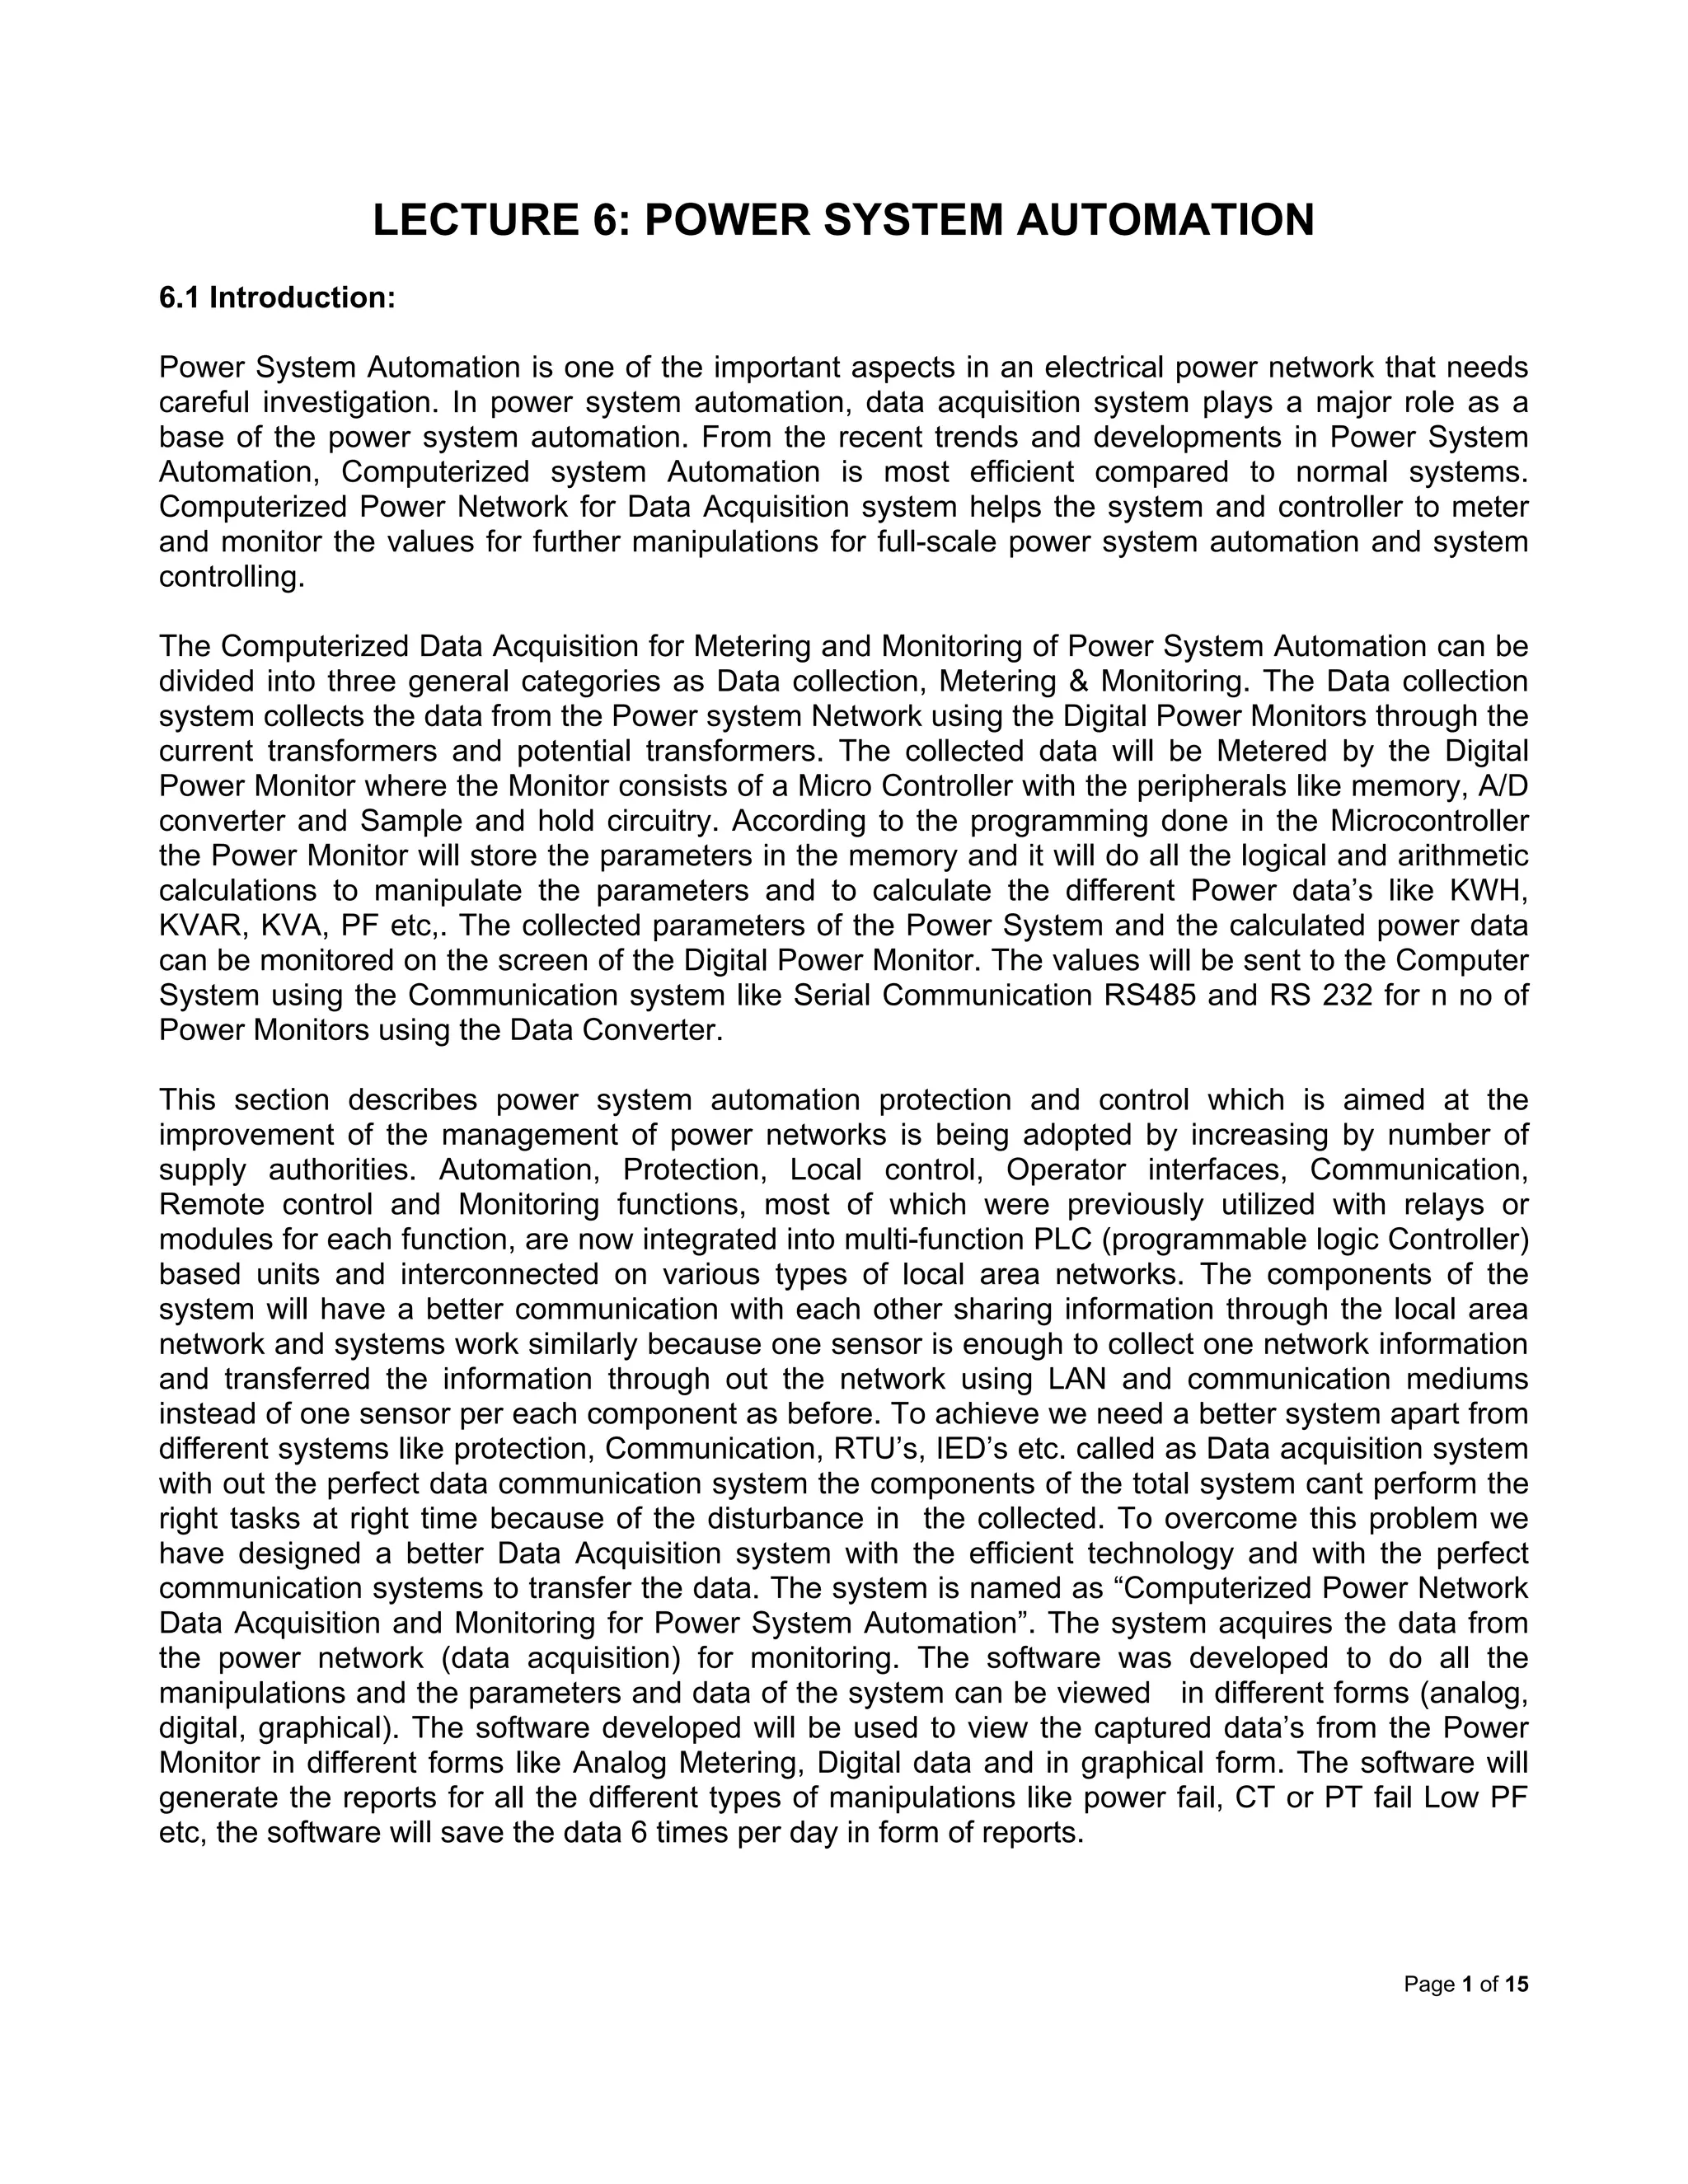
System Automation have been adopted to a small proto type substation model as shown in fig.6.3a
and fig 6.3b. The details of Data Acquisition Metering & Monitoring System are shown in fig.6.4a and
fig 6.4b. The Power Monitors were connected at the Generation and Distribution end. The data will be
collected by the system using the Data Converter and the RS 485 and RS 232 serial Communication
systems.
Page 8 of 15
Main Source Reserve Source
IS1IS2
PT1
PT2
CT1 CT2
CT4
CT5 CT6
MHTBB RHTBB
CT3
CB1
CB2
CB3
CB4
CB5 CB6
HTBB
LTBB
TRANSFORMER
LOAD 1 LOAD 2
Main Source Reserve Source
IS1IS2
PT1
PT2
CT1 CT2
CT4
CT5 CT6
MHTBB RHTBB
CT3
CB1
CB2
CB3
CB4
CB5 CB6
HTBB
LTBB
TRANSFORMER
LOAD 1 LOAD 2
Fig 6.3(a). 33/11 KV Substation Fig. 6.3(b). 33/11 KV Proto type Substation
The selected 33/11 KV substation single line diagram. In the Computerized Power Network for a scale
down Substation model, the Power monitors were connected at the 33KV Bus Bar and at 11KV Bus
Bar. The two meters were connected to the Data Converter through RS485 Connectors and the Data
converter is connected to the Computing system through RS232 connector the RS232 and RS485 are
the two types of different Serial Communication Systems used in the Power Network
Fig. 6.4(a) Data Acquisition System For SCADA Model Fig. 6.4(b) Data Acquisition System For SCADA Model
The Power Monitors will collect the data from the Power Network and the data will be manipulated
and different power system data’s will be calculated the data can be viewed on the LCD display of the
Power Monitor. The data will be sent to the Computing system through the Data converter and
RS485, RS232 two way Communication systems.
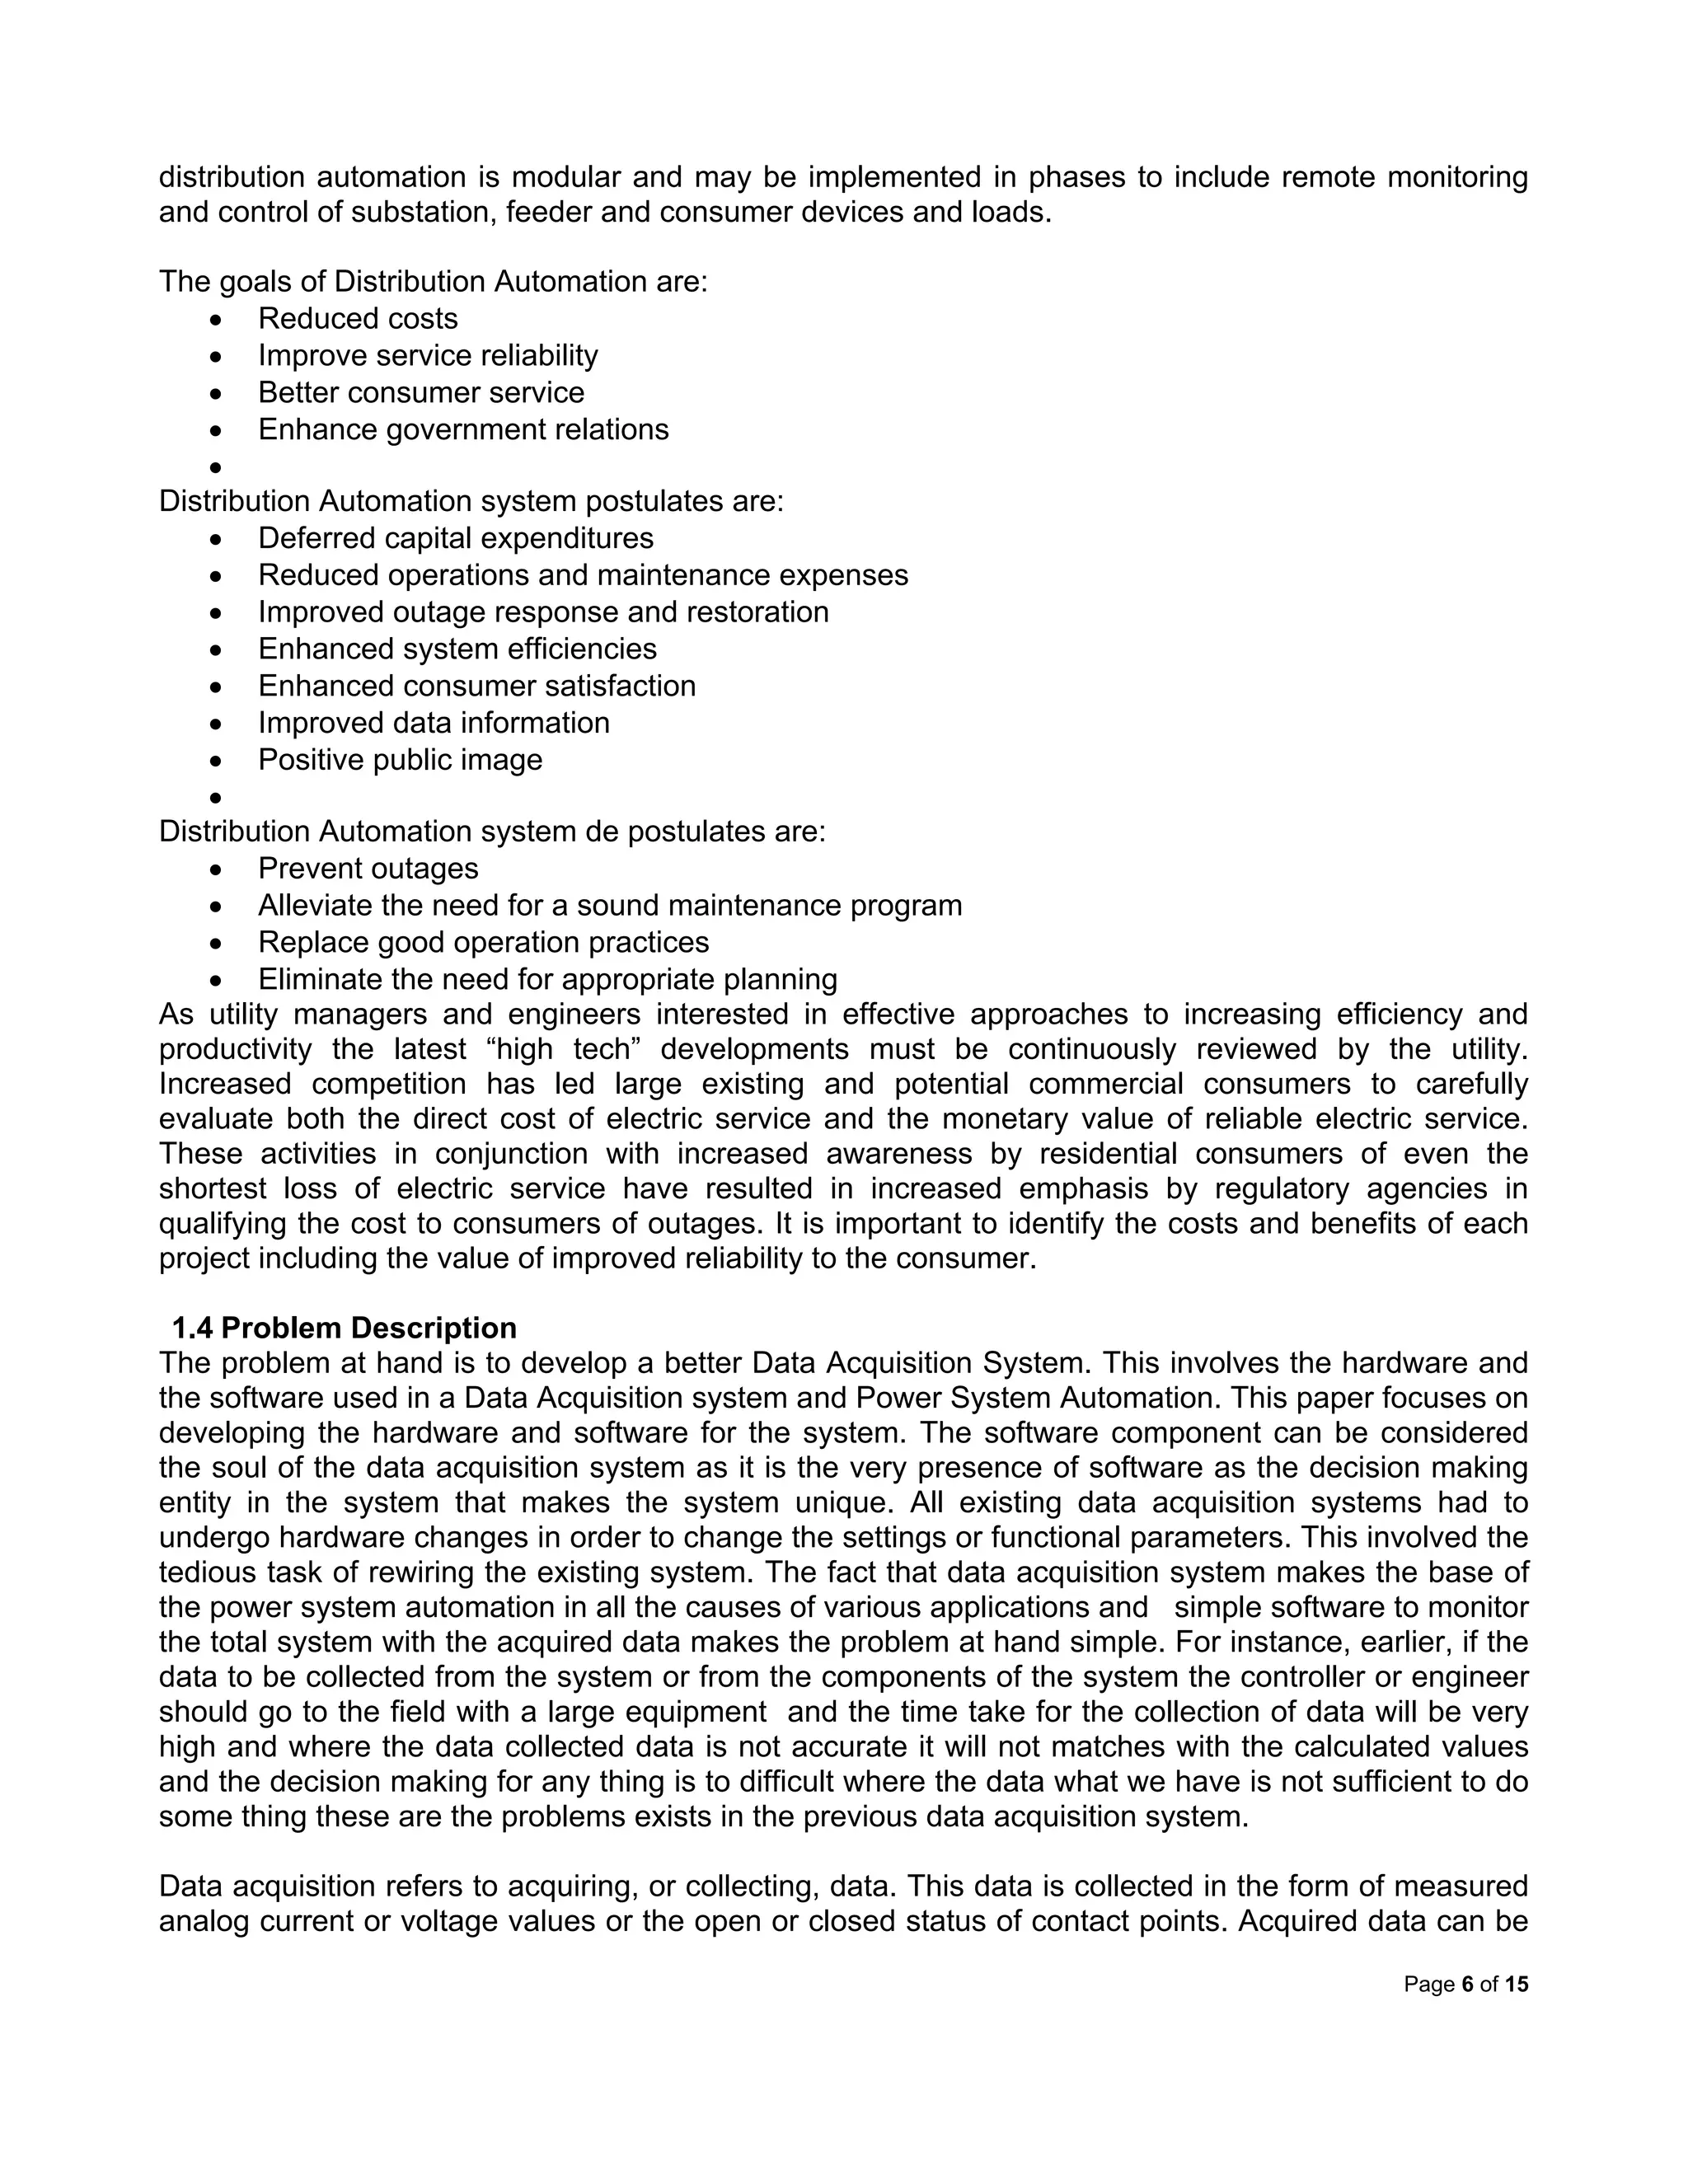
The simplified model for the Computerized Data Acquisition is shown in fig 6.5a. A simplified model
corresponding to figure 6.3a was developed in hardware and information for CT and PT were
Page 9 of 15
collected and sent tp the computer for processing. Fig 6.5b shows the digital meter which transmit
and receive information from the hardware model to the computer and vice versa
Fig .6.5(a) Schematic of Hardware Setup Fig .6.6(b) Monitoring and metering interface.
5.2. Software Programming
The Software is developed using Visual Basic and the Micro Soft access is used as the data base for
the software. The software consists of two parts one is automatic meter placement AMP and the
second one is Data Acquisition. Using the Data Acquisition software we can do all the manipulations,
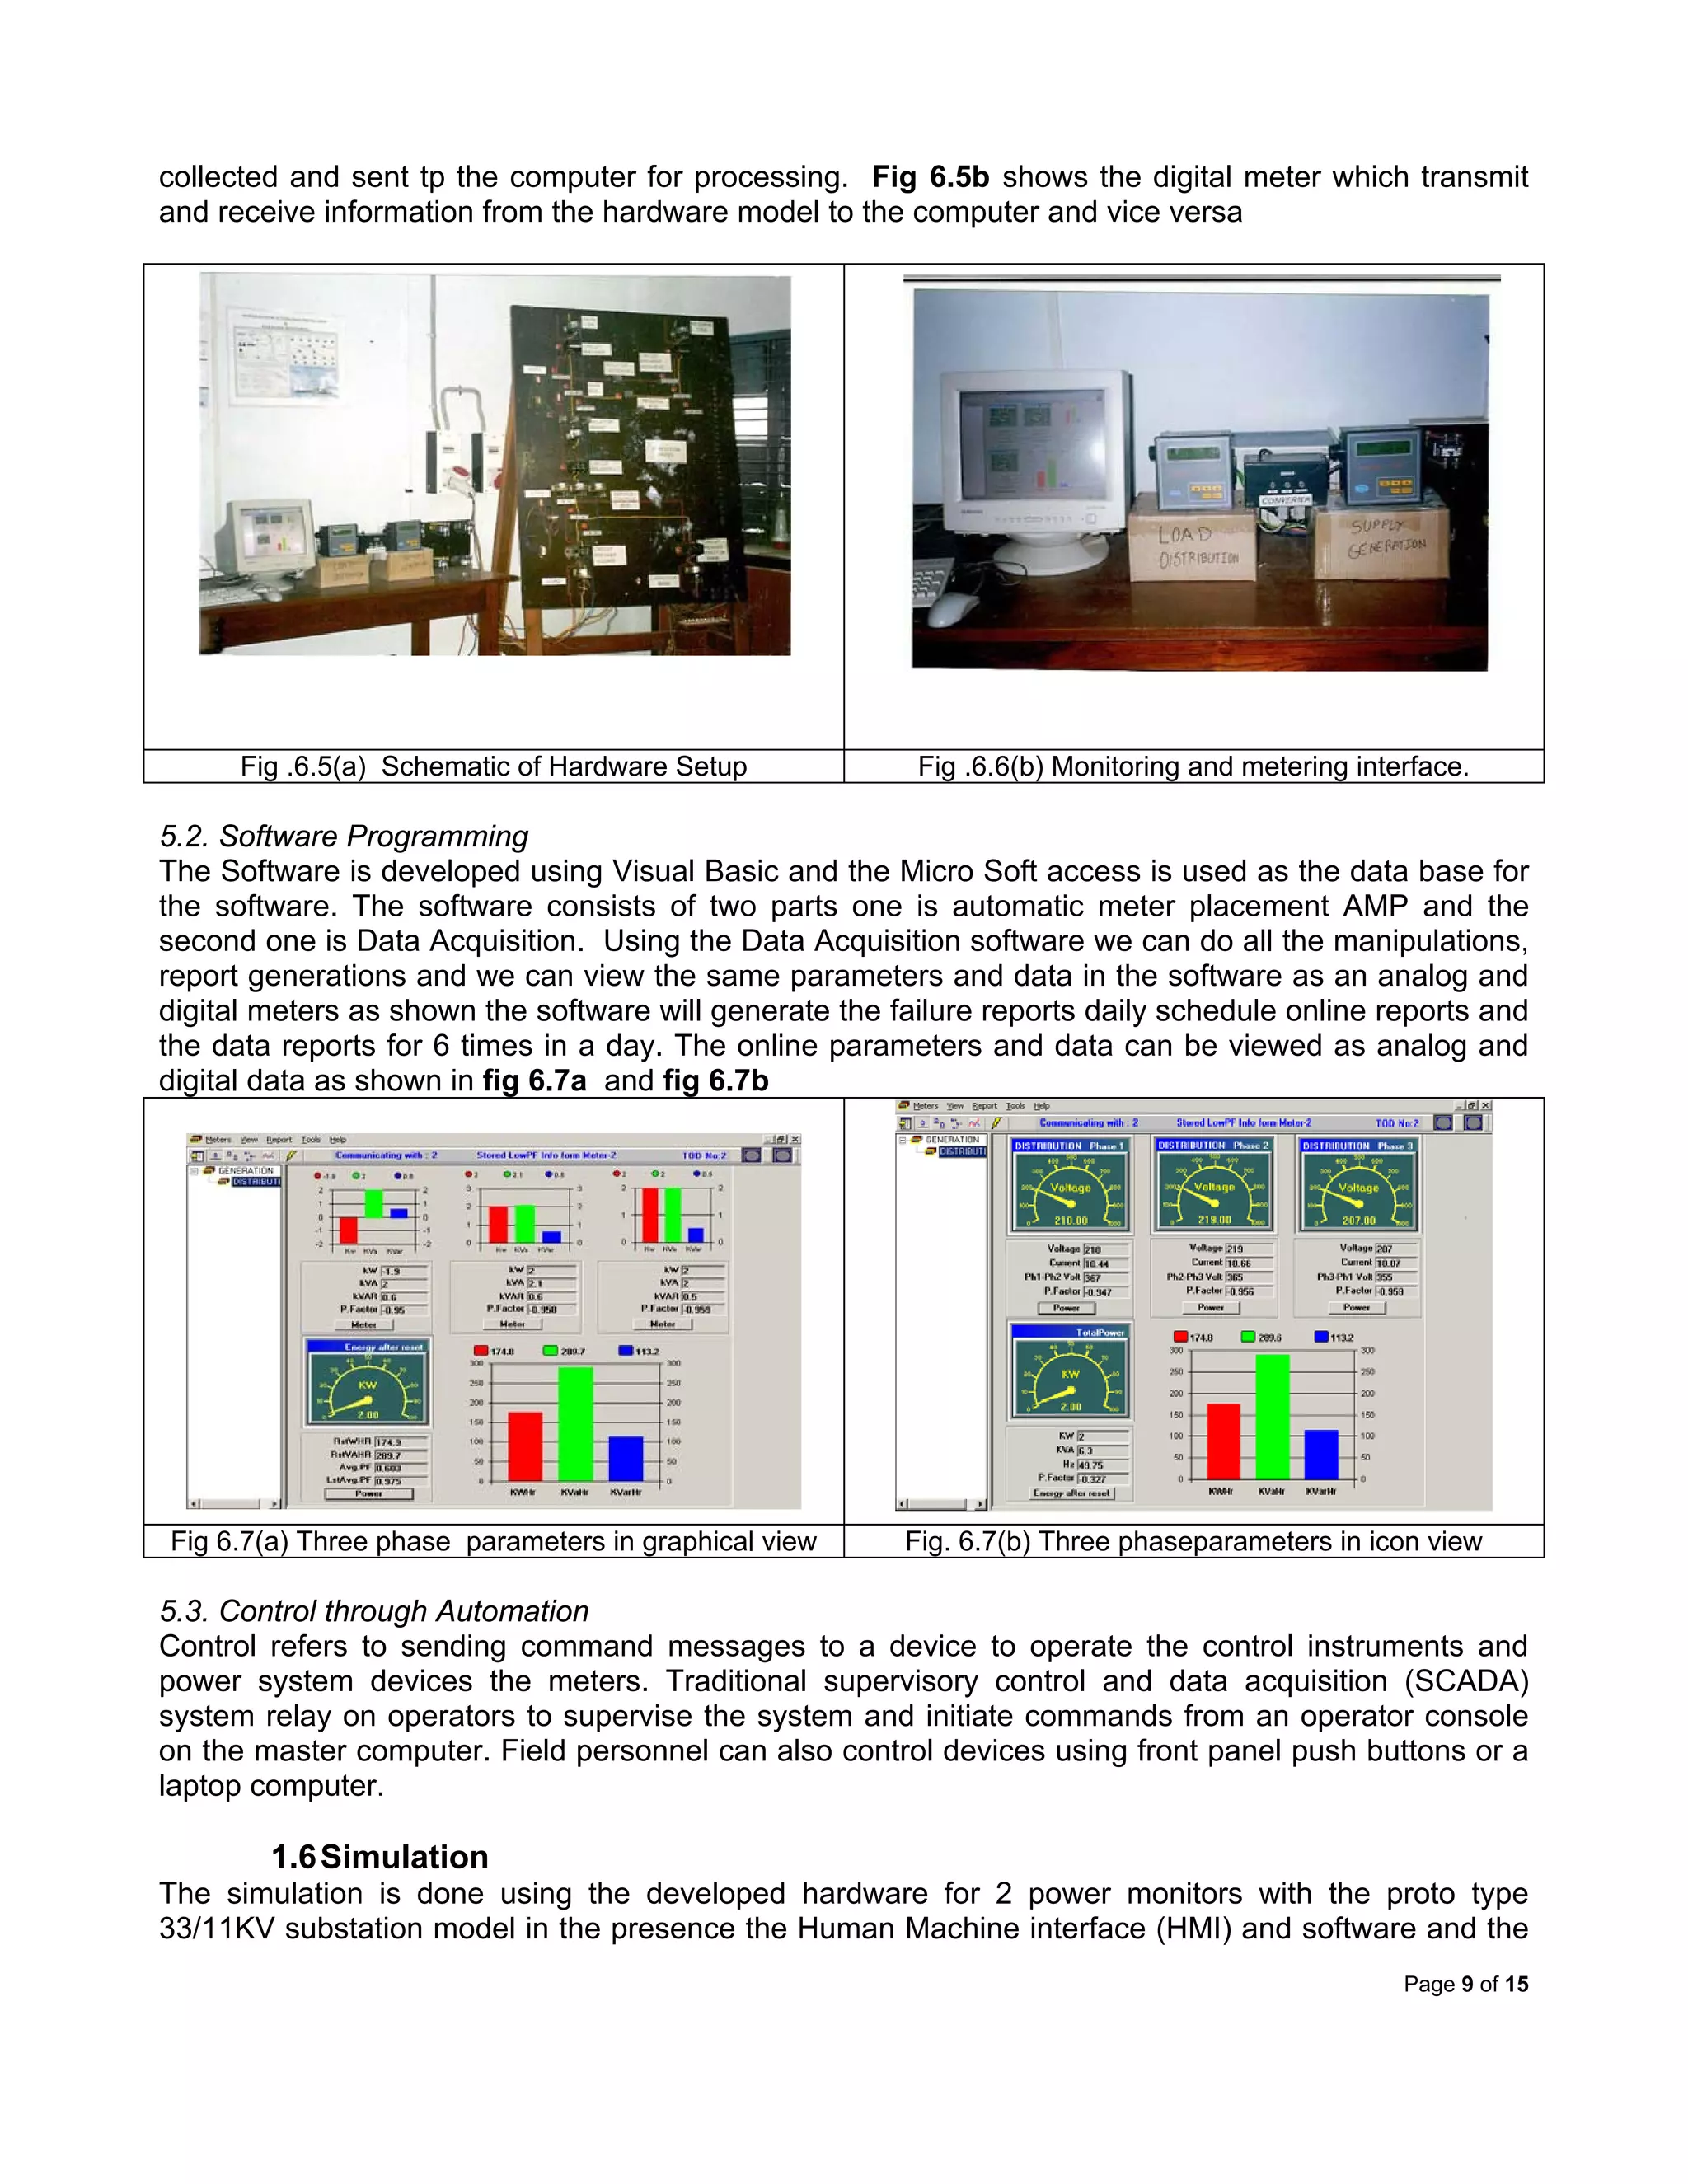
report generations and we can view the same parameters and data in the software as an analog and
digital meters as shown the software will generate the failure reports daily schedule online reports and
the data reports for 6 times in a day. The online parameters and data can be viewed as analog and
digital data as shown in fig 6.7a and fig 6.7b
Fig 6.7(a) Three phase parameters in graphical view Fig. 6.7(b) Three phaseparameters in icon view
5.3. Control through Automation
Control refers to sending command messages to a device to operate the control instruments and
power system devices the meters. Traditional supervisory control and data acquisition (SCADA)
system relay on operators to supervise the system and initiate commands from an operator console
on the master computer. Field personnel can also control devices using front panel push buttons or a
laptop computer.
1.6Simulation
The simulation is done using the developed hardware for 2 power monitors with the proto type
33/11KV substation model in the presence the Human Machine interface (HMI) and software and the
Page 10 of 15
different outputs have been verified and generated for the implementation and simulation studies like
report generation, power factor control and relay coordination etc.
6.1. Report Generation
The software will save the online data as a text file in the form of report for further reference, the
software will generate daily reports at 6 different timing in a day to plot the load curve and etc,. Fig
6.8(a) and 6.8(b) show the graphical view and on line reports by the software. The online parameters
and data can be viewed as a comparison chart. The online parameters can be viewed as a graphical
representation for different parameters as three phase parameters line parameters power factor
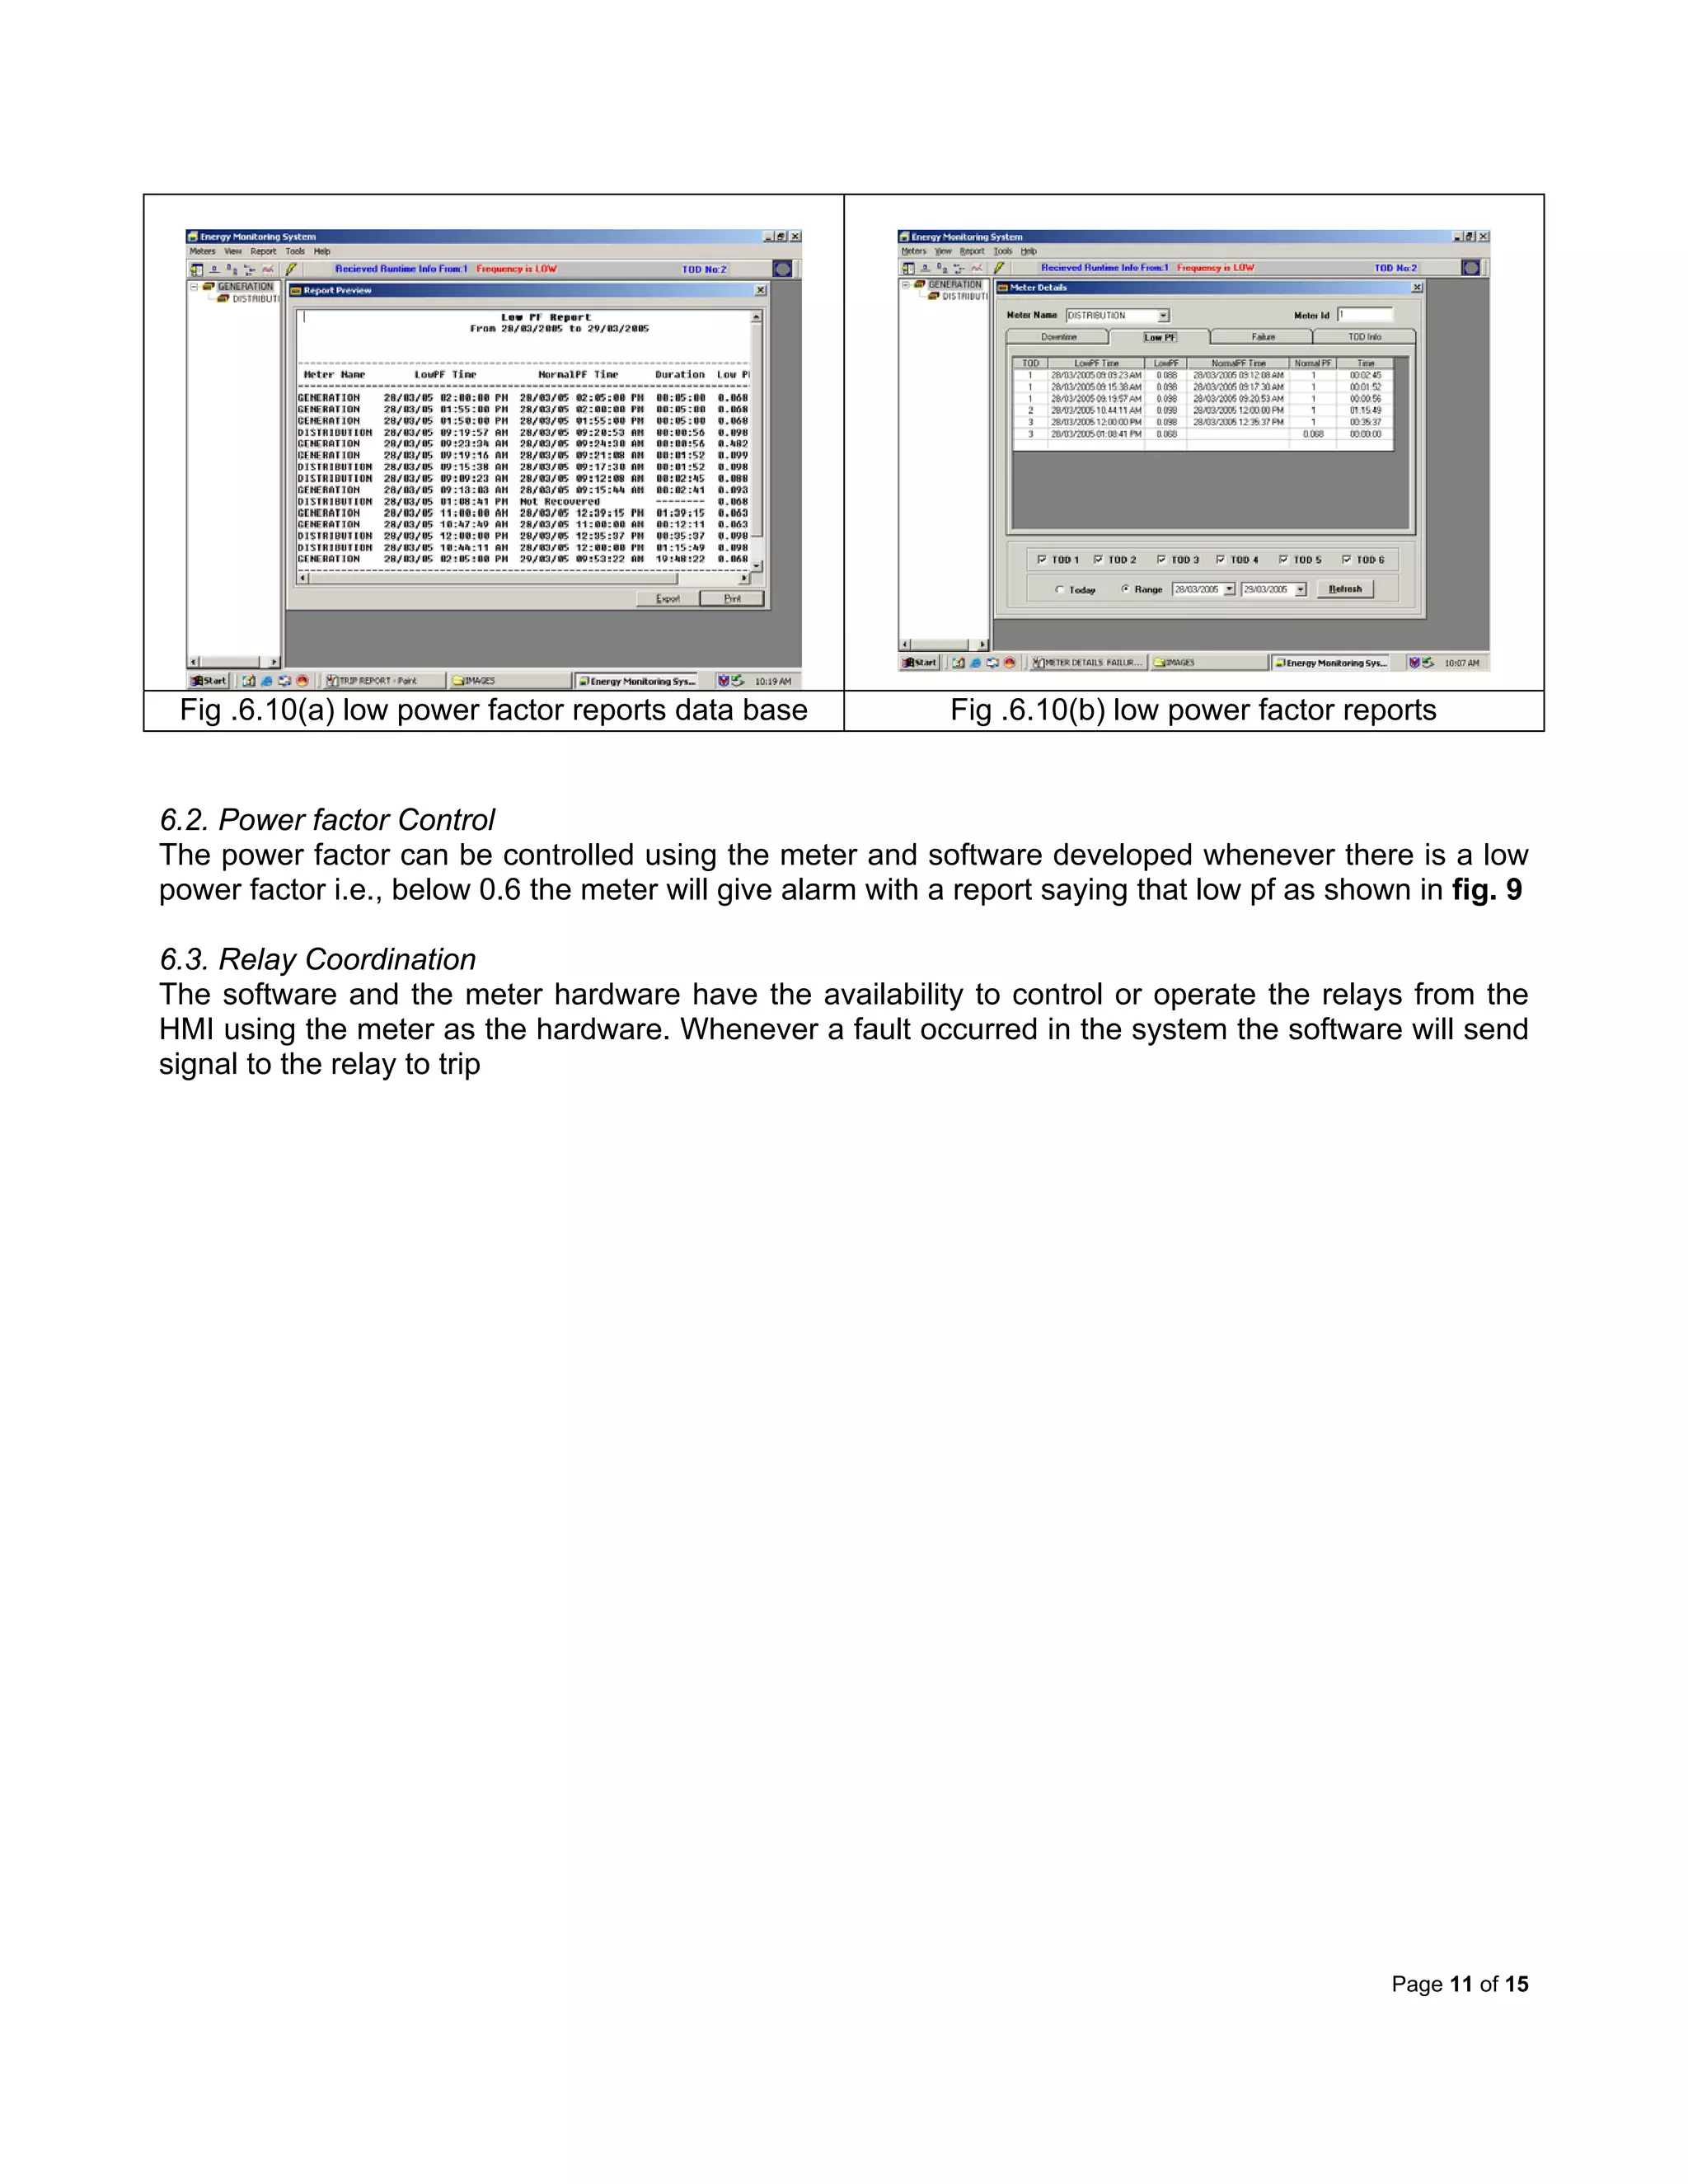
power KWH, KVA, KVAR. It will give the report generation in different forms for different fault
conditions or any abnormal conditions. Failure reports like online reports, power fail, CT fail, PT fail
and Low PF can be viewed as shown in fig 6.9a and 6.9b
Fig 6.8(a) Three phase currents in graphical view Fig 6.8(b) Online reports
Fig 6.9(a) Failure reports data base Fig 6.9(b) Failure reports
Page 11 of 15
Fig .6.10(a) low power factor reports data base Fig .6.10(b) low power factor reports
6.2. Power factor Control
The power factor can be controlled using the meter and software developed whenever there is a low
power factor i.e., below 0.6 the meter will give alarm with a report saying that low pf as shown in fig. 9
6.3. Relay Coordination
The software and the meter hardware have the availability to control or operate the relays from the
HMI using the meter as the hardware. Whenever a fault occurred in the system the software will send
signal to the relay to trip
Page 12 of 15
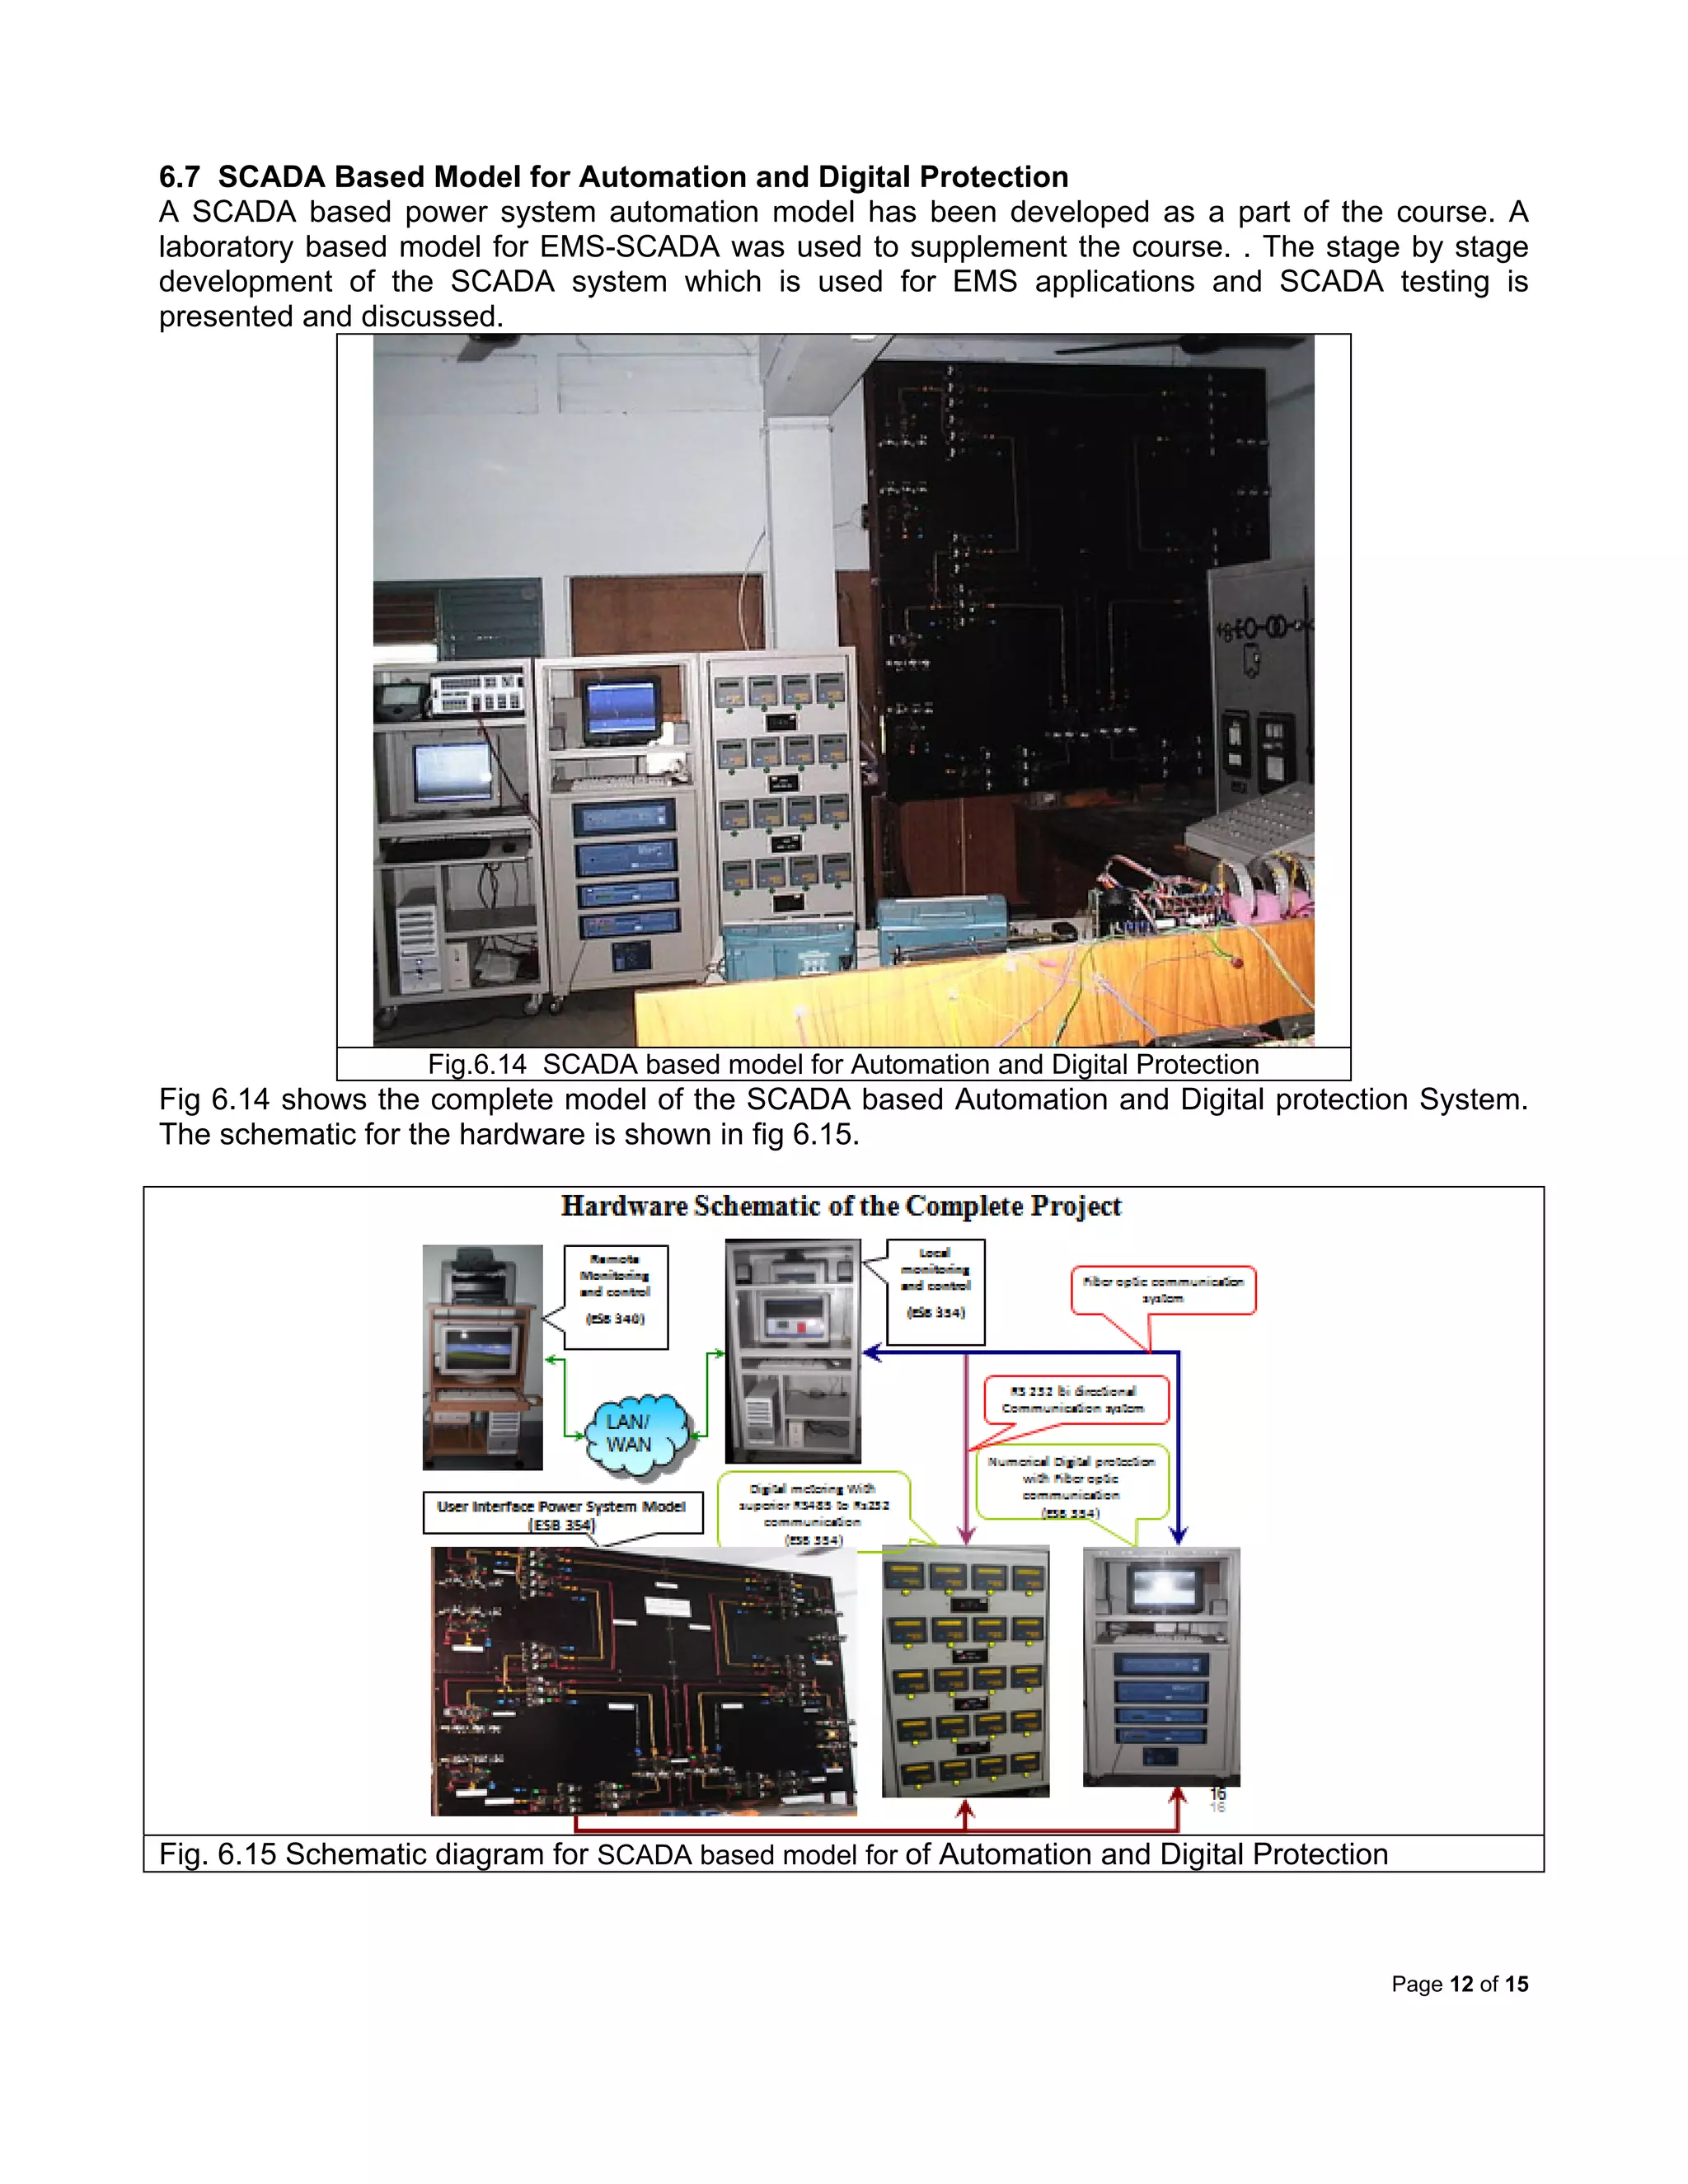
6.7 SCADA Based Model for Automation and Digital Protection
A SCADA based power system automation model has been developed as a part of the course. A
laboratory based model for EMS-SCADA was used to supplement the course. . The stage by stage
development of the SCADA system which is used for EMS applications and SCADA testing is
presented and discussed.
Fig.6.14 SCADA based model for Automation and Digital Protection
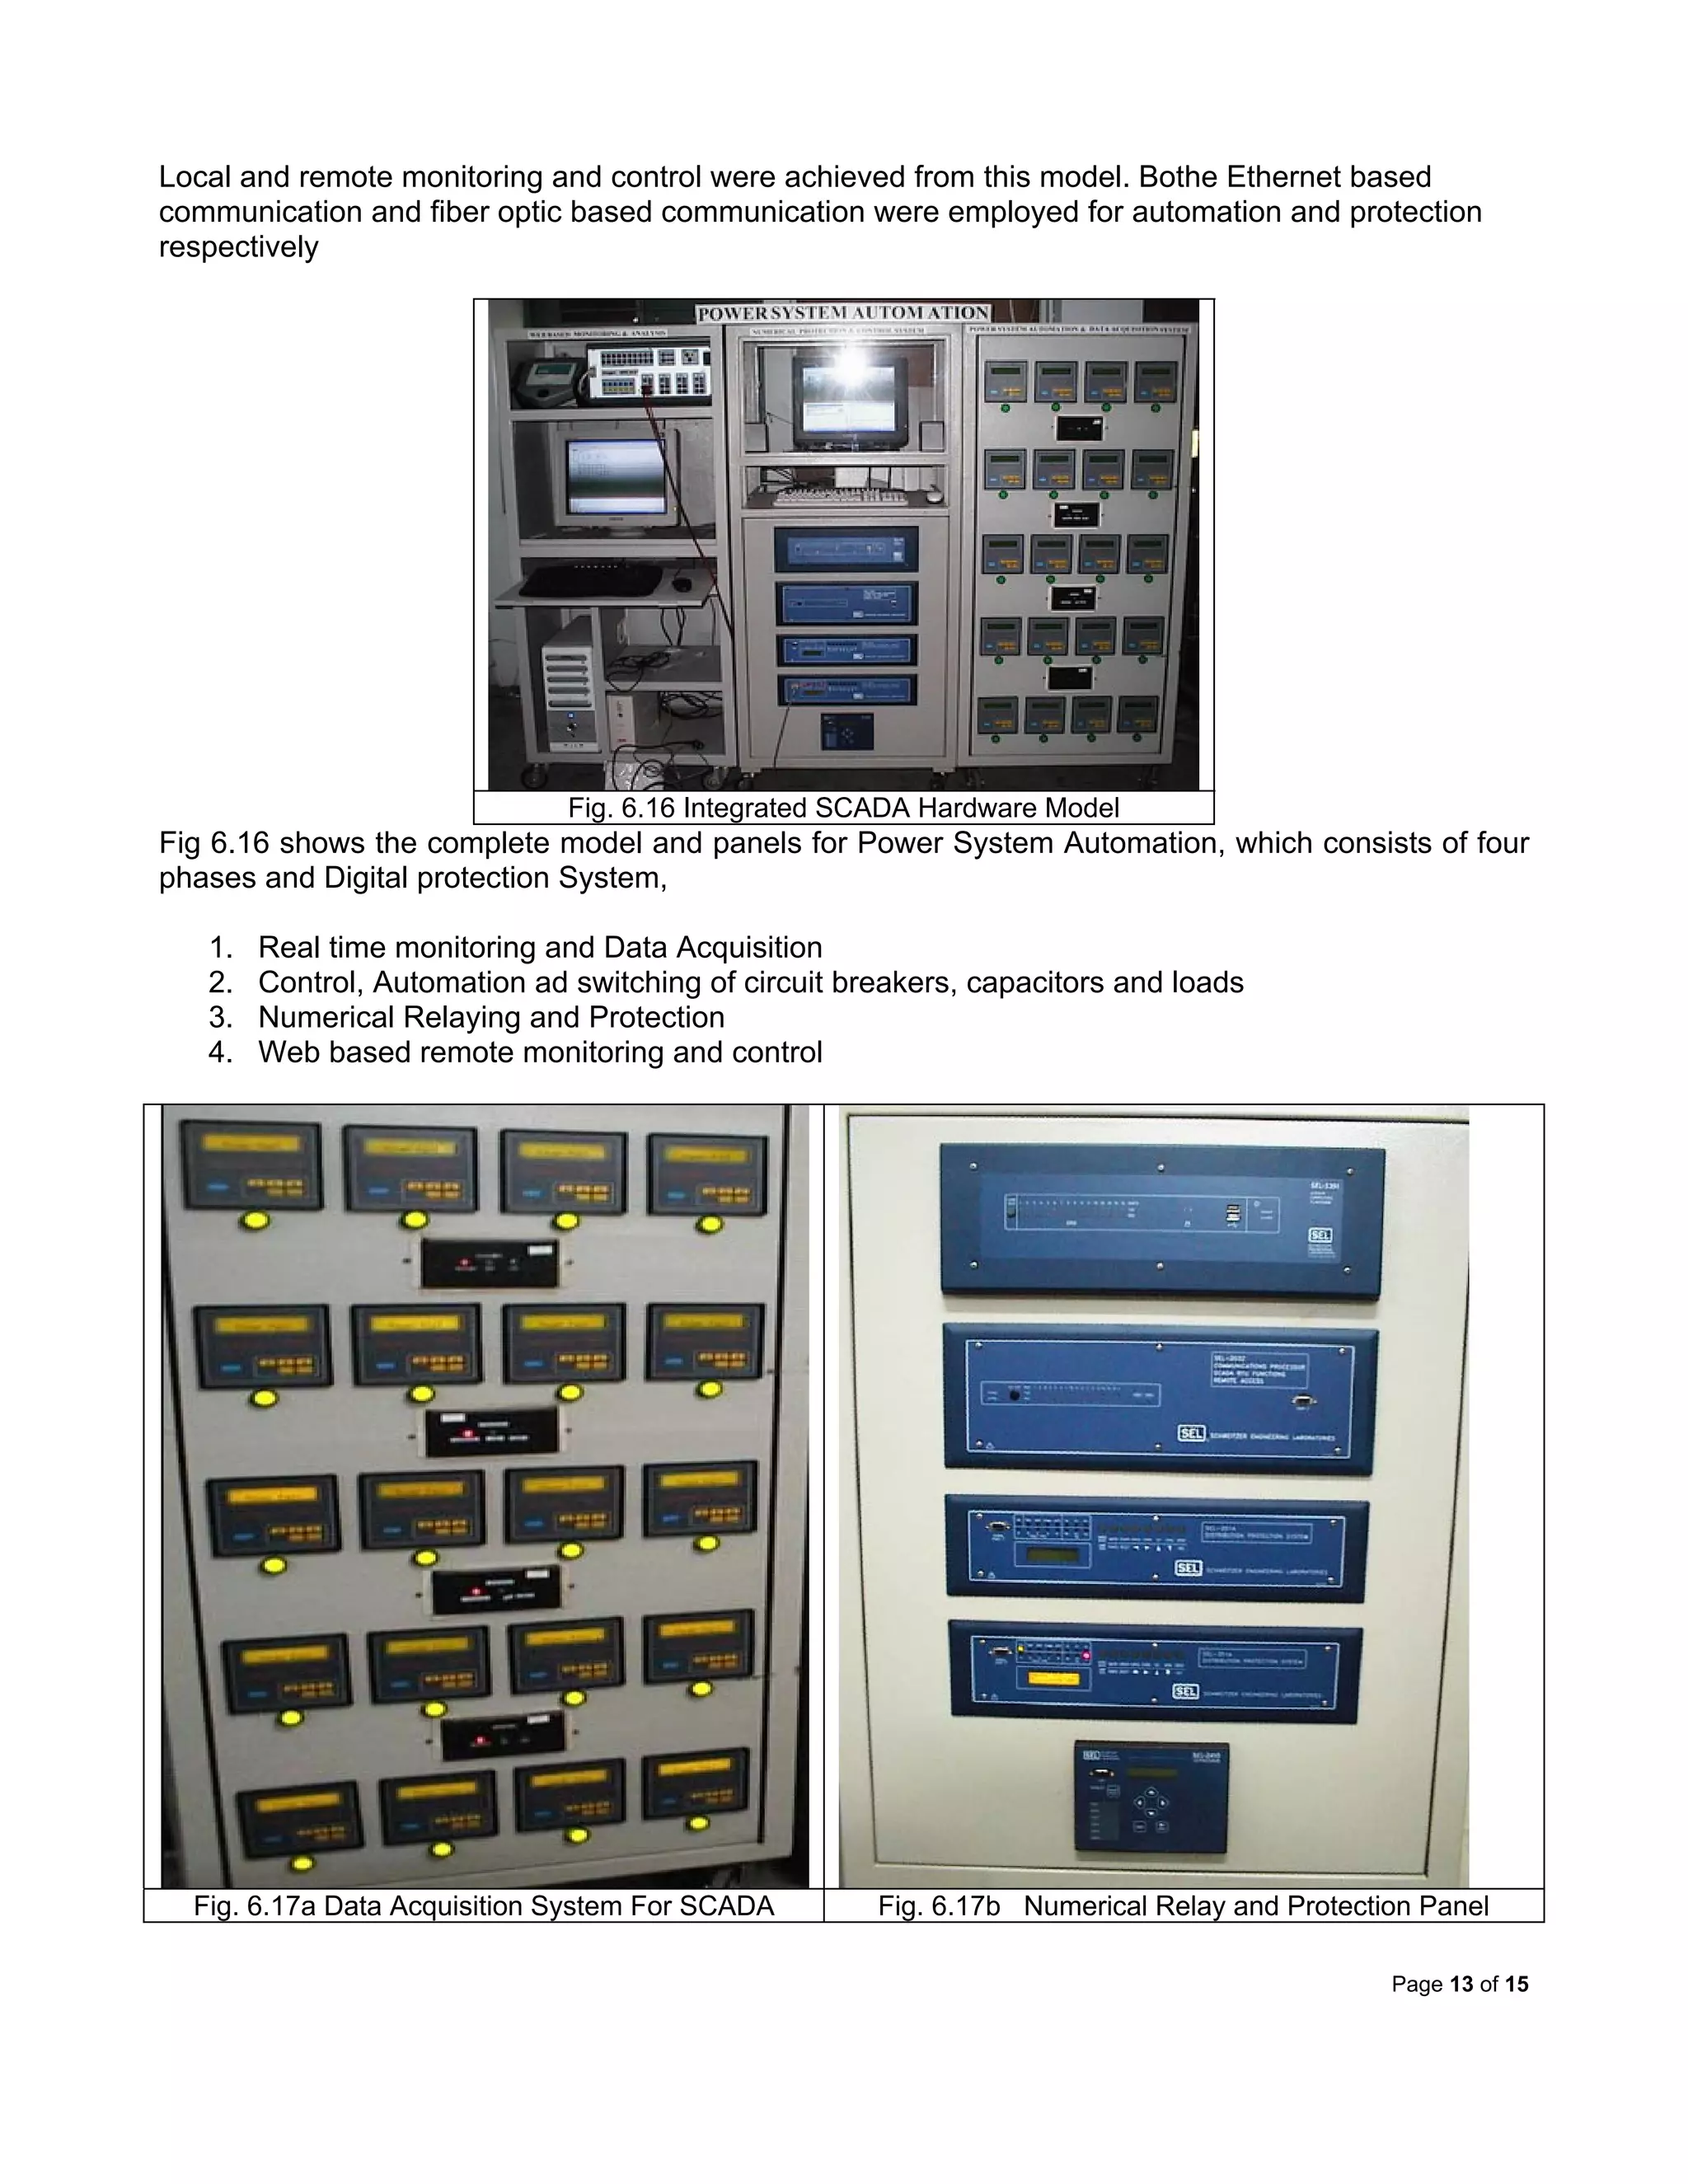
Fig 6.14 shows the complete model of the SCADA based Automation and Digital protection System.
The schematic for the hardware is shown in fig 6.15.
Fig. 6.15 Schematic diagram for SCADA based model for of Automation and Digital Protection
Page 13 of 15
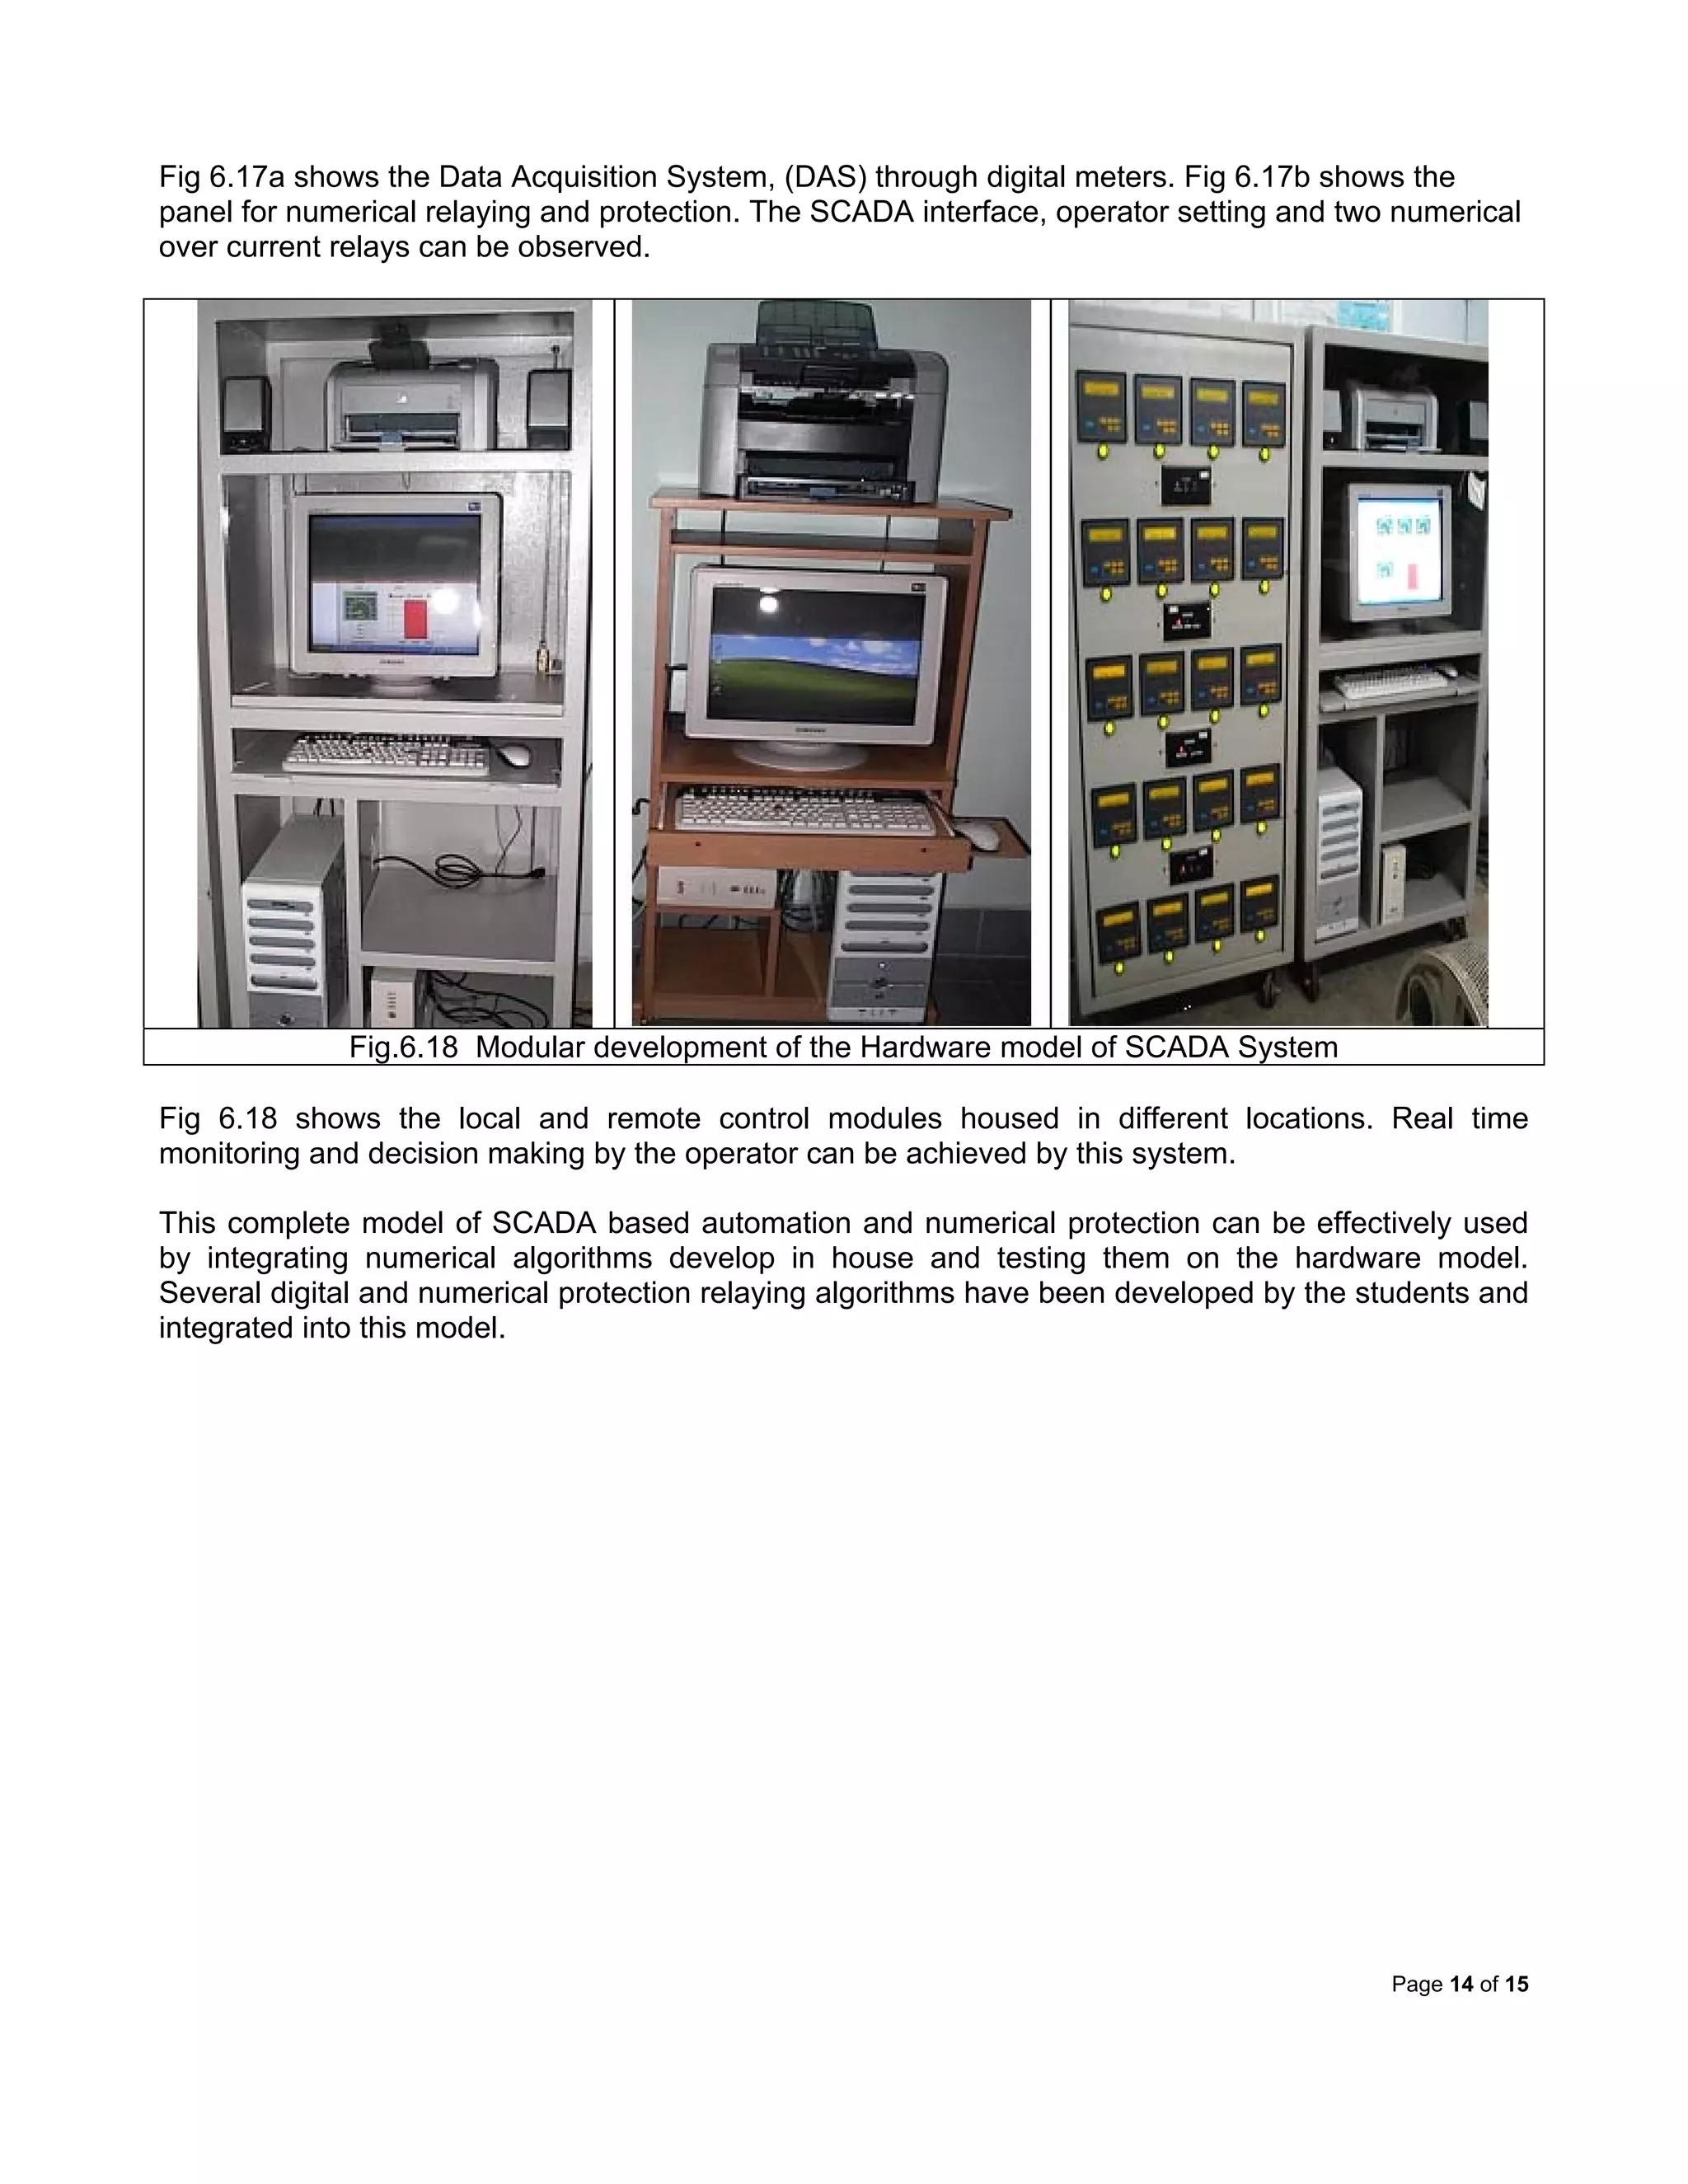
Local and remote monitoring and control were achieved from this model. Bothe Ethernet based
communication and fiber optic based communication were employed for automation and protection
respectively
Fig. 6.16 Integrated SCADA Hardware Model
Fig 6.16 shows the complete model and panels for Power System Automation, which consists of four
phases and Digital protection System,
1. Real time monitoring and Data Acquisition
2. Control, Automation ad switching of circuit breakers, capacitors and loads
3. Numerical Relaying and Protection
4. Web based remote monitoring and control
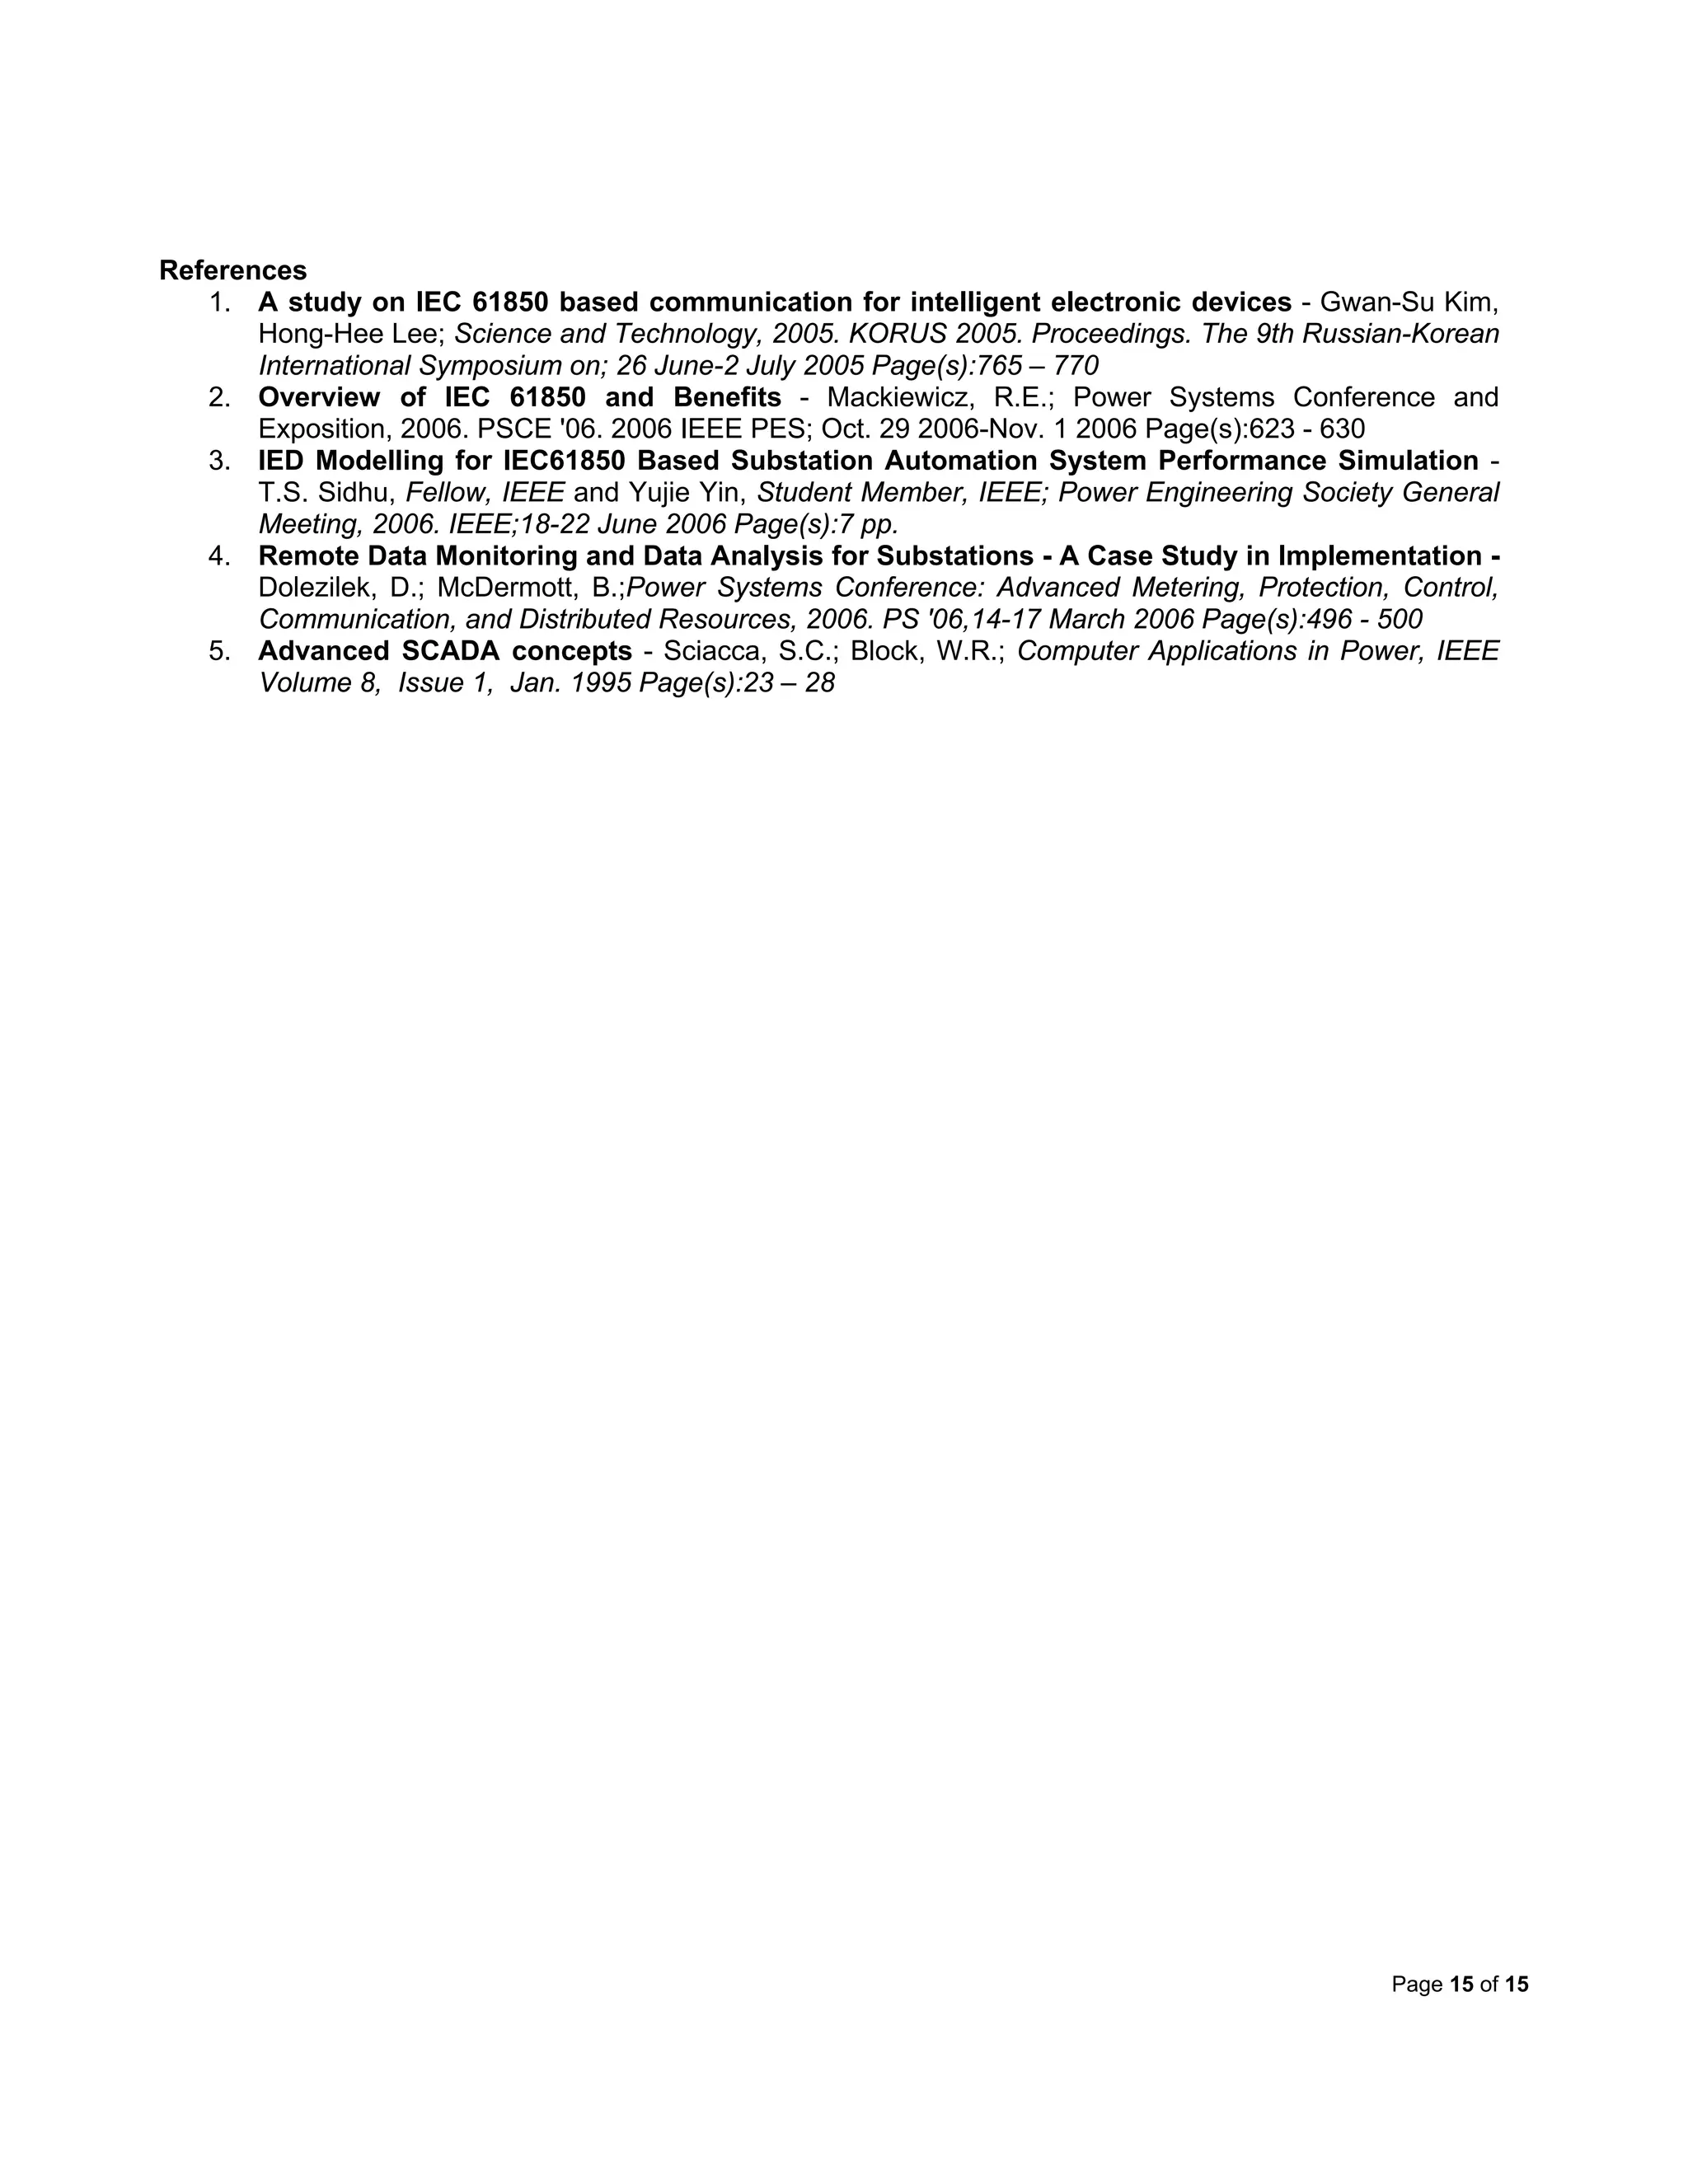
Fig. 6.17a Data Acquisition System For SCADA Fig. 6.17b Numerical Relay and Protection Panel
Page 14 of 15
Fig 6.17a shows the Data Acquisition System, (DAS) through digital meters. Fig 6.17b shows the
panel for numerical relaying and protection. The SCADA interface, operator setting and two numerical
over current relays can be observed.
Fig.6.18 Modular development of the Hardware model of SCADA System
Fig 6.18 shows the local and remote control modules housed in different locations. Real time
monitoring and decision making by the operator can be achieved by this system.
This complete model of SCADA based automation and numerical protection can be effectively used
by integrating numerical algorithms develop in house and testing them on the hardware model.
Several digital and numerical protection relaying algorithms have been developed by the students and
integrated into this model.
Page 15 of 15
References
1. A study on IEC 61850 based communication for intelligent electronic devices - Gwan-Su Kim,
Hong-Hee Lee; Science and Technology, 2005. KORUS 2005. Proceedings. The 9th Russian-Korean
International Symposium on; 26 June-2 July 2005 Page(s):765 – 770
2. Overview of IEC 61850 and Benefits - Mackiewicz, R.E.; Power Systems Conference and
Exposition, 2006. PSCE '06. 2006 IEEE PES; Oct. 29 2006-Nov. 1 2006 Page(s):623 - 630
3. IED Modelling for IEC61850 Based Substation Automation System Performance Simulation -
T.S. Sidhu, Fellow, IEEE and Yujie Yin, Student Member, IEEE; Power Engineering Society General
Meeting, 2006. IEEE;18-22 June 2006 Page(s):7 pp.
4. Remote Data Monitoring and Data Analysis for Substations - A Case Study in Implementation -
Dolezilek, D.; McDermott, B.;Power Systems Conference: Advanced Metering, Protection, Control,
Communication, and Distributed Resources, 2006. PS '06,14-17 March 2006 Page(s):496 - 500
5. Advanced SCADA concepts - Sciacca, S.C.; Block, W.R.; Computer Applications in Power, IEEE
Volume 8, Issue 1, Jan. 1995 Page(s):23 – 28

More Related Content

What's hot

Smart energy metering system
Smart energy metering systemSmart energy metering system
Smart energy metering systemravi kant
 
Wide Area Monitoring System WAMS & Applications
Wide Area Monitoring System WAMS & ApplicationsWide Area Monitoring System WAMS & Applications
Wide Area Monitoring System WAMS & ApplicationsPower System Operation
 
Power system automation
Power system automationPower system automation
Power system automationAbbas Ali
 
Objectives of shunt compensation
Objectives of shunt compensationObjectives of shunt compensation
Objectives of shunt compensationAyyarao T S L V
 
ENERGY EFFICIENT MOTORS
ENERGY EFFICIENT MOTORSENERGY EFFICIENT MOTORS
ENERGY EFFICIENT MOTORSArigela Harika
 
Power system automation introduction
Power system automation introductionPower system automation introduction
Power system automation introductionMohammed Naser
 
POWER SYSTEM PROTECTION
POWER SYSTEM PROTECTION POWER SYSTEM PROTECTION
POWER SYSTEM PROTECTION moiz89
 
SMART METER ppt
SMART METER pptSMART METER ppt
SMART METER pptAyush Jain
 
Design & Building Smart Energy Meter
Design & Building Smart Energy MeterDesign & Building Smart Energy Meter
Design & Building Smart Energy MeterChetan Khatri
 
Seminar presentation on Smart Energy Meter
Seminar presentation on Smart Energy MeterSeminar presentation on Smart Energy Meter
Seminar presentation on Smart Energy Metersudhanshurj
 
SMART GRID TECHNOLOGY
SMART GRID TECHNOLOGYSMART GRID TECHNOLOGY
SMART GRID TECHNOLOGYRanjan kumar
 
artiicial intelligence in power system
artiicial intelligence in power systemartiicial intelligence in power system
artiicial intelligence in power systempratikguptateddy
 
SMART GRID TECHNOLOGY
SMART GRID TECHNOLOGYSMART GRID TECHNOLOGY
SMART GRID TECHNOLOGYasegekar18
 
FACTS DEVICES AND POWER SYSTEM STABILITY ppt
FACTS DEVICES AND POWER SYSTEM STABILITY pptFACTS DEVICES AND POWER SYSTEM STABILITY ppt
FACTS DEVICES AND POWER SYSTEM STABILITY pptMamta Bagoria
 

What's hot (20)

Smart Meters
Smart MetersSmart Meters
Smart Meters
 
Smart energy metering system
Smart energy metering systemSmart energy metering system
Smart energy metering system
 
Wide Area Monitoring System WAMS & Applications
Wide Area Monitoring System WAMS & ApplicationsWide Area Monitoring System WAMS & Applications
Wide Area Monitoring System WAMS & Applications
 
prepaid energy meter
prepaid energy meterprepaid energy meter
prepaid energy meter
 
Power system automation
Power system automationPower system automation
Power system automation
 
Objectives of shunt compensation
Objectives of shunt compensationObjectives of shunt compensation
Objectives of shunt compensation
 
ENERGY EFFICIENT MOTORS
ENERGY EFFICIENT MOTORSENERGY EFFICIENT MOTORS
ENERGY EFFICIENT MOTORS
 
Power system automation introduction
Power system automation introductionPower system automation introduction
Power system automation introduction
 
Computer Application in Power system chapter one - introduction
Computer Application in Power system chapter one - introductionComputer Application in Power system chapter one - introduction
Computer Application in Power system chapter one - introduction
 
POWER SYSTEM PROTECTION
POWER SYSTEM PROTECTION POWER SYSTEM PROTECTION
POWER SYSTEM PROTECTION
 
SMART METER ppt
SMART METER pptSMART METER ppt
SMART METER ppt
 
Design & Building Smart Energy Meter
Design & Building Smart Energy MeterDesign & Building Smart Energy Meter
Design & Building Smart Energy Meter
 
EE6603 - Power System Operation & Control
EE6603 - Power System Operation & ControlEE6603 - Power System Operation & Control
EE6603 - Power System Operation & Control
 
Seminar presentation on Smart Energy Meter
Seminar presentation on Smart Energy MeterSeminar presentation on Smart Energy Meter
Seminar presentation on Smart Energy Meter
 
SMART GRID TECHNOLOGY
SMART GRID TECHNOLOGYSMART GRID TECHNOLOGY
SMART GRID TECHNOLOGY
 
Smart Grid & WAMS
Smart Grid & WAMSSmart Grid & WAMS
Smart Grid & WAMS
 
artiicial intelligence in power system
artiicial intelligence in power systemartiicial intelligence in power system
artiicial intelligence in power system
 
SMART GRID TECHNOLOGY
SMART GRID TECHNOLOGYSMART GRID TECHNOLOGY
SMART GRID TECHNOLOGY
 
Swing equation
Swing equationSwing equation
Swing equation
 
FACTS DEVICES AND POWER SYSTEM STABILITY ppt
FACTS DEVICES AND POWER SYSTEM STABILITY pptFACTS DEVICES AND POWER SYSTEM STABILITY ppt
FACTS DEVICES AND POWER SYSTEM STABILITY ppt
 

Similar to Power system automation

Dhiraj power system automation
Dhiraj power system automationDhiraj power system automation
Dhiraj power system automationvision2d16
 
Dhiraj power system automation
Dhiraj power system automationDhiraj power system automation
Dhiraj power system automationvision2d16
 
Practical Distribution & Substation Automation (Incl. Communications) for Ele...
Practical Distribution & Substation Automation (Incl. Communications) for Ele...Practical Distribution & Substation Automation (Incl. Communications) for Ele...
Practical Distribution & Substation Automation (Incl. Communications) for Ele...Living Online
 
Computer Applications in Power Systems 2023 SECOND.pdf
Computer Applications in Power Systems 2023 SECOND.pdfComputer Applications in Power Systems 2023 SECOND.pdf
Computer Applications in Power Systems 2023 SECOND.pdfhussenbelew
 
Scada Based Online Circuit Breaker Monitoring System
Scada Based Online Circuit Breaker Monitoring SystemScada Based Online Circuit Breaker Monitoring System
Scada Based Online Circuit Breaker Monitoring SystemIOSR Journals
 
Dhiraj seminar # power system automation
Dhiraj seminar # power system automationDhiraj seminar # power system automation
Dhiraj seminar # power system automationvision2d16
 
Dhiraj seminar # power system automation
Dhiraj seminar # power system automationDhiraj seminar # power system automation
Dhiraj seminar # power system automationvision2d16
 
Dhiraj seminar # power system automation
Dhiraj seminar # power system automationDhiraj seminar # power system automation
Dhiraj seminar # power system automationvision2d16
 
Overview of State Estimation Technique for Power System Control
Overview of State Estimation Technique for Power System ControlOverview of State Estimation Technique for Power System Control
Overview of State Estimation Technique for Power System ControlIOSR Journals
 
Smart Substation with Automatic Monitoring, Smart Controlling and Overload Pr...
Smart Substation with Automatic Monitoring, Smart Controlling and Overload Pr...Smart Substation with Automatic Monitoring, Smart Controlling and Overload Pr...
Smart Substation with Automatic Monitoring, Smart Controlling and Overload Pr...IRJET Journal
 
The Design of Multi-Platforms Rail Intelligence Flatness Detection System
The Design of Multi-Platforms Rail Intelligence Flatness Detection SystemThe Design of Multi-Platforms Rail Intelligence Flatness Detection System
The Design of Multi-Platforms Rail Intelligence Flatness Detection SystemIJRESJOURNAL
 
IRJET - Automated Monitoring Test Rig for Circuit Breaker Operation
IRJET -  	  Automated Monitoring Test Rig for Circuit Breaker OperationIRJET -  	  Automated Monitoring Test Rig for Circuit Breaker Operation
IRJET - Automated Monitoring Test Rig for Circuit Breaker OperationIRJET Journal
 
IRJET- Automatic Load Balancing and Phase Balancing by PLC and Scada
IRJET-  	  Automatic Load Balancing and Phase Balancing by PLC and ScadaIRJET-  	  Automatic Load Balancing and Phase Balancing by PLC and Scada
IRJET- Automatic Load Balancing and Phase Balancing by PLC and ScadaIRJET Journal
 
Scada substation automation prnsnt
Scada substation automation prnsntScada substation automation prnsnt
Scada substation automation prnsntIIT INDORE
 
Paper id 37201531
Paper id 37201531Paper id 37201531
Paper id 37201531IJRAT
 
Power house automation using wireless communication
Power house automation using wireless communicationPower house automation using wireless communication
Power house automation using wireless communicationeSAT Journals
 
Power house automation using wireless communication
Power house automation using wireless communicationPower house automation using wireless communication
Power house automation using wireless communicationeSAT Publishing House
 
INTERNET OF THINGS (ONLINE ENERGY MANAGEMENT)
INTERNET OF THINGS (ONLINE ENERGY MANAGEMENT)INTERNET OF THINGS (ONLINE ENERGY MANAGEMENT)
INTERNET OF THINGS (ONLINE ENERGY MANAGEMENT)FELIDAE SYSTEMS
 

Similar to Power system automation (20)

Dhiraj power system automation
Dhiraj power system automationDhiraj power system automation
Dhiraj power system automation
 
Dhiraj power system automation
Dhiraj power system automationDhiraj power system automation
Dhiraj power system automation
 
Practical Distribution & Substation Automation (Incl. Communications) for Ele...
Practical Distribution & Substation Automation (Incl. Communications) for Ele...Practical Distribution & Substation Automation (Incl. Communications) for Ele...
Practical Distribution & Substation Automation (Incl. Communications) for Ele...
 
Computer Applications in Power Systems 2023 SECOND.pdf
Computer Applications in Power Systems 2023 SECOND.pdfComputer Applications in Power Systems 2023 SECOND.pdf
Computer Applications in Power Systems 2023 SECOND.pdf
 
Scada Based Online Circuit Breaker Monitoring System
Scada Based Online Circuit Breaker Monitoring SystemScada Based Online Circuit Breaker Monitoring System
Scada Based Online Circuit Breaker Monitoring System
 
Psoc
PsocPsoc
Psoc
 
Dhiraj seminar # power system automation
Dhiraj seminar # power system automationDhiraj seminar # power system automation
Dhiraj seminar # power system automation
 
Dhiraj seminar # power system automation
Dhiraj seminar # power system automationDhiraj seminar # power system automation
Dhiraj seminar # power system automation
 
Dhiraj seminar # power system automation
Dhiraj seminar # power system automationDhiraj seminar # power system automation
Dhiraj seminar # power system automation
 
Overview of State Estimation Technique for Power System Control
Overview of State Estimation Technique for Power System ControlOverview of State Estimation Technique for Power System Control
Overview of State Estimation Technique for Power System Control
 
Smart Substation with Automatic Monitoring, Smart Controlling and Overload Pr...
Smart Substation with Automatic Monitoring, Smart Controlling and Overload Pr...Smart Substation with Automatic Monitoring, Smart Controlling and Overload Pr...
Smart Substation with Automatic Monitoring, Smart Controlling and Overload Pr...
 
The Design of Multi-Platforms Rail Intelligence Flatness Detection System
The Design of Multi-Platforms Rail Intelligence Flatness Detection SystemThe Design of Multi-Platforms Rail Intelligence Flatness Detection System
The Design of Multi-Platforms Rail Intelligence Flatness Detection System
 
Lecture 1
Lecture 1Lecture 1
Lecture 1
 
IRJET - Automated Monitoring Test Rig for Circuit Breaker Operation
IRJET -  	  Automated Monitoring Test Rig for Circuit Breaker OperationIRJET -  	  Automated Monitoring Test Rig for Circuit Breaker Operation
IRJET - Automated Monitoring Test Rig for Circuit Breaker Operation
 
IRJET- Automatic Load Balancing and Phase Balancing by PLC and Scada
IRJET-  	  Automatic Load Balancing and Phase Balancing by PLC and ScadaIRJET-  	  Automatic Load Balancing and Phase Balancing by PLC and Scada
IRJET- Automatic Load Balancing and Phase Balancing by PLC and Scada
 
Scada substation automation prnsnt
Scada substation automation prnsntScada substation automation prnsnt
Scada substation automation prnsnt
 
Paper id 37201531
Paper id 37201531Paper id 37201531
Paper id 37201531
 
Power house automation using wireless communication
Power house automation using wireless communicationPower house automation using wireless communication
Power house automation using wireless communication
 
Power house automation using wireless communication
Power house automation using wireless communicationPower house automation using wireless communication
Power house automation using wireless communication
 
INTERNET OF THINGS (ONLINE ENERGY MANAGEMENT)
INTERNET OF THINGS (ONLINE ENERGY MANAGEMENT)INTERNET OF THINGS (ONLINE ENERGY MANAGEMENT)
INTERNET OF THINGS (ONLINE ENERGY MANAGEMENT)
 

Recently uploaded

Microscopic Analysis of Ceramic Materials.pptx
Microscopic Analysis of Ceramic Materials.pptxMicroscopic Analysis of Ceramic Materials.pptx
Microscopic Analysis of Ceramic Materials.pptxpurnimasatapathy1234
 
Call Girls Narol 7397865700 Independent Call Girls
Call Girls Narol 7397865700 Independent Call GirlsCall Girls Narol 7397865700 Independent Call Girls
Call Girls Narol 7397865700 Independent Call Girlsssuser7cb4ff
 
chaitra-1.pptx fake news detection using machine learning
chaitra-1.pptx  fake news detection using machine learningchaitra-1.pptx  fake news detection using machine learning
chaitra-1.pptx fake news detection using machine learningmisbanausheenparvam
 
APPLICATIONS-AC/DC DRIVES-OPERATING CHARACTERISTICS
APPLICATIONS-AC/DC DRIVES-OPERATING CHARACTERISTICSAPPLICATIONS-AC/DC DRIVES-OPERATING CHARACTERISTICS
APPLICATIONS-AC/DC DRIVES-OPERATING CHARACTERISTICSKurinjimalarL3
 
Software and Systems Engineering Standards: Verification and Validation of Sy...
Software and Systems Engineering Standards: Verification and Validation of Sy...Software and Systems Engineering Standards: Verification and Validation of Sy...
Software and Systems Engineering Standards: Verification and Validation of Sy...VICTOR MAESTRE RAMIREZ
 
Heart Disease Prediction using machine learning.pptx
Heart Disease Prediction using machine learning.pptxHeart Disease Prediction using machine learning.pptx
Heart Disease Prediction using machine learning.pptxPoojaBan
 
CCS355 Neural Network & Deep Learning UNIT III notes and Question bank .pdf
CCS355 Neural Network & Deep Learning UNIT III notes and Question bank .pdfCCS355 Neural Network & Deep Learning UNIT III notes and Question bank .pdf
CCS355 Neural Network & Deep Learning UNIT III notes and Question bank .pdfAsst.prof M.Gokilavani
 
Past, Present and Future of Generative AI
Past, Present and Future of Generative AIPast, Present and Future of Generative AI
Past, Present and Future of Generative AIabhishek36461
 
OSVC_Meta-Data based Simulation Automation to overcome Verification Challenge...
OSVC_Meta-Data based Simulation Automation to overcome Verification Challenge...OSVC_Meta-Data based Simulation Automation to overcome Verification Challenge...
OSVC_Meta-Data based Simulation Automation to overcome Verification Challenge...Soham Mondal
 
Sachpazis Costas: Geotechnical Engineering: A student's Perspective Introduction
Sachpazis Costas: Geotechnical Engineering: A student's Perspective IntroductionSachpazis Costas: Geotechnical Engineering: A student's Perspective Introduction
Sachpazis Costas: Geotechnical Engineering: A student's Perspective IntroductionDr.Costas Sachpazis
 
Biology for Computer Engineers Course Handout.pptx
Biology for Computer Engineers Course Handout.pptxBiology for Computer Engineers Course Handout.pptx
Biology for Computer Engineers Course Handout.pptxDeepakSakkari2
 
Internship report on mechanical engineering
Internship report on mechanical engineeringInternship report on mechanical engineering
Internship report on mechanical engineeringmalavadedarshan25
 
Churning of Butter, Factors affecting .
Churning of Butter, Factors affecting  .Churning of Butter, Factors affecting  .
Churning of Butter, Factors affecting .Satyam Kumar
 
Electronically Controlled suspensions system .pdf
Electronically Controlled suspensions system .pdfElectronically Controlled suspensions system .pdf
Electronically Controlled suspensions system .pdfme23b1001
 
Application of Residue Theorem to evaluate real integrations.pptx
Application of Residue Theorem to evaluate real integrations.pptxApplication of Residue Theorem to evaluate real integrations.pptx
Application of Residue Theorem to evaluate real integrations.pptx959SahilShah
 
Oxy acetylene welding presentation note.
Oxy acetylene welding presentation note.Oxy acetylene welding presentation note.
Oxy acetylene welding presentation note.eptoze12
 

Recently uploaded (20)

POWER SYSTEMS-1 Complete notes examples
POWER SYSTEMS-1 Complete notes  examplesPOWER SYSTEMS-1 Complete notes  examples
POWER SYSTEMS-1 Complete notes examples
 
Microscopic Analysis of Ceramic Materials.pptx
Microscopic Analysis of Ceramic Materials.pptxMicroscopic Analysis of Ceramic Materials.pptx
Microscopic Analysis of Ceramic Materials.pptx
 
Design and analysis of solar grass cutter.pdf
Design and analysis of solar grass cutter.pdfDesign and analysis of solar grass cutter.pdf
Design and analysis of solar grass cutter.pdf
 
🔝9953056974🔝!!-YOUNG call girls in Rajendra Nagar Escort rvice Shot 2000 nigh...
🔝9953056974🔝!!-YOUNG call girls in Rajendra Nagar Escort rvice Shot 2000 nigh...🔝9953056974🔝!!-YOUNG call girls in Rajendra Nagar Escort rvice Shot 2000 nigh...
🔝9953056974🔝!!-YOUNG call girls in Rajendra Nagar Escort rvice Shot 2000 nigh...
 
Call Girls Narol 7397865700 Independent Call Girls
Call Girls Narol 7397865700 Independent Call GirlsCall Girls Narol 7397865700 Independent Call Girls
Call Girls Narol 7397865700 Independent Call Girls
 
chaitra-1.pptx fake news detection using machine learning
chaitra-1.pptx  fake news detection using machine learningchaitra-1.pptx  fake news detection using machine learning
chaitra-1.pptx fake news detection using machine learning
 
APPLICATIONS-AC/DC DRIVES-OPERATING CHARACTERISTICS
APPLICATIONS-AC/DC DRIVES-OPERATING CHARACTERISTICSAPPLICATIONS-AC/DC DRIVES-OPERATING CHARACTERISTICS
APPLICATIONS-AC/DC DRIVES-OPERATING CHARACTERISTICS
 
Software and Systems Engineering Standards: Verification and Validation of Sy...
Software and Systems Engineering Standards: Verification and Validation of Sy...Software and Systems Engineering Standards: Verification and Validation of Sy...
Software and Systems Engineering Standards: Verification and Validation of Sy...
 
Heart Disease Prediction using machine learning.pptx
Heart Disease Prediction using machine learning.pptxHeart Disease Prediction using machine learning.pptx
Heart Disease Prediction using machine learning.pptx
 
CCS355 Neural Network & Deep Learning UNIT III notes and Question bank .pdf
CCS355 Neural Network & Deep Learning UNIT III notes and Question bank .pdfCCS355 Neural Network & Deep Learning UNIT III notes and Question bank .pdf
CCS355 Neural Network & Deep Learning UNIT III notes and Question bank .pdf
 
Past, Present and Future of Generative AI
Past, Present and Future of Generative AIPast, Present and Future of Generative AI
Past, Present and Future of Generative AI
 
young call girls in Rajiv Chowk🔝 9953056974 🔝 Delhi escort Service
young call girls in Rajiv Chowk🔝 9953056974 🔝 Delhi escort Serviceyoung call girls in Rajiv Chowk🔝 9953056974 🔝 Delhi escort Service
young call girls in Rajiv Chowk🔝 9953056974 🔝 Delhi escort Service
 
OSVC_Meta-Data based Simulation Automation to overcome Verification Challenge...
OSVC_Meta-Data based Simulation Automation to overcome Verification Challenge...OSVC_Meta-Data based Simulation Automation to overcome Verification Challenge...
OSVC_Meta-Data based Simulation Automation to overcome Verification Challenge...
 
Sachpazis Costas: Geotechnical Engineering: A student's Perspective Introduction
Sachpazis Costas: Geotechnical Engineering: A student's Perspective IntroductionSachpazis Costas: Geotechnical Engineering: A student's Perspective Introduction
Sachpazis Costas: Geotechnical Engineering: A student's Perspective Introduction
 
Biology for Computer Engineers Course Handout.pptx
Biology for Computer Engineers Course Handout.pptxBiology for Computer Engineers Course Handout.pptx
Biology for Computer Engineers Course Handout.pptx
 
Internship report on mechanical engineering
Internship report on mechanical engineeringInternship report on mechanical engineering
Internship report on mechanical engineering
 
Churning of Butter, Factors affecting .
Churning of Butter, Factors affecting  .Churning of Butter, Factors affecting  .
Churning of Butter, Factors affecting .
 
Electronically Controlled suspensions system .pdf
Electronically Controlled suspensions system .pdfElectronically Controlled suspensions system .pdf
Electronically Controlled suspensions system .pdf
 
Application of Residue Theorem to evaluate real integrations.pptx
Application of Residue Theorem to evaluate real integrations.pptxApplication of Residue Theorem to evaluate real integrations.pptx
Application of Residue Theorem to evaluate real integrations.pptx
 
Oxy acetylene welding presentation note.
Oxy acetylene welding presentation note.Oxy acetylene welding presentation note.
Oxy acetylene welding presentation note.
 

Power system automation

  • 1. Page 1 of 15 LECTURE 6: POWER SYSTEM AUTOMATION 6.1 Introduction: Power System Automation is one of the important aspects in an electrical power network that needs careful investigation. In power system automation, data acquisition system plays a major role as a base of the power system automation. From the recent trends and developments in Power System Automation, Computerized system Automation is most efficient compared to normal systems. Computerized Power Network for Data Acquisition system helps the system and controller to meter and monitor the values for further manipulations for full-scale power system automation and system controlling. The Computerized Data Acquisition for Metering and Monitoring of Power System Automation can be divided into three general categories as Data collection, Metering & Monitoring. The Data collection system collects the data from the Power system Network using the Digital Power Monitors through the current transformers and potential transformers. The collected data will be Metered by the Digital Power Monitor where the Monitor consists of a Micro Controller with the peripherals like memory, A/D converter and Sample and hold circuitry. According to the programming done in the Microcontroller the Power Monitor will store the parameters in the memory and it will do all the logical and arithmetic calculations to manipulate the parameters and to calculate the different Power data’s like KWH, KVAR, KVA, PF etc,. The collected parameters of the Power System and the calculated power data can be monitored on the screen of the Digital Power Monitor. The values will be sent to the Computer System using the Communication system like Serial Communication RS485 and RS 232 for n no of Power Monitors using the Data Converter. This section describes power system automation protection and control which is aimed at the improvement of the management of power networks is being adopted by increasing by number of supply authorities. Automation, Protection, Local control, Operator interfaces, Communication, Remote control and Monitoring functions, most of which were previously utilized with relays or modules for each function, are now integrated into multi-function PLC (programmable logic Controller) based units and interconnected on various types of local area networks. The components of the system will have a better communication with each other sharing information through the local area network and systems work similarly because one sensor is enough to collect one network information and transferred the information through out the network using LAN and communication mediums instead of one sensor per each component as before. To achieve we need a better system apart from different systems like protection, Communication, RTU’s, IED’s etc. called as Data acquisition system with out the perfect data communication system the components of the total system cant perform the right tasks at right time because of the disturbance in the collected. To overcome this problem we have designed a better Data Acquisition system with the efficient technology and with the perfect communication systems to transfer the data. The system is named as “Computerized Power Network Data Acquisition and Monitoring for Power System Automation”. The system acquires the data from the power network (data acquisition) for monitoring. The software was developed to do all the manipulations and the parameters and data of the system can be viewed in different forms (analog, digital, graphical). The software developed will be used to view the captured data’s from the Power Monitor in different forms like Analog Metering, Digital data and in graphical form. The software will generate the reports for all the different types of manipulations like power fail, CT or PT fail Low PF etc, the software will save the data 6 times per day in form of reports.
  • 2. Page 2 of 15 6.2 BENEFITS OF POWER SYSTEM AUTOMATION Important benefits of automation can be listed as follows 1. Improved quality of service and reduced manpower requirements 2. Improved reliability with reduced system implementation costs 3. Maintenance/expansion of customer base and Reduced operating costs 4. High value service provider and reduced maintenance costs 5. Added value services with the ability to defer capacity addition projects 6. Improved customer access to information and also improved information for engineering decisions 7. Enterprise information accessibility along with improved information for planning decisions 8. Flexible Billing Options and reduced customer outage minutes 6.3 POWER SYSTEM AUTOMATION Power System Automation is a system for managing, controlling and protecting the various components connected to the power network. It obtains the real time information from the system, local and remote control applications with advanced electrical system protection. The core of power system automation stands on local intelligence, data communications with supervisory control and monitoring. Structure of Power System Automation The functional structure of power system automation will be as shown in fig 6.1.  Electrical Protection  Control  Measurement  Monitoring  Data Communications Fig 6.1 Functional structure of Power System Automation Electrical Protection Electrical Protection is the most important concept of the Power system Automation, to protect the equipment and personnel and to limit the damage at fault. It is a local function and it has the capability to function independently from the Automation if necessary, although it is a part of Power system Automation the function of electrical protection never restricted in Power system Automation. Control
  • 3. Page 3 of 15 Control application of a Power system Automation includes local and remote control. Local control consists of actions the control device can logically take by it self (Bay interlocking, switching sequences, and synchronizing check). Human intervention is limited and the risk was greatly reduced. Remote control functions to control Substations remotely from the SCADA. Commands can be given directly to the remote control devices (open and close of circuit breakers, relay settings, requests for information from the SCADA station). This eliminates the personnel performance switching operations, actions can be performed faster. A safe working environment is created for personnel and the operator or engineer at the SCADA has a complete over view of the entire Power network. Measurement Measurement is one of important concept in Power system Automation. The real time information about a substation or equipment is collected and displayed in the control center and stored in a data base for further manipulations, It erases the personnel to go to substation or switching area collect the information cutting down workloads. The information collected can assist in doing network studies like load flow analysis, planning ahead and preventing disturbances in the Power network. Previously the word ‘Measurement’ refer to voltage, current and frequency, and the word ‘Metering’ refer to power, reactive power and energy (KWh). The different terms used because different instruments were used for these applications, now the two functions are integrated in modern devices hence the terms are used interchangeably in the text. Monitoring Monitoring is specified for the maintenance of the Power system Automation. It monitors sequence of records, status and condition of the system, maintenance information and relay settings etc. The information can help in fault analysis, what where when why it happened. It is used to improve the efficiency of the system. Data Communication Normally Communication forms a core for any system, in Power system Automation Data communication forms core of the power system Automation. With out communication the local device and protection tasks can be performed individually. But with out data communication there is no mean to say Power system Automation. 6.2 ARCHITECTURE FOR POWER SYSTEM AUTOMATION Figure 6.2 shows the generalized architecture for Power System Automation. There are three levels which are connected to each other through communication medium.
  • 4. Page 4 of 15 Level 1: This level contains the field equipment and Switch gear, CTs, PTS, etc. Monitoring and measurement of system parameters are carried out at this layer. Level 2: This level contains the protection and control equipment. Protective relays, RTUS and IEDs constitute this layer. The collected information for layer 1 is processed here. Level 3: This level contains the Operator Display and Engineering Workstation for executing the programs. This level is also called as the Energy Management Systems (EMS) Level or Layer, where network analysis programs are run for operating the system Power system automation is concerned mostly with levels 1 and 2. The RTUs and IEDs on receiving information determine the tasks to be carried out for automation. The usual tasks in automation are 1) Switching (on or off) of Equipment like Capacitors, Reactors 2) Network Switching (on or off) or Reconfiguration of Transmission or distribution lines 3) Changing settings on equipment (Transformer on-load tap changing), Fig 6.2. Architecture for Power System Automation
  • 5. Page 5 of 15 6.3 Classification of Power system Automation a) Substation Automation b) Distribution Automation Substation Automation Substation automation is not a new concept. Substations have been equipped to perform automatic re closing, bus sectionalizing, load transfers, capacitor switching, etc. for many years. In the past, these and other functions were implemented using a combination of control panels, auxiliary relays, switches, lights, meters, transducers and extensive wiring and cabling. In many applications today, this perception is probably because developments in substation equipment have expanded the potential capabilities of substation. Automation far beyond that which could previously be reasonably accomplished. The principal development is generically defined as an Intelligent Electronic Device (IED) which typically consists of one or more Programmable Logic Controllers and communications ports; with the ability to transmit data and execute control commands, and frequently provide a local user interface. Typical examples are relays, meters, and specialized sensors. Prior to the introduction of Numerical relays, the protection and control of a very small substation consisting of one incoming line, one transformer and two feeders would require four large panels filled with relays, switches and lights. Only one panel is required when Numerical relays are used. Interestingly, at the same time the space requirements are reduced by a factor of four, so the installed cost. Advances in communications technology are used to tie everything together into a useful network. Within the substation, a single high-speed Local Area Network (LAN) is used to transmit data and control commands, replacing the extensive and costly cables that had been required. At the present time, a number of different LAN techniques and protocols are in use. The industry is actively working on development of a new standard LAN definition that will be based on the use of Ethernet and Manufacturing Messaging Specification (MMS) and will be compatible with the Utility Communications Architecture (UCA). There are already many techniques for moving data out of the substation to a master station or to other substations. These include the use of leased or dedicated telephone lines, dial-up phone lines, cellular telemetry techniques, satellite transmissions, various flavors of radio techniques and fiber-optic networks. Basically, this variety of communications methods results in the ability to transmit large amounts of information at a rapidly declining cost per bit. The combination of PLC based devices and communications technology creates the ability to obtain more information about the power system and the equipment being used. Power system variables include magnitude and angle of voltages and currents, real and reactive power, frequency, power factors etc. Information is available regarding the initiating event for relay operation, the location of faults, and fault analysis. Specialized sensors and transducers are used to build a database relating to equipment condition and use; so that analysis techniques can be used to determine equipment condition and base maintenance activities on actual condition rather than time schedules. Within the substation, the use of Programmable Logic Controllers or other types of computers opens up a vast array of automation possibilities. Complex schemes for dead bus and dead line re-closing can be implemented, with the sequence being based on actual power system conditions that exist at the time. Re-closing of circuits can be modified based on cold load pickup requirements. Load transfers between busses and transformers can be made to protect against transformer overloads. Bus voltages and power factors can be tightly controlled to minimize losses or voltage variations. Supplementary measurements and inputs can be used to initiate automatic equipment re energizing after a transformer or bus differential. Distribution Automation Distribution Automation systems have been defined as system that enable an electric utility to monitor, coordinate and operate system components in a real time mode from remote locations the
  • 6. Page 6 of 15 distribution automation is modular and may be implemented in phases to include remote monitoring and control of substation, feeder and consumer devices and loads. The goals of Distribution Automation are:  Reduced costs  Improve service reliability  Better consumer service  Enhance government relations  Distribution Automation system postulates are:  Deferred capital expenditures  Reduced operations and maintenance expenses  Improved outage response and restoration  Enhanced system efficiencies  Enhanced consumer satisfaction  Improved data information  Positive public image  Distribution Automation system de postulates are:  Prevent outages  Alleviate the need for a sound maintenance program  Replace good operation practices  Eliminate the need for appropriate planning As utility managers and engineers interested in effective approaches to increasing efficiency and productivity the latest “high tech” developments must be continuously reviewed by the utility. Increased competition has led large existing and potential commercial consumers to carefully evaluate both the direct cost of electric service and the monetary value of reliable electric service. These activities in conjunction with increased awareness by residential consumers of even the shortest loss of electric service have resulted in increased emphasis by regulatory agencies in qualifying the cost to consumers of outages. It is important to identify the costs and benefits of each project including the value of improved reliability to the consumer. 1.4 Problem Description The problem at hand is to develop a better Data Acquisition System. This involves the hardware and the software used in a Data Acquisition system and Power System Automation. This paper focuses on developing the hardware and software for the system. The software component can be considered the soul of the data acquisition system as it is the very presence of software as the decision making entity in the system that makes the system unique. All existing data acquisition systems had to undergo hardware changes in order to change the settings or functional parameters. This involved the tedious task of rewiring the existing system. The fact that data acquisition system makes the base of the power system automation in all the causes of various applications and simple software to monitor the total system with the acquired data makes the problem at hand simple. For instance, earlier, if the data to be collected from the system or from the components of the system the controller or engineer should go to the field with a large equipment and the time take for the collection of data will be very high and where the data collected data is not accurate it will not matches with the calculated values and the decision making for any thing is to difficult where the data what we have is not sufficient to do some thing these are the problems exists in the previous data acquisition system. Data acquisition refers to acquiring, or collecting, data. This data is collected in the form of measured analog current or voltage values or the open or closed status of contact points. Acquired data can be
  • 7. Page 7 of 15 used locally within the device collecting it, sent to another device in a substation, or sent from the substation to one or several databases for use by operators, engineers, planners, and administration. In order to overcome the situation digital technology has been adopted for the better data acquisition system. The digital system will have a sampling rate where it samples each data collected from the systems, takes the average of the data and gives the perfect accurate value of the system value which can be useful to do any manipulations at the effective. The computerized power network uses the PLC based Data Acquisition technology which collects the data from the Power system through the sensors and transducers and sends the data to the PLC the system will manipulate the data and sends the data to the human interface system. The controller will have the better understand on the system situation and he can take perfect decision at right time. The Digital systems are programmable so they have the capability to understand the situation of the system and they can take the pre commanded decisions without the interference of the human, which increases the efficiency of the total system. Monitoring The word monitoring in Data Acquisition means the over view of all the system. The acquisition system will collect the data from the Power system network and store the online data in the main data base, and it will be monitored at the controller section on the HMI. As the acquisition system is self programmed the decisions can be made by the system also where normally the controller won’t have that information. So the system monitoring will have the complete view on the total system means the online system parameters, decisions taken by the system, time of system shutdown, switch on relay trip fault location, type of fault, power drawn by the bus bars etc. where using this the controller can say that what the system is doing at any particular time while he have the perfect command on the total system . Meter Placement The placement of meters also plays a role in the Power system Automation and Data Acquisition system. If the meters are placed as such with out any perfect survey some of the meters m ay be over loaded and some of them may ideal so unnecessary things will arise in the system. The solution is to have optimal placement of meters using the developed software for the optimal placement of meters we can find out where the meters to be placed from the n number of nodes where the system will have the better working part and cost effective. 1.5 IMPLEMENTATION OF POWER SYSTEM AUTOMATION AND PROTECTION USING SCADA The Computerized power network data Acquisition and monitoring for Power system Automation have been implemented using part of software and hardware. The hardware involves different type of digital, communication equipment with a Computing system. The software involves the data collection and monitoring software with the AMP (Automatic Meter Placement). 5.1. Hardware Development The Computerized Power Network for Data Acquisition Metering & Monitoring System for Power System Automation have been adopted to a small proto type substation model as shown in fig.6.3a and fig 6.3b. The details of Data Acquisition Metering & Monitoring System are shown in fig.6.4a and fig 6.4b. The Power Monitors were connected at the Generation and Distribution end. The data will be collected by the system using the Data Converter and the RS 485 and RS 232 serial Communication systems.
  • 8. Page 8 of 15 Main Source Reserve Source IS1IS2 PT1 PT2 CT1 CT2 CT4 CT5 CT6 MHTBB RHTBB CT3 CB1 CB2 CB3 CB4 CB5 CB6 HTBB LTBB TRANSFORMER LOAD 1 LOAD 2 Main Source Reserve Source IS1IS2 PT1 PT2 CT1 CT2 CT4 CT5 CT6 MHTBB RHTBB CT3 CB1 CB2 CB3 CB4 CB5 CB6 HTBB LTBB TRANSFORMER LOAD 1 LOAD 2 Fig 6.3(a). 33/11 KV Substation Fig. 6.3(b). 33/11 KV Proto type Substation The selected 33/11 KV substation single line diagram. In the Computerized Power Network for a scale down Substation model, the Power monitors were connected at the 33KV Bus Bar and at 11KV Bus Bar. The two meters were connected to the Data Converter through RS485 Connectors and the Data converter is connected to the Computing system through RS232 connector the RS232 and RS485 are the two types of different Serial Communication Systems used in the Power Network Fig. 6.4(a) Data Acquisition System For SCADA Model Fig. 6.4(b) Data Acquisition System For SCADA Model The Power Monitors will collect the data from the Power Network and the data will be manipulated and different power system data’s will be calculated the data can be viewed on the LCD display of the Power Monitor. The data will be sent to the Computing system through the Data converter and RS485, RS232 two way Communication systems. The simplified model for the Computerized Data Acquisition is shown in fig 6.5a. A simplified model corresponding to figure 6.3a was developed in hardware and information for CT and PT were
  • 9. Page 9 of 15 collected and sent tp the computer for processing. Fig 6.5b shows the digital meter which transmit and receive information from the hardware model to the computer and vice versa Fig .6.5(a) Schematic of Hardware Setup Fig .6.6(b) Monitoring and metering interface. 5.2. Software Programming The Software is developed using Visual Basic and the Micro Soft access is used as the data base for the software. The software consists of two parts one is automatic meter placement AMP and the second one is Data Acquisition. Using the Data Acquisition software we can do all the manipulations, report generations and we can view the same parameters and data in the software as an analog and digital meters as shown the software will generate the failure reports daily schedule online reports and the data reports for 6 times in a day. The online parameters and data can be viewed as analog and digital data as shown in fig 6.7a and fig 6.7b Fig 6.7(a) Three phase parameters in graphical view Fig. 6.7(b) Three phaseparameters in icon view 5.3. Control through Automation Control refers to sending command messages to a device to operate the control instruments and power system devices the meters. Traditional supervisory control and data acquisition (SCADA) system relay on operators to supervise the system and initiate commands from an operator console on the master computer. Field personnel can also control devices using front panel push buttons or a laptop computer. 1.6Simulation The simulation is done using the developed hardware for 2 power monitors with the proto type 33/11KV substation model in the presence the Human Machine interface (HMI) and software and the
  • 10. Page 10 of 15 different outputs have been verified and generated for the implementation and simulation studies like report generation, power factor control and relay coordination etc. 6.1. Report Generation The software will save the online data as a text file in the form of report for further reference, the software will generate daily reports at 6 different timing in a day to plot the load curve and etc,. Fig 6.8(a) and 6.8(b) show the graphical view and on line reports by the software. The online parameters and data can be viewed as a comparison chart. The online parameters can be viewed as a graphical representation for different parameters as three phase parameters line parameters power factor power KWH, KVA, KVAR. It will give the report generation in different forms for different fault conditions or any abnormal conditions. Failure reports like online reports, power fail, CT fail, PT fail and Low PF can be viewed as shown in fig 6.9a and 6.9b Fig 6.8(a) Three phase currents in graphical view Fig 6.8(b) Online reports Fig 6.9(a) Failure reports data base Fig 6.9(b) Failure reports
  • 11. Page 11 of 15 Fig .6.10(a) low power factor reports data base Fig .6.10(b) low power factor reports 6.2. Power factor Control The power factor can be controlled using the meter and software developed whenever there is a low power factor i.e., below 0.6 the meter will give alarm with a report saying that low pf as shown in fig. 9 6.3. Relay Coordination The software and the meter hardware have the availability to control or operate the relays from the HMI using the meter as the hardware. Whenever a fault occurred in the system the software will send signal to the relay to trip
  • 12. Page 12 of 15 6.7 SCADA Based Model for Automation and Digital Protection A SCADA based power system automation model has been developed as a part of the course. A laboratory based model for EMS-SCADA was used to supplement the course. . The stage by stage development of the SCADA system which is used for EMS applications and SCADA testing is presented and discussed. Fig.6.14 SCADA based model for Automation and Digital Protection Fig 6.14 shows the complete model of the SCADA based Automation and Digital protection System. The schematic for the hardware is shown in fig 6.15. Fig. 6.15 Schematic diagram for SCADA based model for of Automation and Digital Protection
  • 13. Page 13 of 15 Local and remote monitoring and control were achieved from this model. Bothe Ethernet based communication and fiber optic based communication were employed for automation and protection respectively Fig. 6.16 Integrated SCADA Hardware Model Fig 6.16 shows the complete model and panels for Power System Automation, which consists of four phases and Digital protection System, 1. Real time monitoring and Data Acquisition 2. Control, Automation ad switching of circuit breakers, capacitors and loads 3. Numerical Relaying and Protection 4. Web based remote monitoring and control Fig. 6.17a Data Acquisition System For SCADA Fig. 6.17b Numerical Relay and Protection Panel
  • 14. Page 14 of 15 Fig 6.17a shows the Data Acquisition System, (DAS) through digital meters. Fig 6.17b shows the panel for numerical relaying and protection. The SCADA interface, operator setting and two numerical over current relays can be observed. Fig.6.18 Modular development of the Hardware model of SCADA System Fig 6.18 shows the local and remote control modules housed in different locations. Real time monitoring and decision making by the operator can be achieved by this system. This complete model of SCADA based automation and numerical protection can be effectively used by integrating numerical algorithms develop in house and testing them on the hardware model. Several digital and numerical protection relaying algorithms have been developed by the students and integrated into this model.
  • 15. Page 15 of 15 References 1. A study on IEC 61850 based communication for intelligent electronic devices - Gwan-Su Kim, Hong-Hee Lee; Science and Technology, 2005. KORUS 2005. Proceedings. The 9th Russian-Korean International Symposium on; 26 June-2 July 2005 Page(s):765 – 770 2. Overview of IEC 61850 and Benefits - Mackiewicz, R.E.; Power Systems Conference and Exposition, 2006. PSCE '06. 2006 IEEE PES; Oct. 29 2006-Nov. 1 2006 Page(s):623 - 630 3. IED Modelling for IEC61850 Based Substation Automation System Performance Simulation - T.S. Sidhu, Fellow, IEEE and Yujie Yin, Student Member, IEEE; Power Engineering Society General Meeting, 2006. IEEE;18-22 June 2006 Page(s):7 pp. 4. Remote Data Monitoring and Data Analysis for Substations - A Case Study in Implementation - Dolezilek, D.; McDermott, B.;Power Systems Conference: Advanced Metering, Protection, Control, Communication, and Distributed Resources, 2006. PS '06,14-17 March 2006 Page(s):496 - 500 5. Advanced SCADA concepts - Sciacca, S.C.; Block, W.R.; Computer Applications in Power, IEEE Volume 8, Issue 1, Jan. 1995 Page(s):23 – 28