Download to read offline


![Step by Step
Create a measure to
aggregate sales for the
top 5 products
We create a Variable to
identify the top 5
products, and a
separate variable to
aggregate the sales
amount
This makes the DAX
easier to follow
Top 5 Products Sales =
VAR TopNProducts =
TOPN (
5,
SUMMARIZE(Sales,
'Product'[Product],"SALESVALUE",sum(Sales[Sales Amount])),
[SALESVALUE],desc
)
VAR Result =
CALCULATE (
SUM(Sales[Sales Amount]),
TopNProducts
)
RETURN Result](https://image.slidesharecdn.com/powerbitipstopnmeasures-221103082734-9c330170/85/Power-BI-Tips-Top-N-Measures-pptx-3-320.jpg)
![DAX Breakdown
SUMMARIZE creates subtotals, in this case a column with each ‘Product’
and a second column for the total sales
SUMMARIZE(Sales, 'Product'[Product],"SALESVALUE",sum(Sales[Sales
Amount]))
TOPN – The ‘5’ sets how many top rows to return
We use the summarise row to define the data rows (see above)
The last row defines the field to sort by (SALESVALUE in Descending order)
TOPN (
5,
SUMMARIZE(Sales, 'Product'[Product],"SALESVALUE",sum(Sales[Sales
Amount])),
[SALESVALUE],desc](https://image.slidesharecdn.com/powerbitipstopnmeasures-221103082734-9c330170/85/Power-BI-Tips-Top-N-Measures-pptx-4-320.jpg)
![DAX Breakdown
Next we calculate the Sum of Sales for each Product in the Top N products
VAR Result =
CALCULATE (
SUM(Sales[Sales Amount]),
TopNProducts
)](https://image.slidesharecdn.com/powerbitipstopnmeasures-221103082734-9c330170/85/Power-BI-Tips-Top-N-Measures-pptx-5-320.jpg)
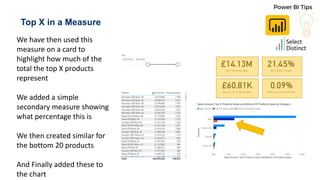


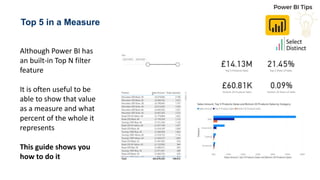
This document provides a step-by-step guide on creating a DAX measure in Power BI to show the sales of the top 5 products and calculate their percentage of total sales. It explains the use of the TOPN function to identify the top products and how to aggregate their sales values for display. The guide also mentions the creation of additional measures for the bottom 20 products and encourages readers to visit the website for more tips.