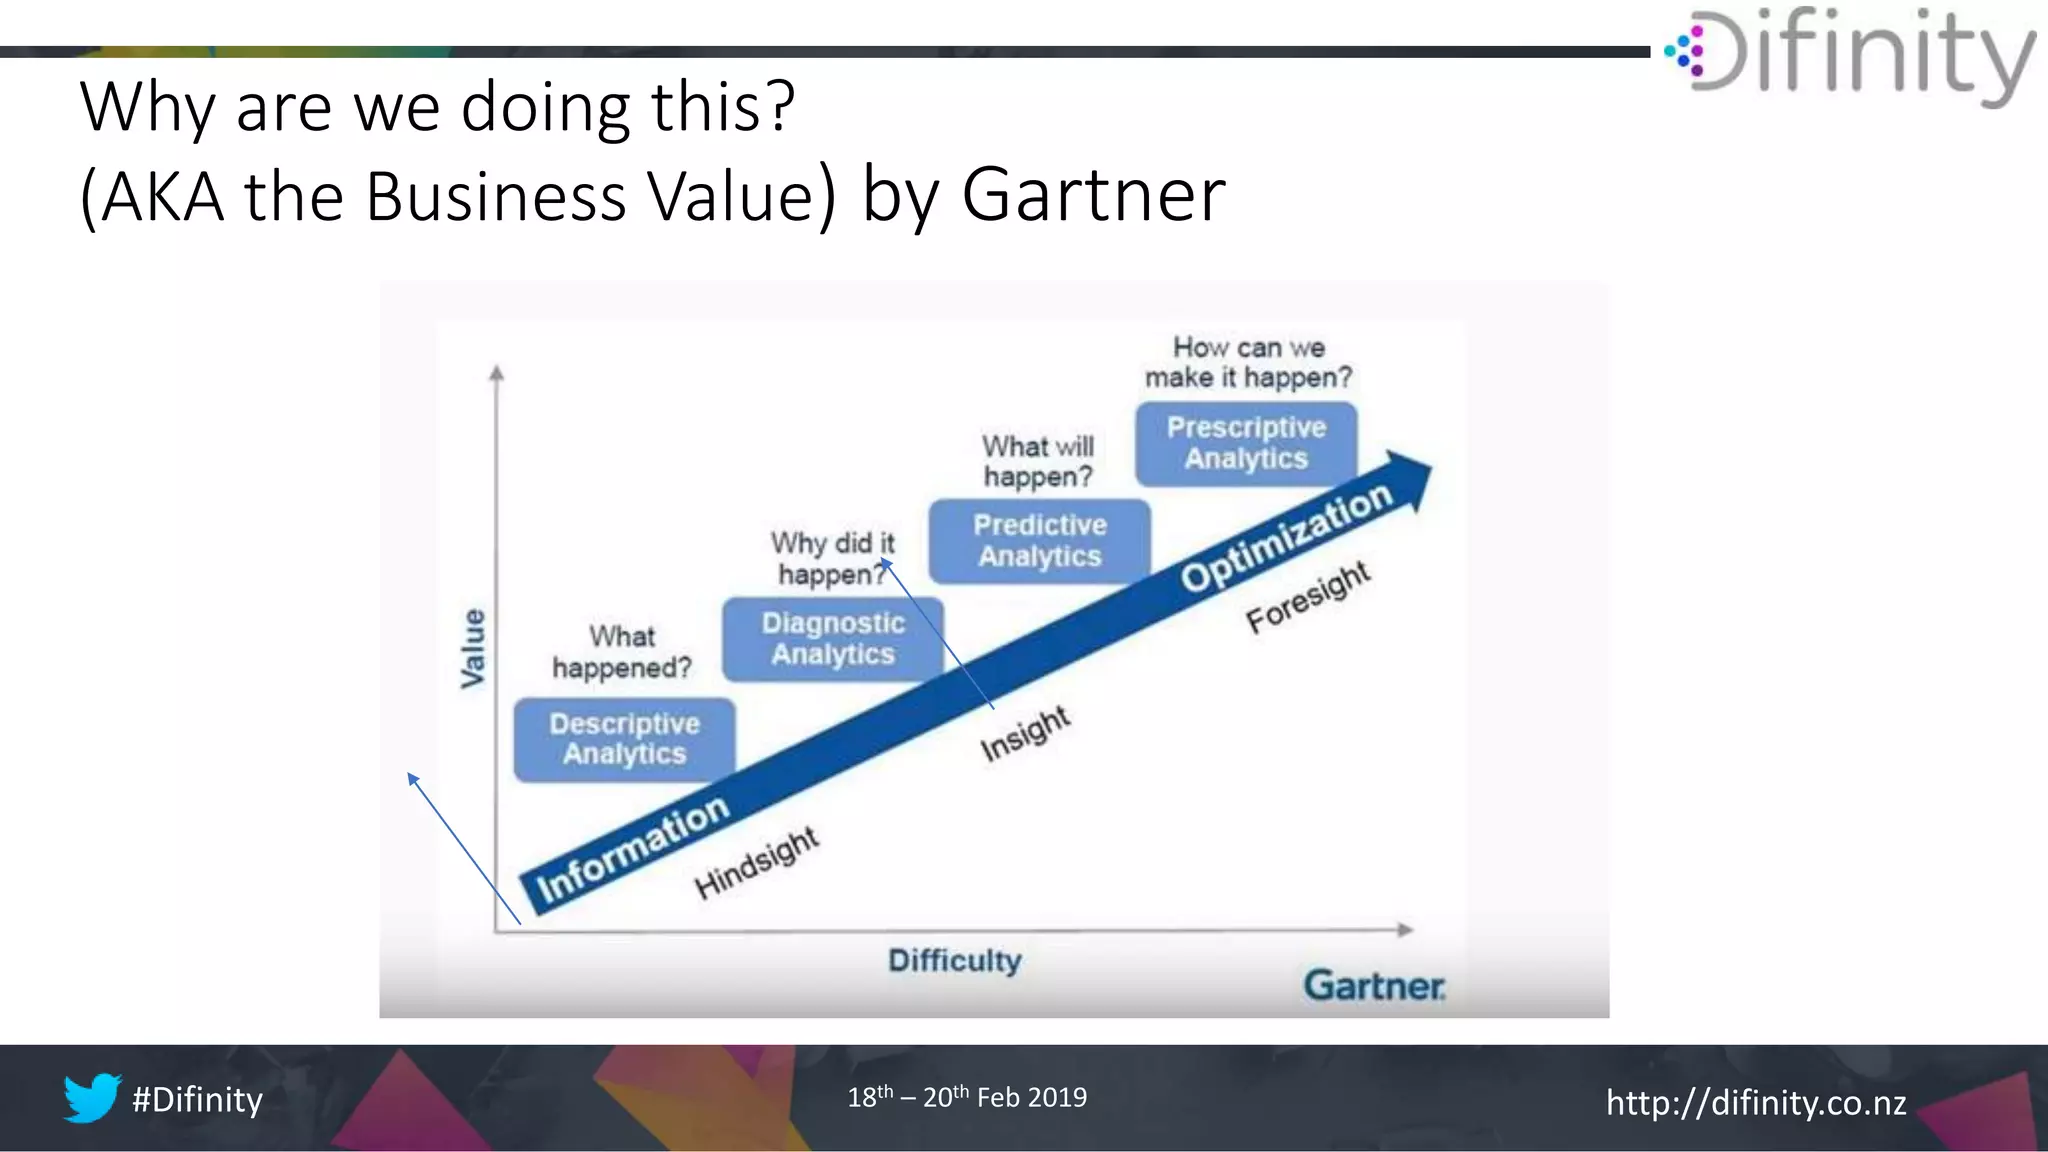
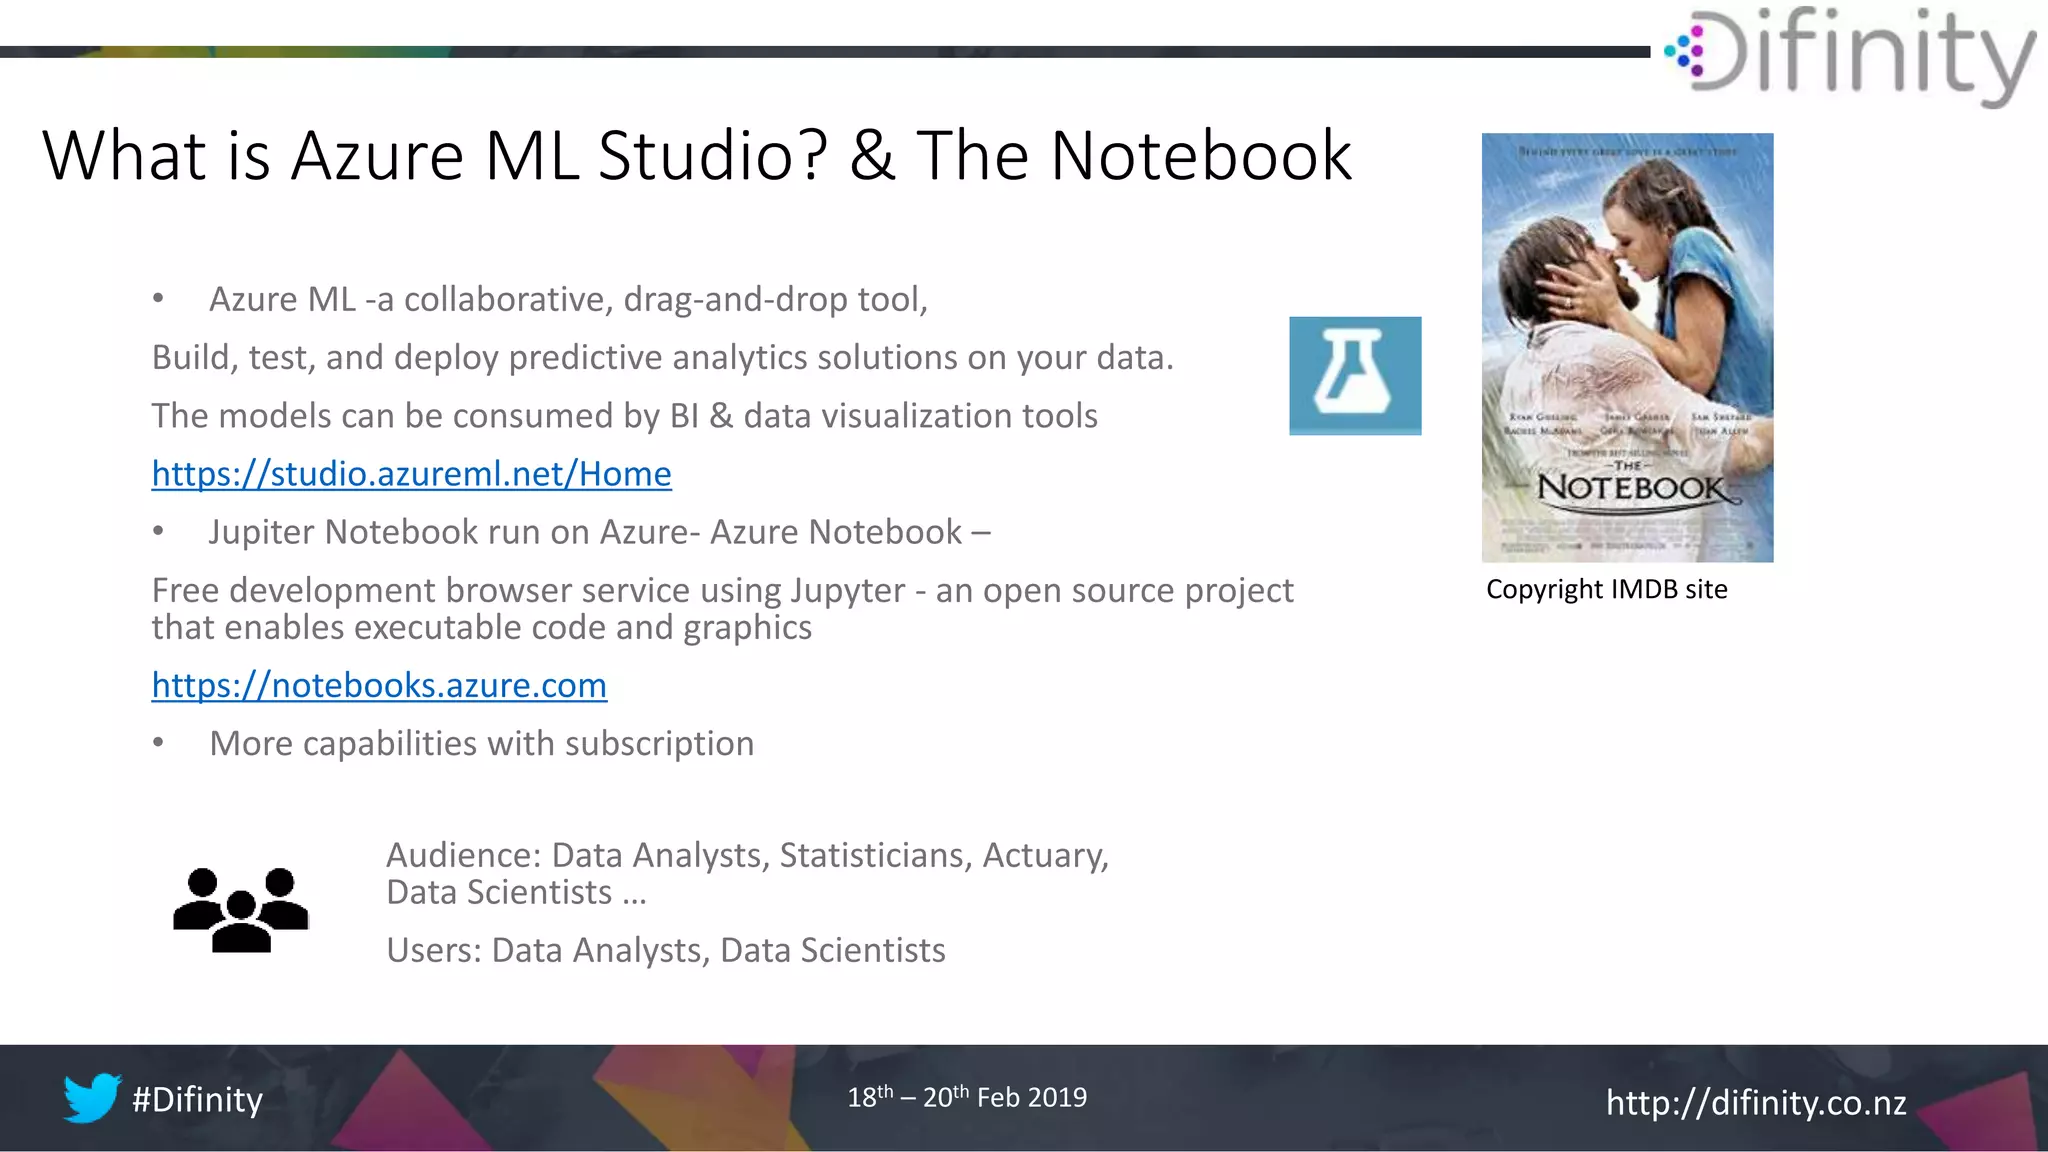
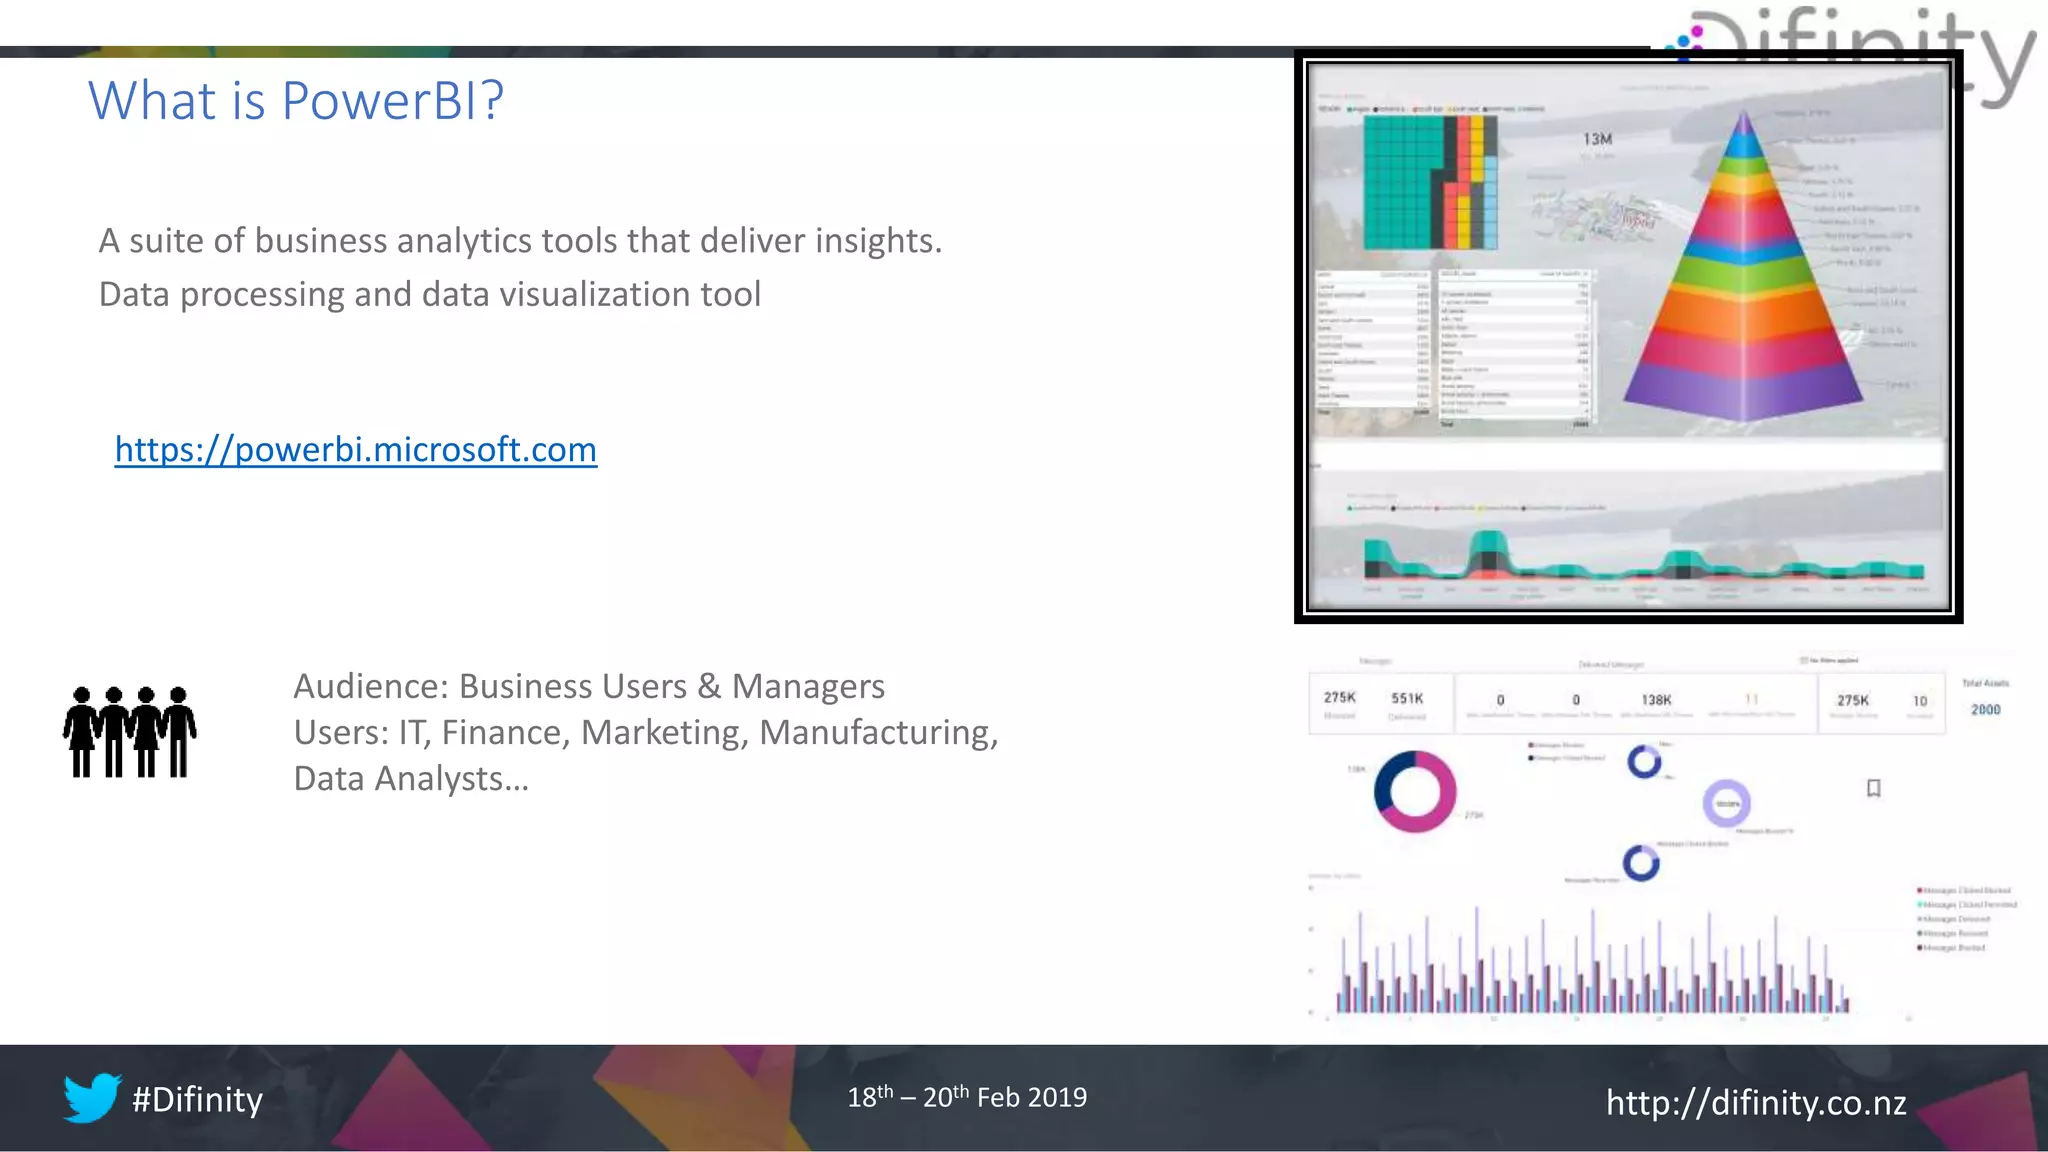
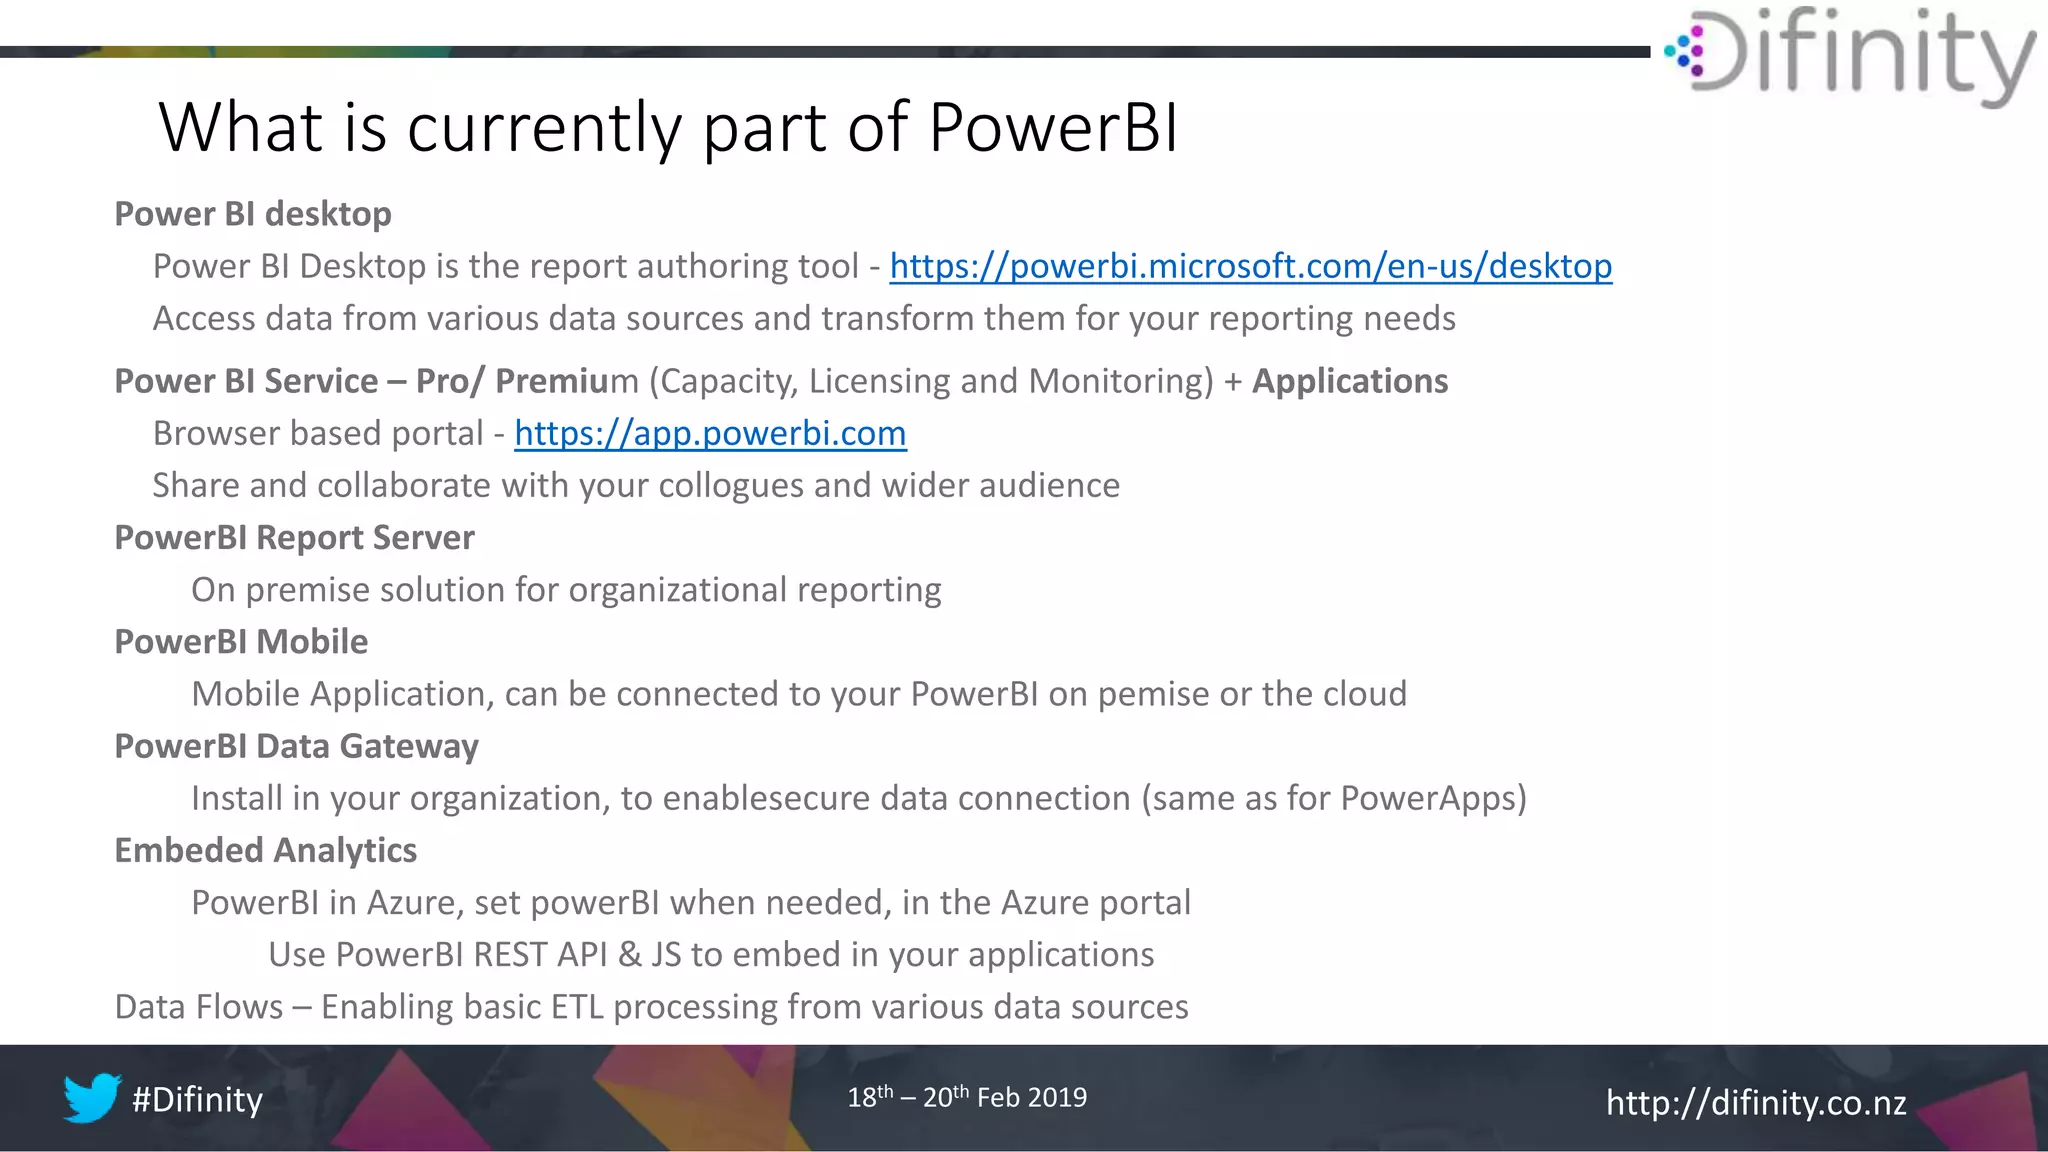
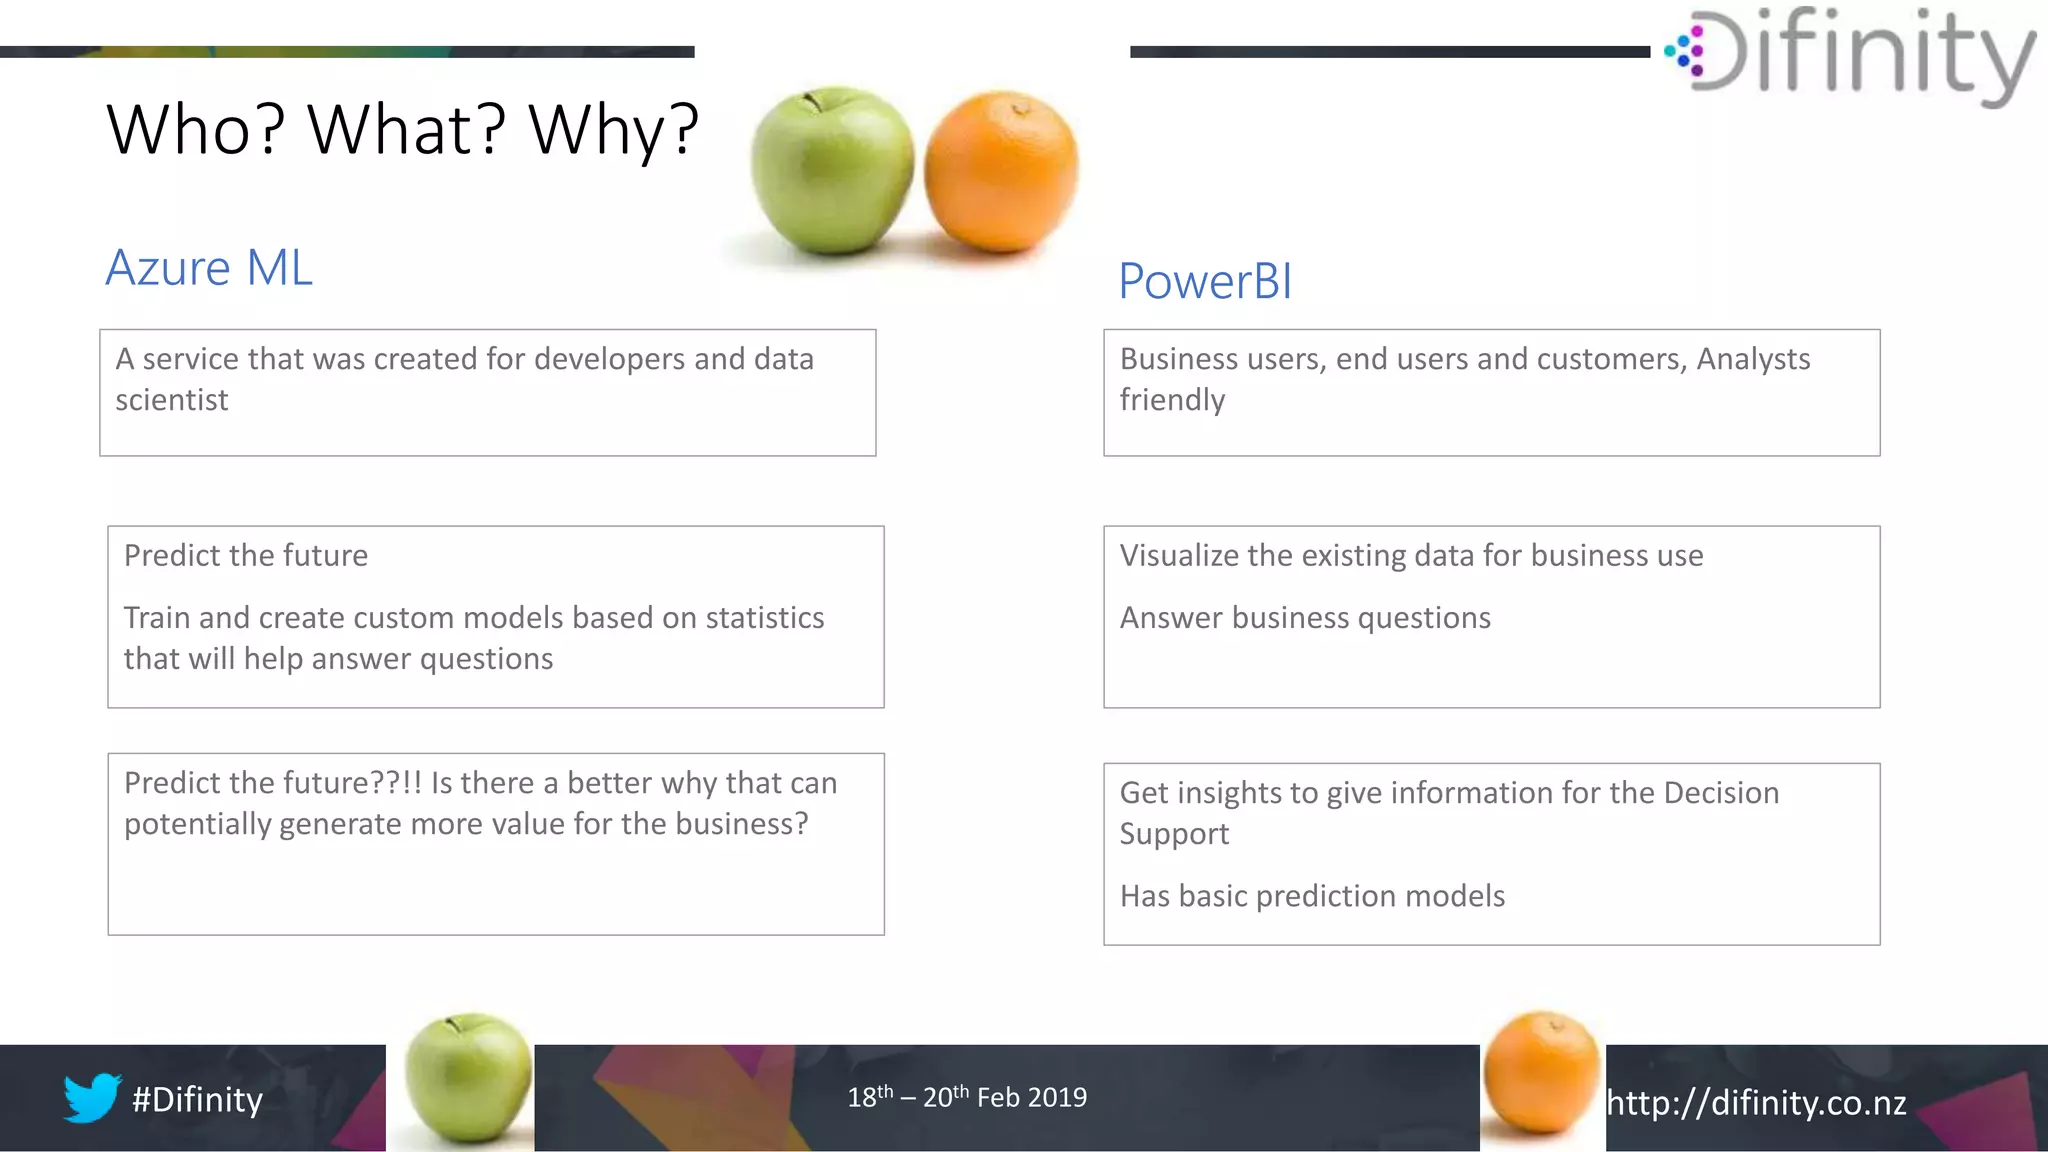
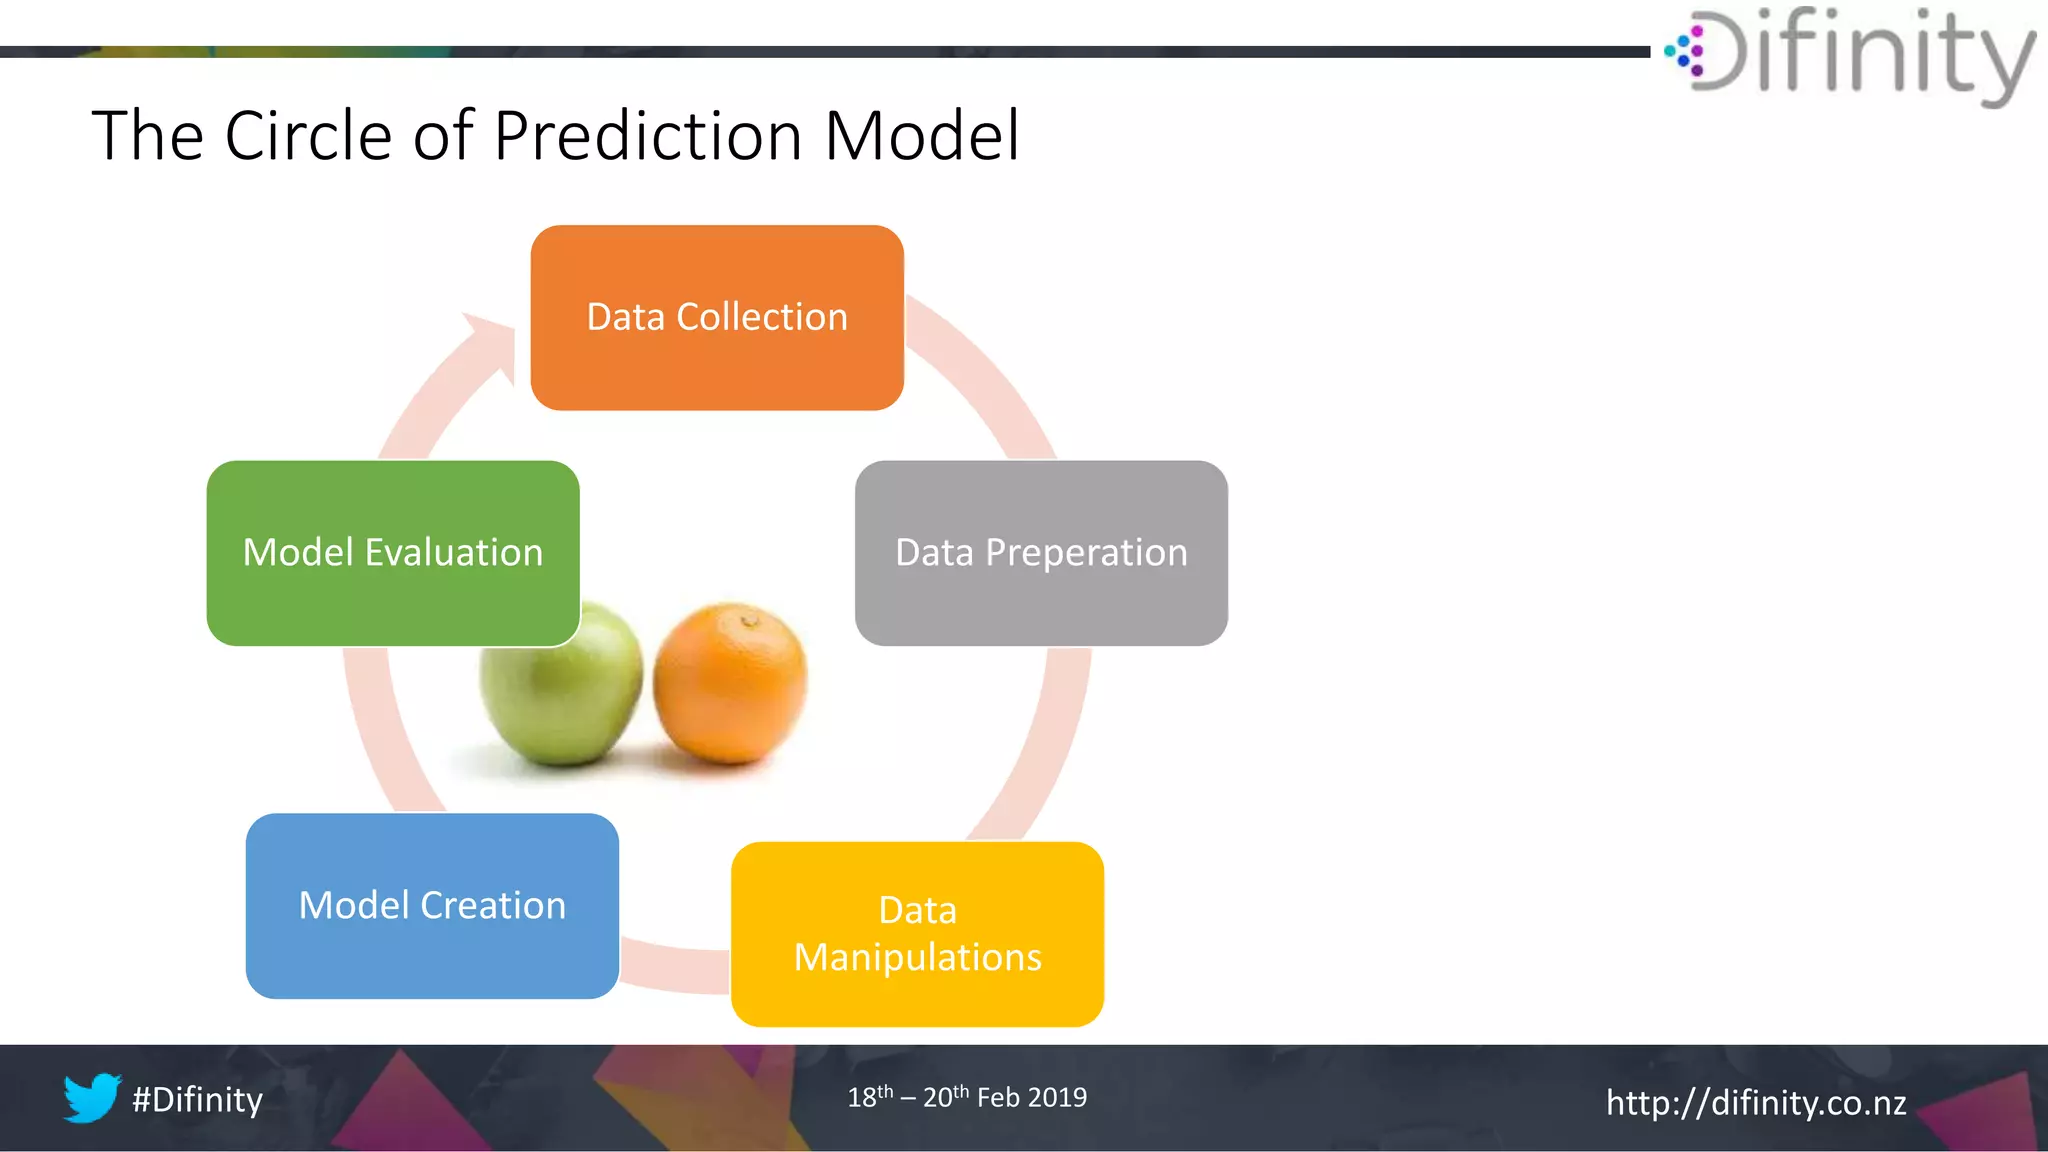
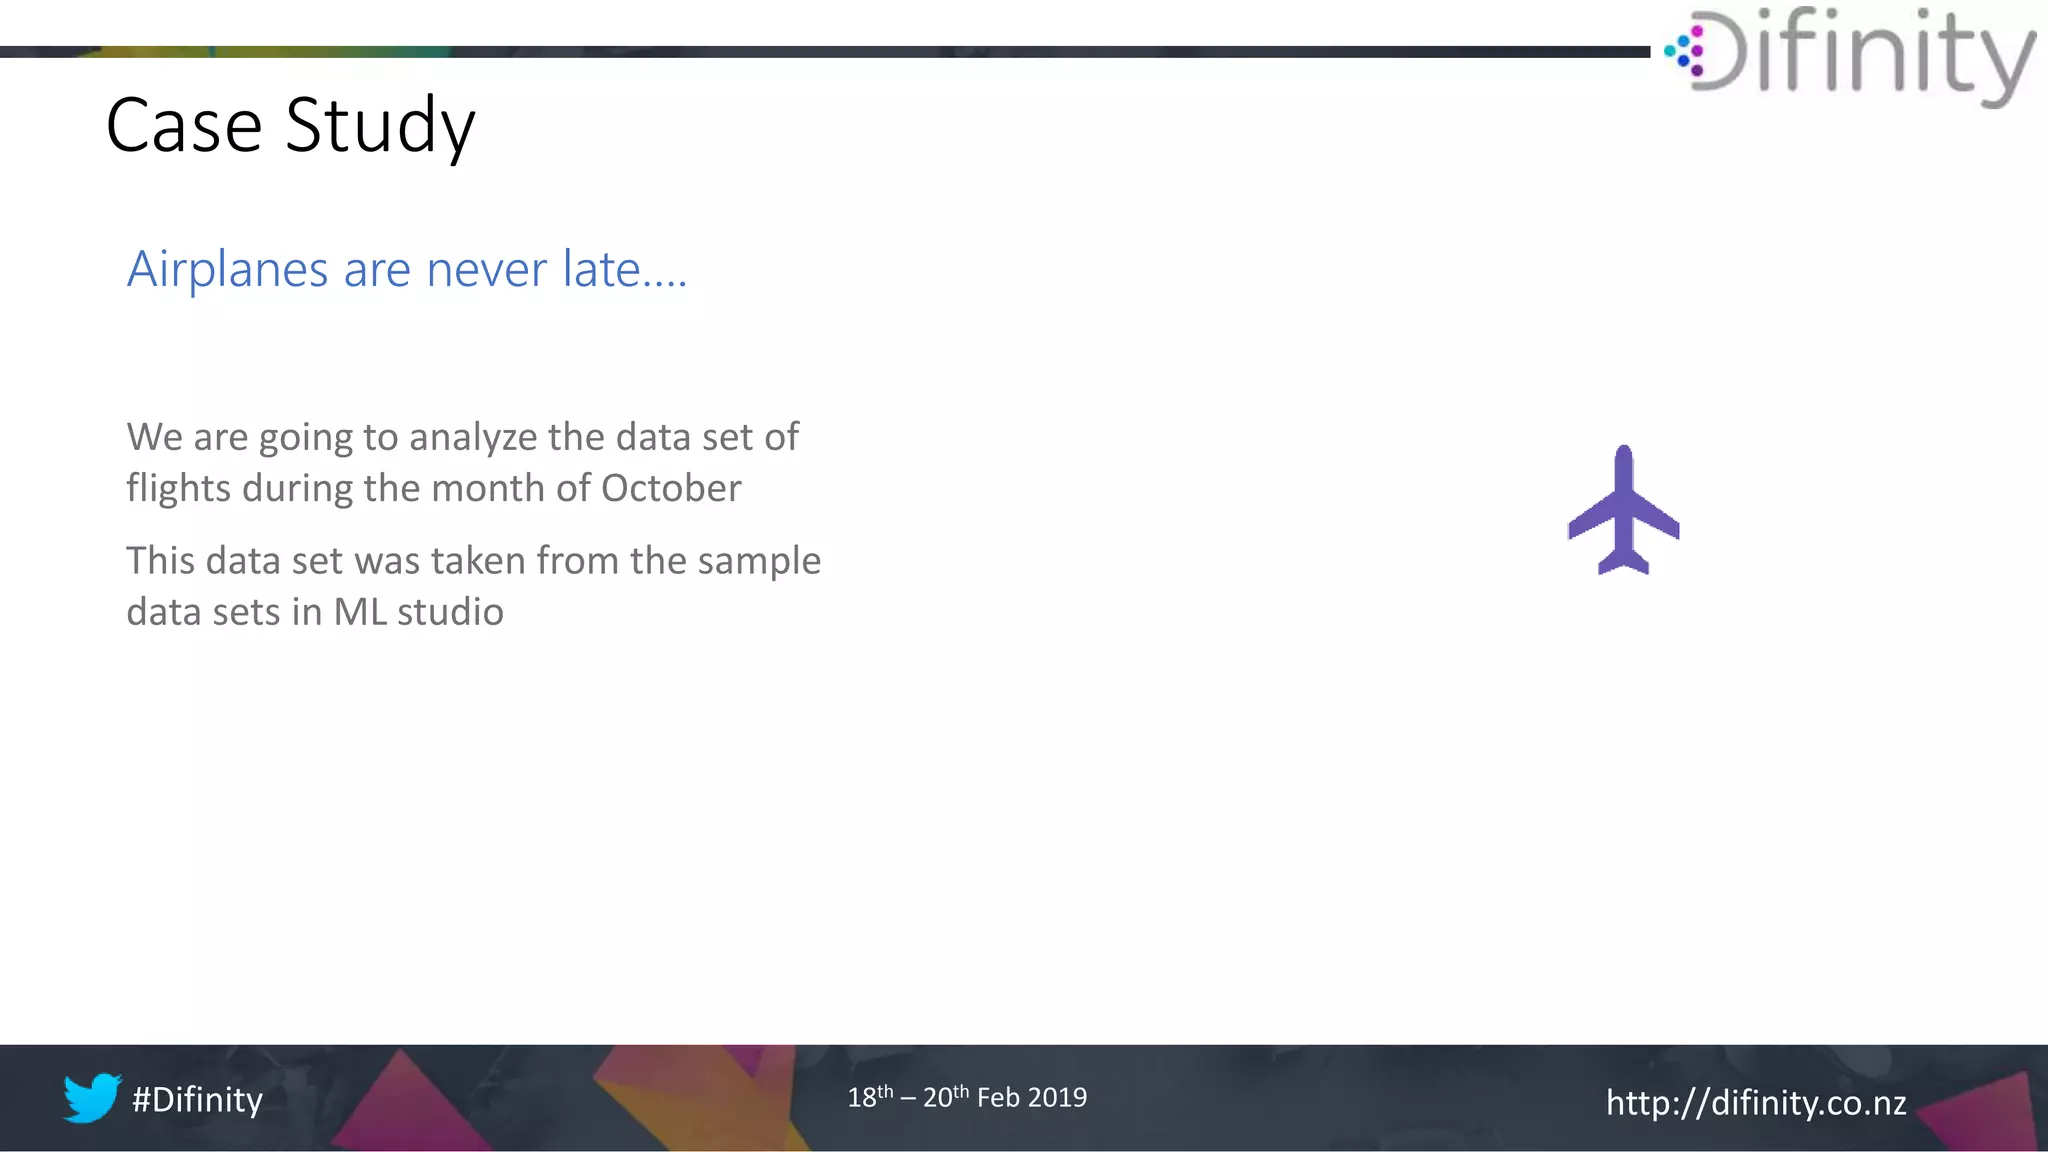
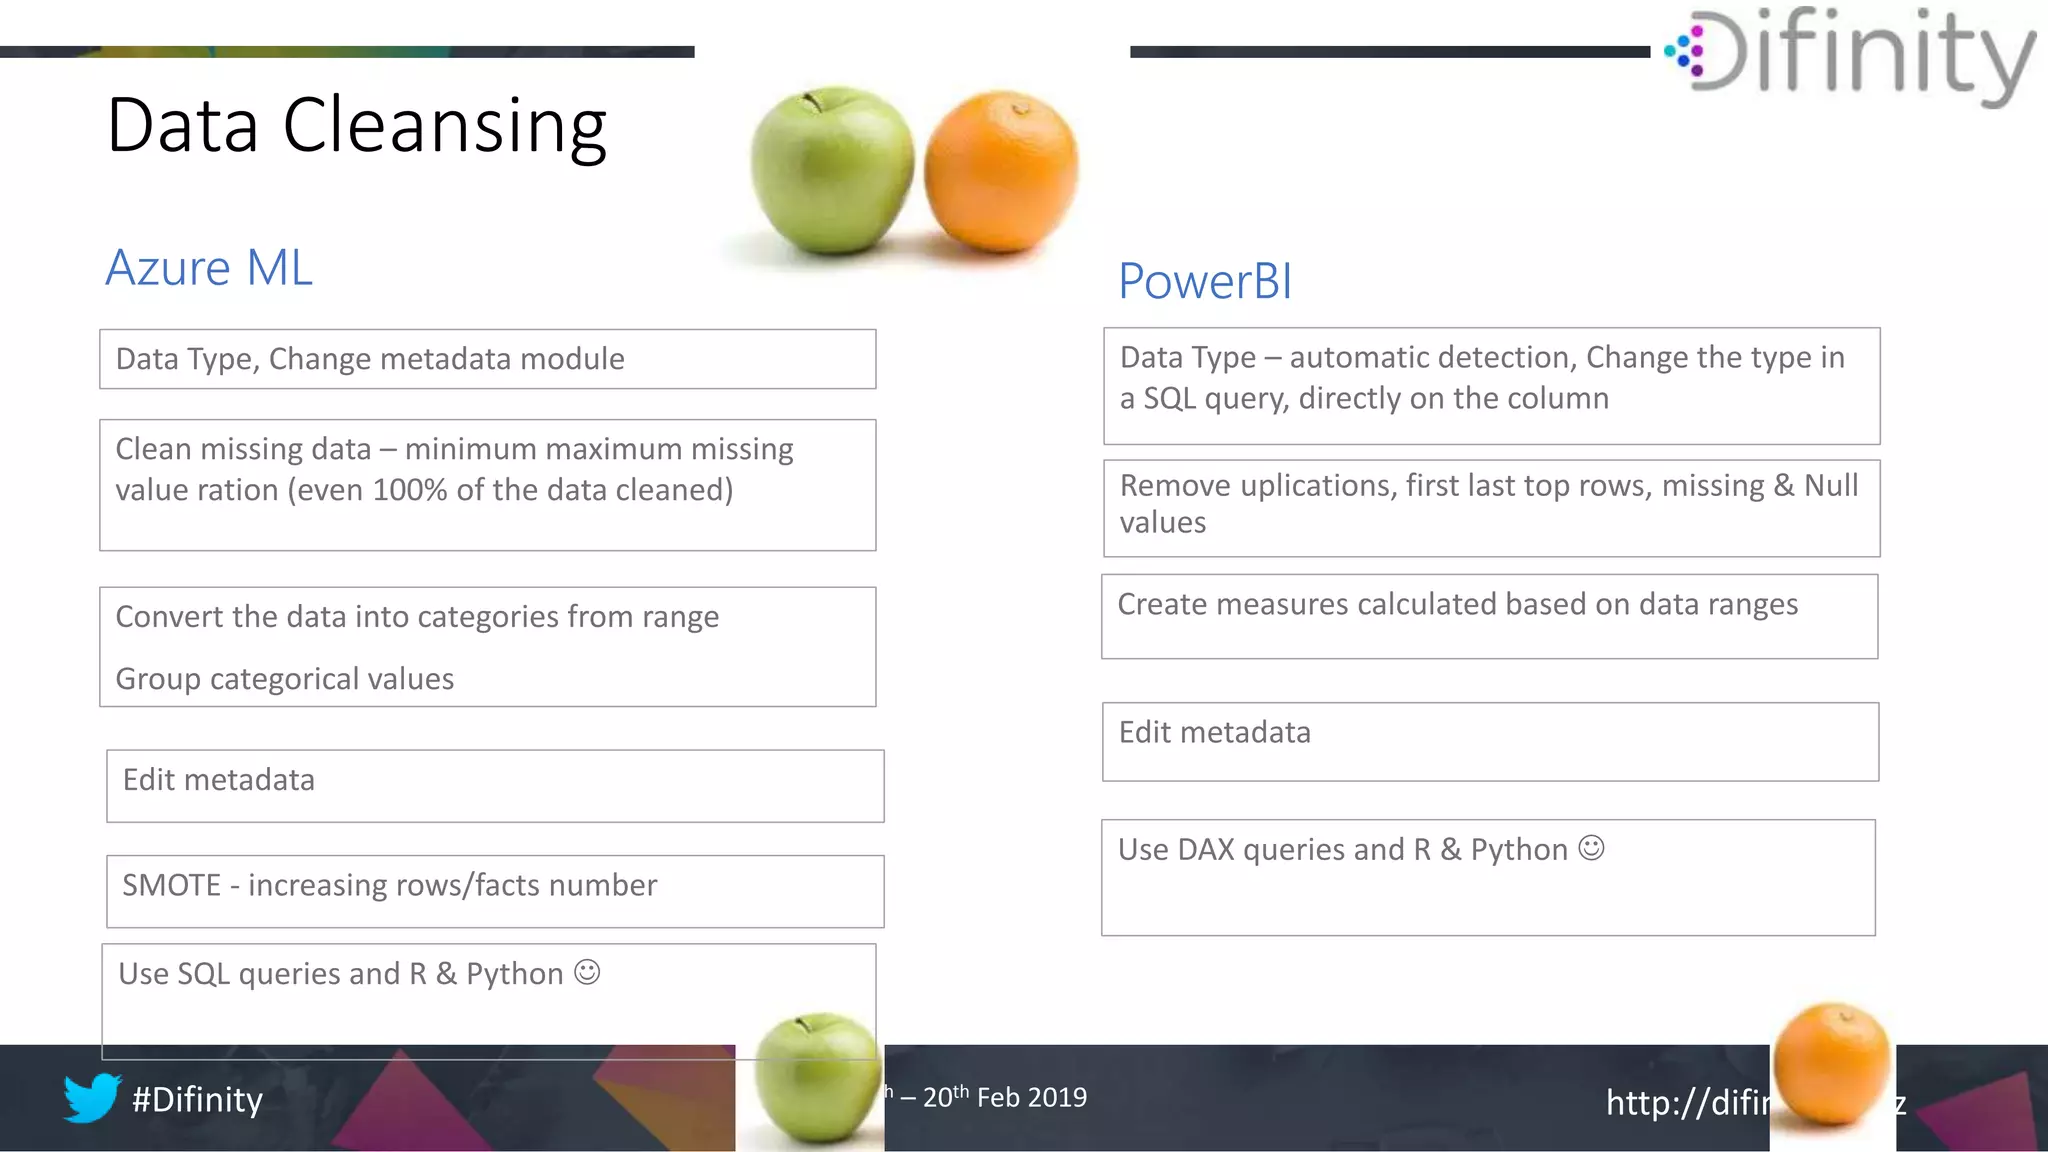
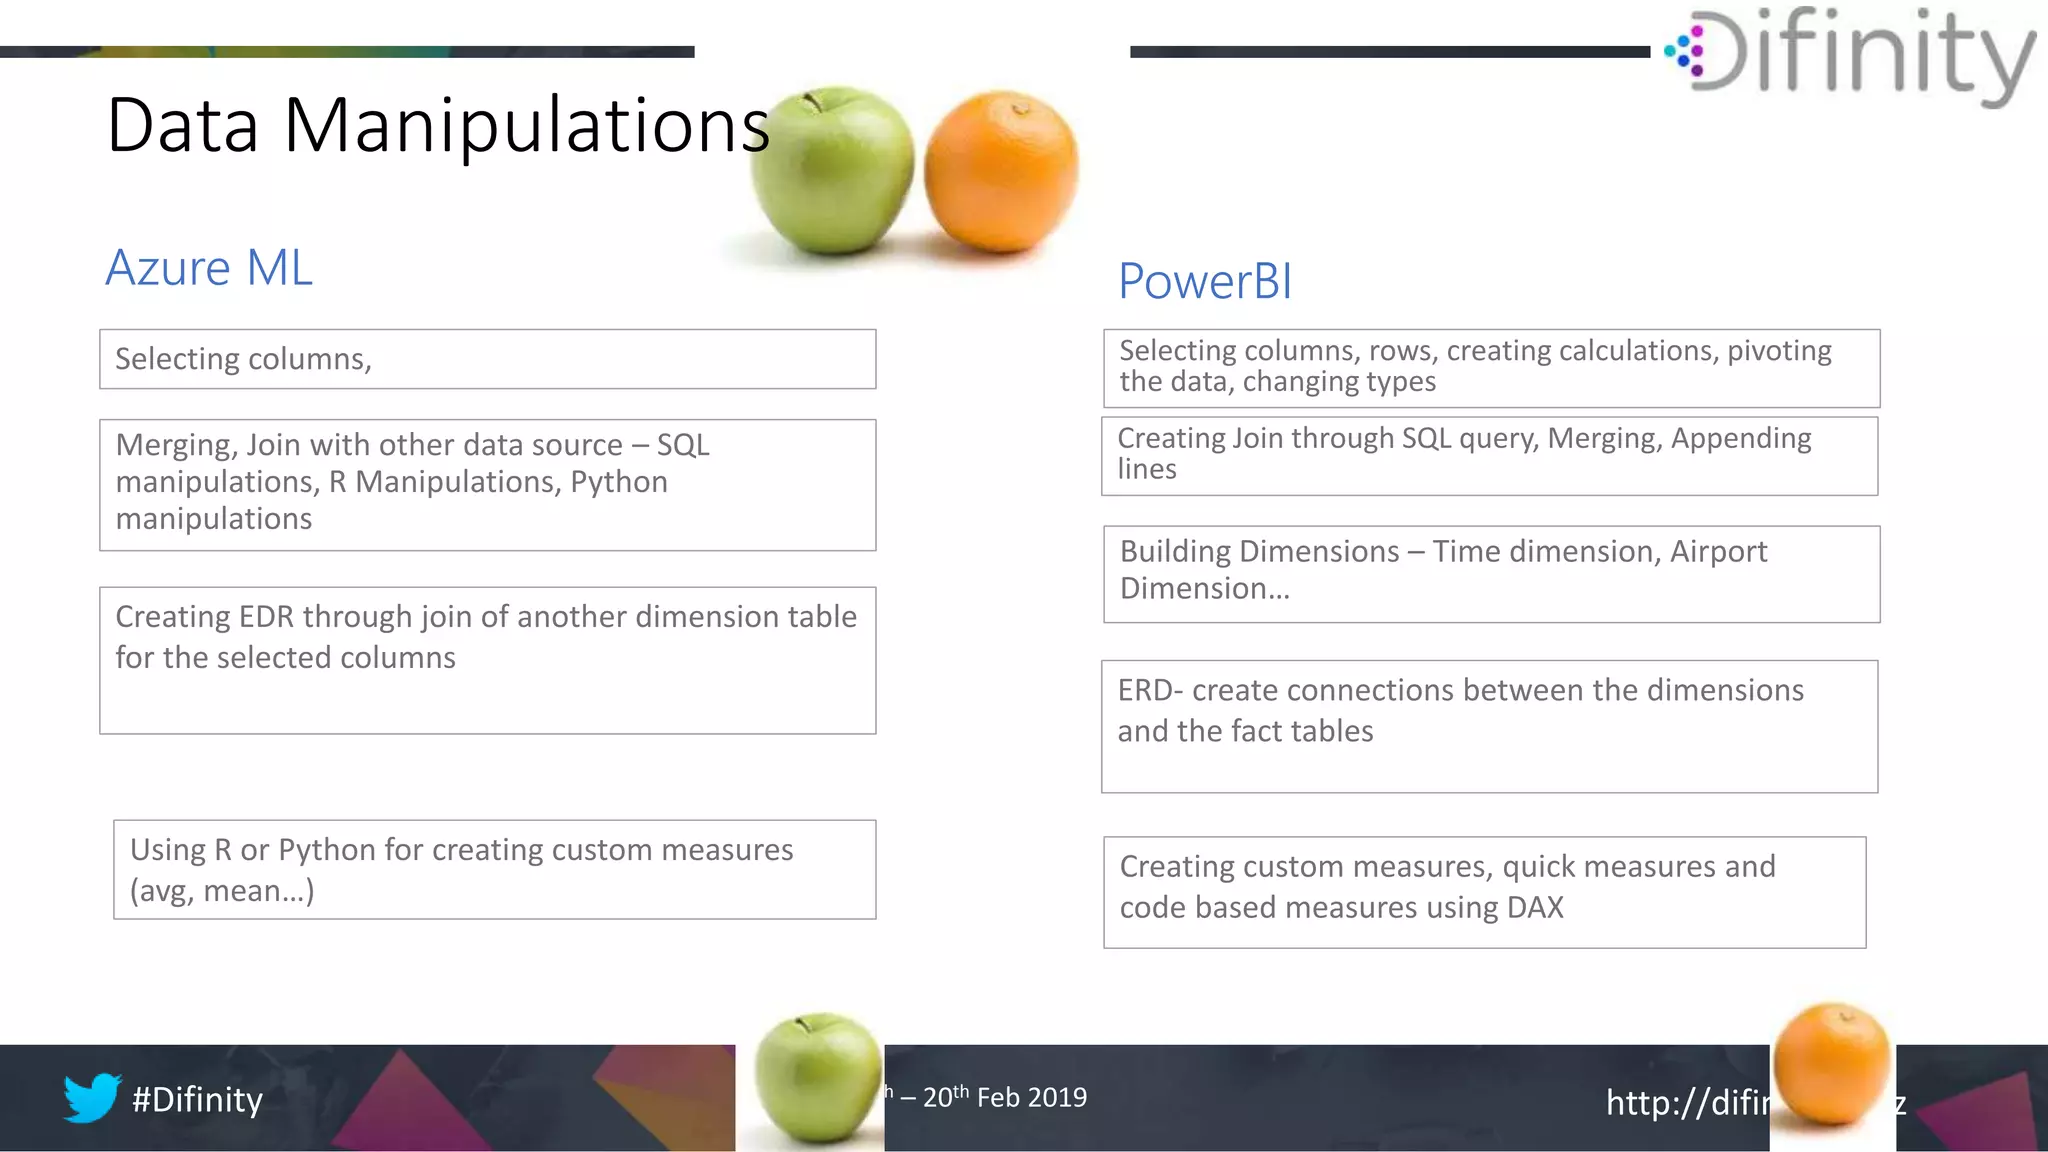
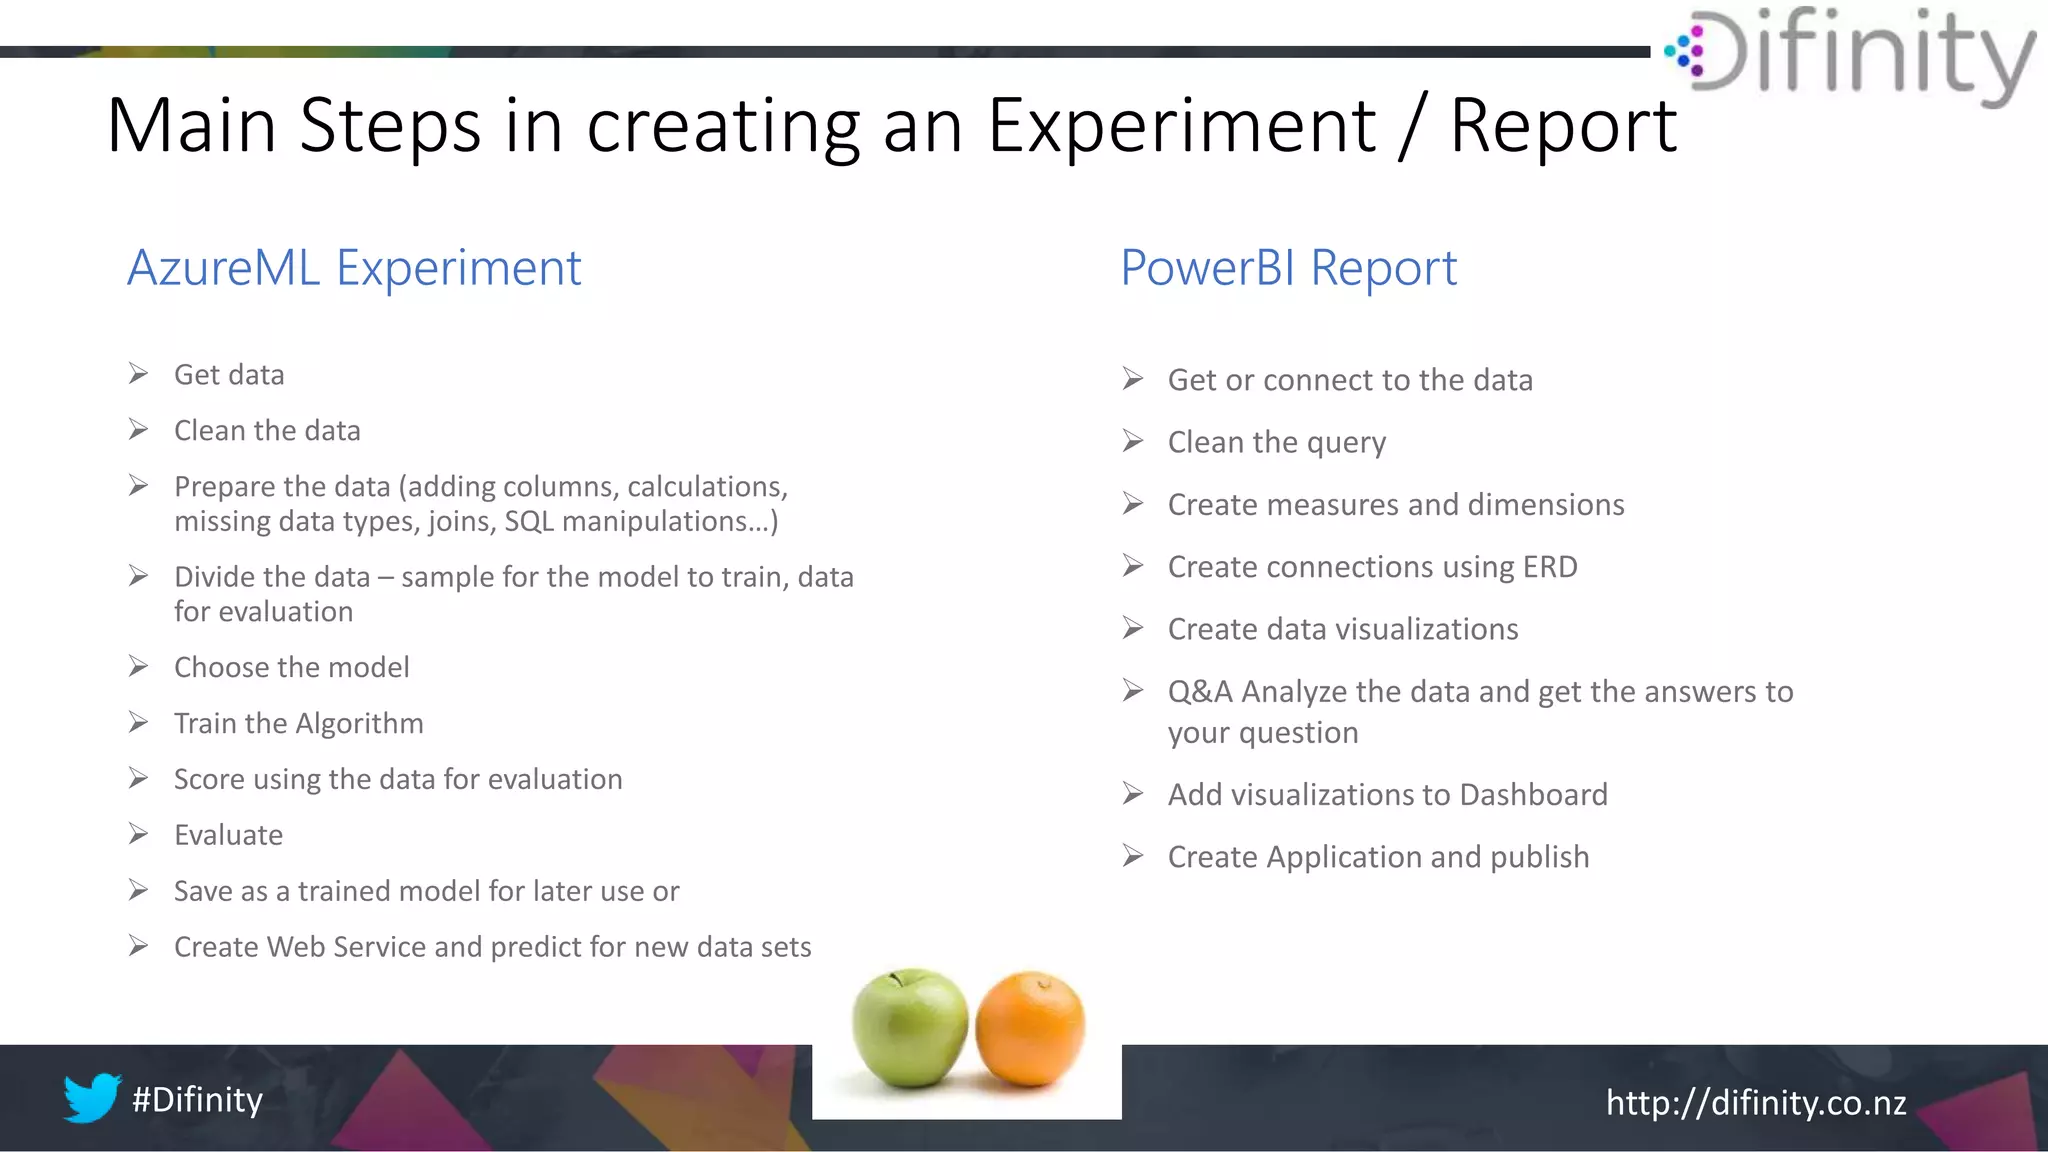
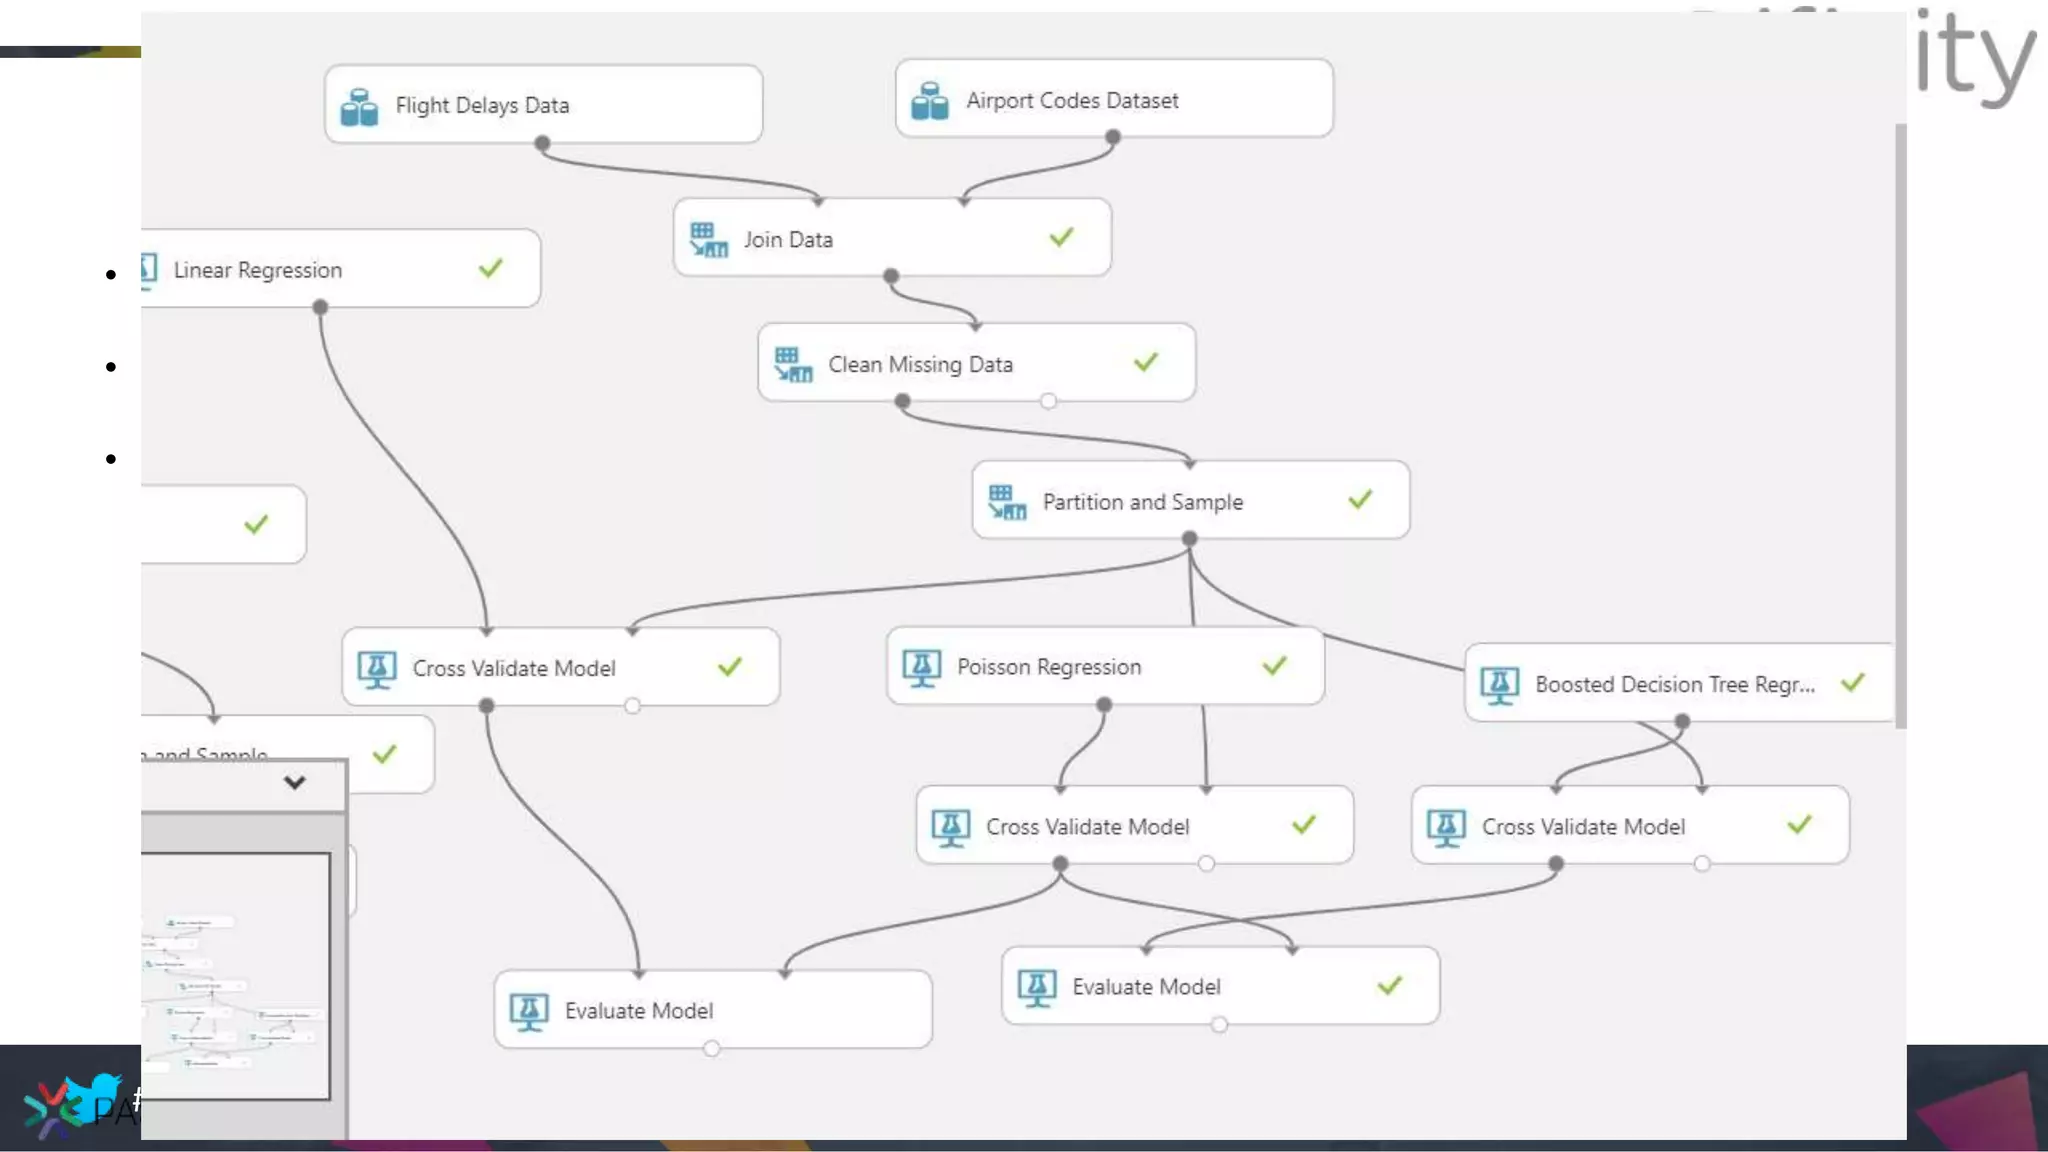
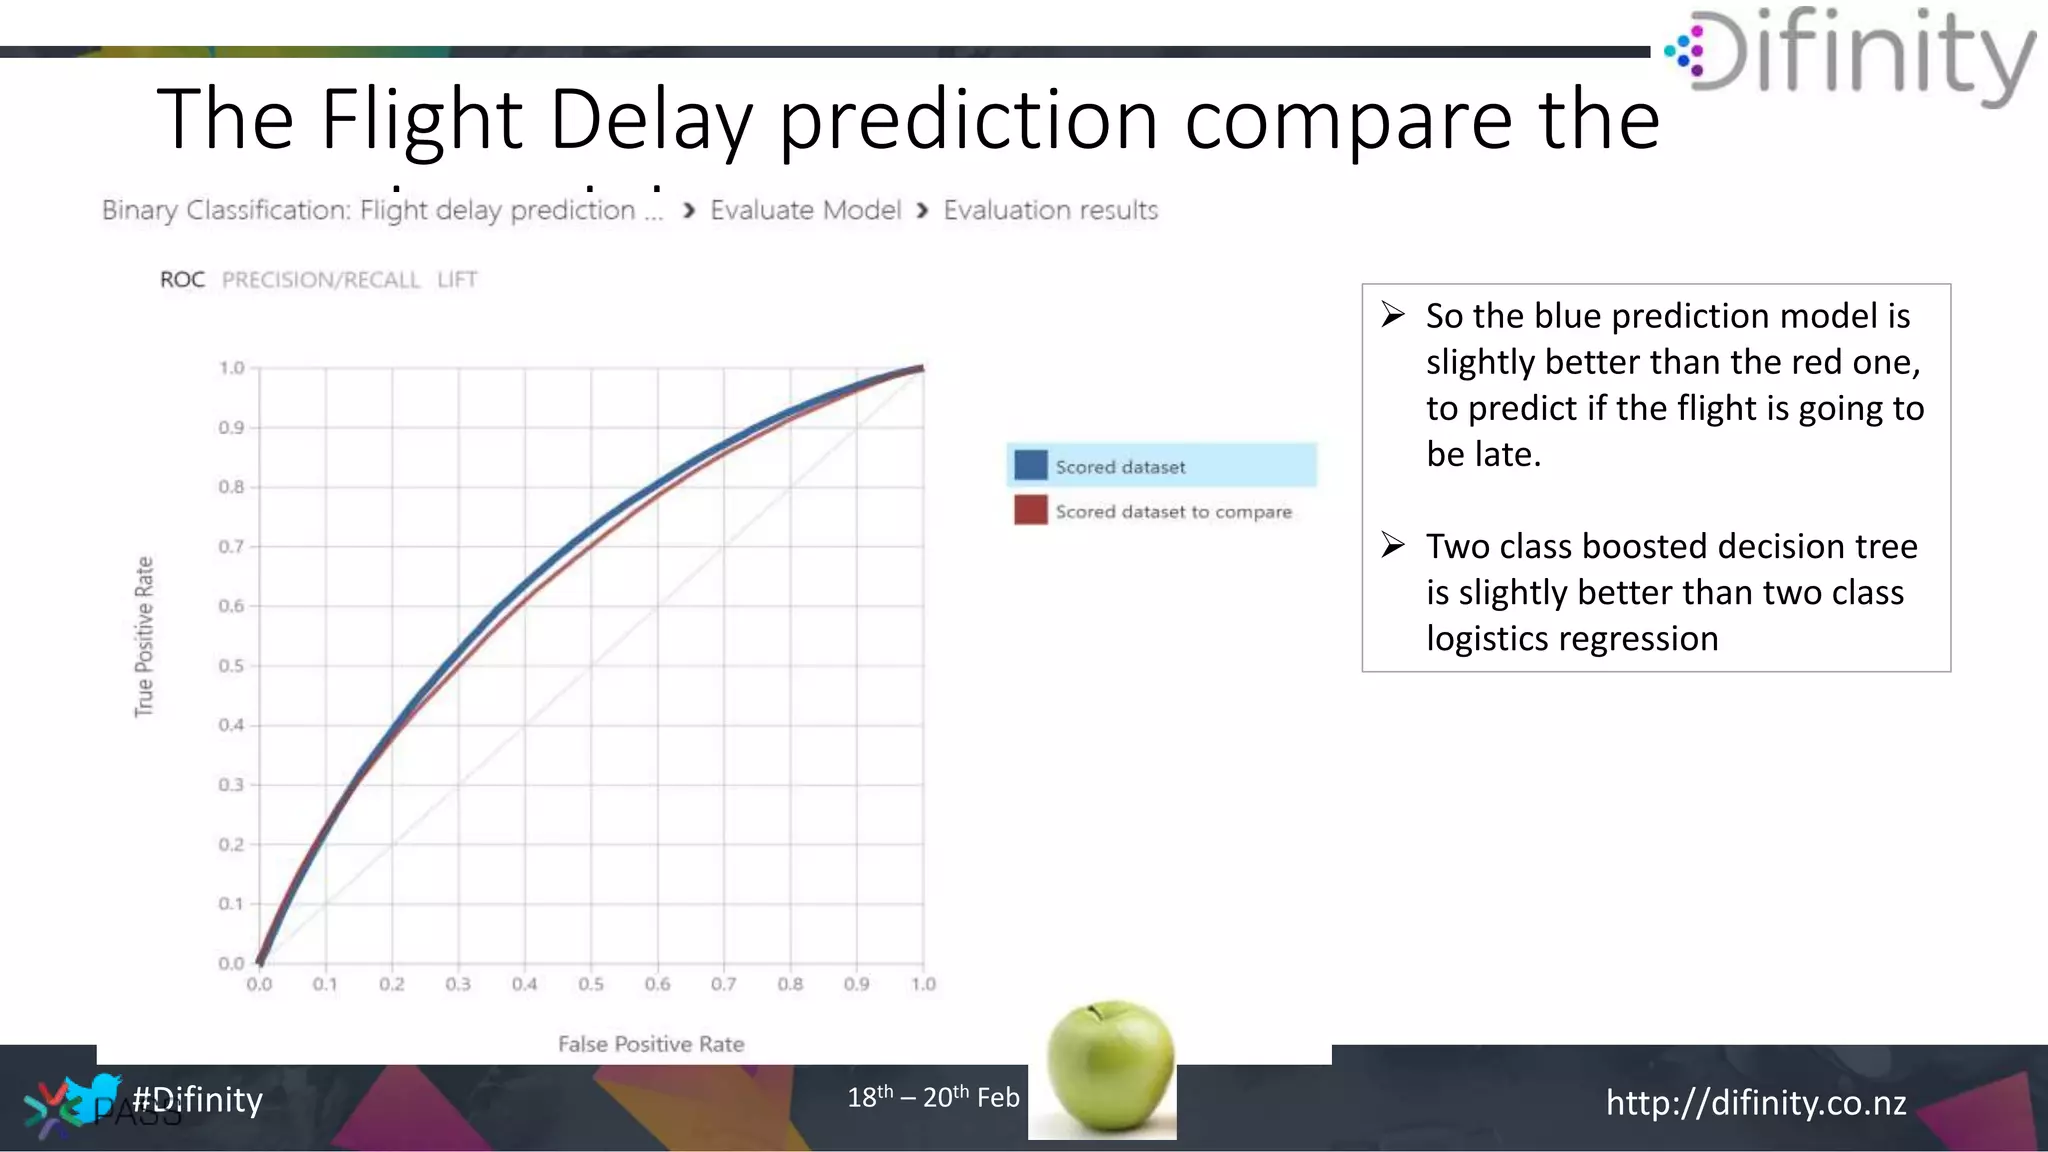
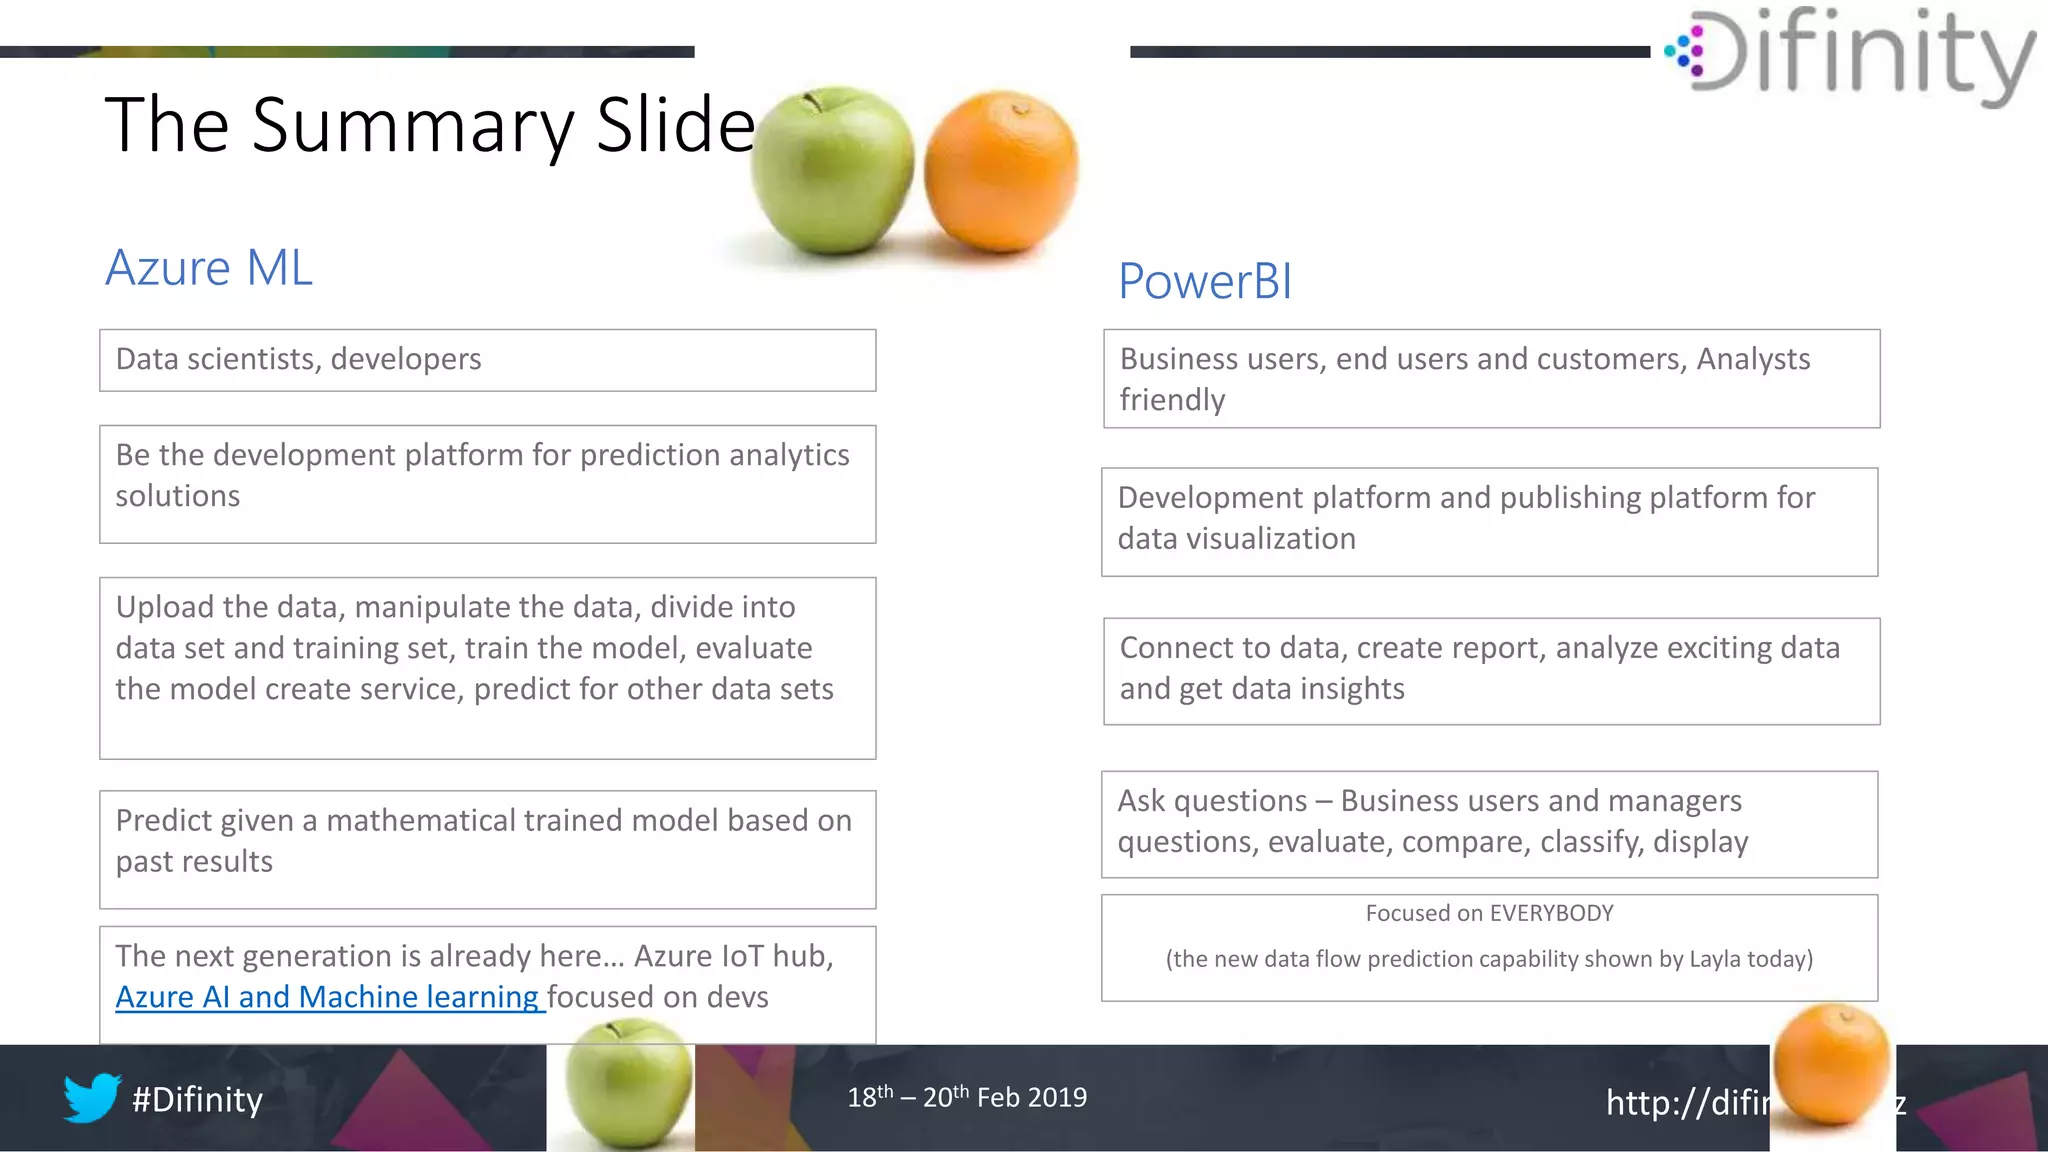
http://difinity.co.nz#Difinity 18th – 20th Feb 2019
Welcome
Auckland, New Zealand
18-20 February 2019
http://difinity.co.nz#Difinity 18th – 20th Feb 2019
Azure Machine Learning
Studio vs. Power BI
Yana Berkovich, Microsoft MVP, Consultant BI Dev lead –
Finning Canada & Blue Silver Shift Canada
@Yana_Berkovich
http://difinity.co.nz#Difinity 18th – 20th Feb 2019
About Me
BIAnalyst&DEV,DataPlatformMVP
Consultant, ProductManager
MemberofBI,BA,SharePoint, O365,PMcommunities
DataPlatformConsultant -FinningCaterpillar
BlueSilverShift
Experimenting withO365
https://www.linkedin.com/in/yanaberkovich
http://yanaberkovich.com
@Yana_Berkovich
http://difinity.co.nz#Difinity 18th – 20th Feb 2019
from LinkedIn repost couldn’t find the source…
(Gadi Evron)
http://difinity.co.nz#Difinity 18th – 20th Feb 2019
What are we going to talk about today?
(Expectations: This is level 101…)
AzureML Lab & Azure Notebook vs PowerBI
Getting the Data
Processing the Data
The prediction model
Sample, population and your data set
Example - Exponential Smoothing Method
Quick Summary
http://difinity.co.nz#Difinity 18th – 20th Feb 2019
Why are we doing this?
(AKA the Business Value) by Gartner
http://difinity.co.nz#Difinity 18th – 20th Feb 2019
What is Azure ML Studio? & The Notebook
• Azure ML -a collaborative, drag-and-drop tool,
Build, test, and deploy predictive analytics solutions on your data.
The models can be consumed by BI & data visualization tools
https://studio.azureml.net/Home
• Jupiter Notebook run on Azure- Azure Notebook –
Free development browser service using Jupyter - an open source project
that enables executable code and graphics
https://notebooks.azure.com
• More capabilities with subscription
Audience: Data Analysts, Statisticians, Actuary,
Data Scientists …
Users: Data Analysts, Data Scientists
Copyright IMDB site
http://difinity.co.nz#Difinity 18th – 20th Feb 2019
A suite of business analytics tools that deliver insights.
Data processing and data visualization tool
https://powerbi.microsoft.com
What is PowerBI?
Audience: Business Users & Managers
Users: IT, Finance, Marketing, Manufacturing,
Data Analysts…
http://difinity.co.nz#Difinity 18th – 20th Feb 2019
What is currently part of PowerBI
Power BI desktop
Power BI Desktop is the report authoring tool - https://powerbi.microsoft.com/en-us/desktop
Access data from various data sources and transform them for your reporting needs
Power BI Service – Pro/ Premium (Capacity, Licensing and Monitoring) + Applications
Browser based portal - https://app.powerbi.com
Share and collaborate with your collogues and wider audience
PowerBI Report Server
On premise solution for organizational reporting
PowerBI Mobile
Mobile Application, can be connected to your PowerBI on pemise or the cloud
PowerBI Data Gateway
Install in your organization, to enablesecure data connection (same as for PowerApps)
Embeded Analytics
PowerBI in Azure, set powerBI when needed, in the Azure portal
Use PowerBI REST API & JS to embed in your applications
Data Flows – Enabling basic ETL processing from various data sources
http://difinity.co.nz#Difinity 18th – 20th Feb 2019
Azure ML
A service that was created for developers and data
scientist
Business users, end users and customers, Analysts
friendly
Predict the future
Train and create custom models based on statistics
that will help answer questions
Visualize the existing data for business use
Answer business questions
Predict the future??!! Is there a better why that can
potentially generate more value for the business?
PowerBI
Get insights to give information for the Decision
Support
Has basic prediction models
Who? What? Why?
http://difinity.co.nz#Difinity 18th – 20th Feb 2019
Getting the data
http://difinity.co.nz#Difinity 18th – 20th Feb 2019
The Circle of Prediction Model
Data Collection
Data Preperation
Data
Manipulations
Model Creation
Model Evaluation
http://difinity.co.nz#Difinity 18th – 20th Feb 2019
IT all starts with the right question and Business Goal!
(and a presentation…)
http://difinity.co.nz#Difinity 18th – 20th Feb 2019
Case Study
Airplanes are never late….
We are going to analyze the data set of
flights during the month of October
This data set was taken from the sample
data sets in ML studio
http://difinity.co.nz#Difinity 18th – 20th Feb 2019
Where did I get the data to start?
• Sample Data to use with PowerBI
https://docs.microsoft.com/en-us/power-bi/sample-datasets
• In the ML Studio – there are sample data sets to practice
• SQL data sets for testing and prototyping
https://docs.microsoft.com/en-us/azure/sql-database/sql-database-public-data-sets
• EdEx – Certification programs for Machine Learning
• Kaggel - https://www.kaggle.com/ - the place for data science
http://difinity.co.nz#Difinity 18th – 20th Feb 2019
Get the Data
Azure ML Lab PowerBI
Data set CSV file, txt, Excel, Hive table, SQL table,
Odata, SVMlight, Zip, R object
Source – CSV file in this case,
More than a 100 different sources
Source Type
Data Delimiter
Data connection and refresh
http://difinity.co.nz#Difinity 18th – 20th Feb 2019
Visualizing the Data
Azure ML Lab PowerBI
Data Preview
Histograms, box plots
Raw data
This is the main goal of this tool – Data visualization
Recently, similar automatic visualizations
Data view for all the visualizations click the
Aggregated data
http://difinity.co.nz#Difinity 18th – 20th Feb 2019
Visualizing the Data PowerBI – Quick Insights
Quick insights mode
Quick insights mode
http://difinity.co.nz#Difinity 18th – 20th Feb 2019
Cleaning and preparing the data
http://difinity.co.nz#Difinity 18th – 20th Feb 2019
Azure ML
Data Type, Change metadata module Data Type – automatic detection, Change the type in
a SQL query, directly on the column
Clean missing data – minimum maximum missing
value ration (even 100% of the data cleaned) Remove uplications, first last top rows, missing & Null
values
Use DAX queries and R & Python 
PowerBI
Create measures calculated based on data ranges
Data Cleansing
Convert the data into categories from range
Group categorical values
Edit metadata
SMOTE - increasing rows/facts number
Edit metadata
Use SQL queries and R & Python 
http://difinity.co.nz#Difinity 18th – 20th Feb 2019
Azure ML
Selecting columns, Selecting columns, rows, creating calculations, pivoting
the data, changing types
Merging, Join with other data source – SQL
manipulations, R Manipulations, Python
manipulations
Building Dimensions – Time dimension, Airport
Dimension…
Creating custom measures, quick measures and
code based measures using DAX
PowerBI
ERD- create connections between the dimensions
and the fact tables
Data Manipulations
Creating Join through SQL query, Merging, Appending
lines
Creating EDR through join of another dimension table
for the selected columns
Using R or Python for creating custom measures
(avg, mean…)
http://difinity.co.nz#Difinity 18th – 20th Feb 2019
Azure ML
Only if you build a model for that
Out of the box visualization for the data set with 2
graphic options as previously mentioned
Q&A functionality recently available on desktop
Looks very similar to the visualizations that exist in
ML lab
Enables the user to add the FAQ visualization to the
dashboard or report
“native” language questions answered-
What is the most late flight from Chicago airport?
PowerBI
Data Manipulations
http://difinity.co.nz#Difinity 18th – 20th Feb 2019
The prediction model
http://difinity.co.nz#Difinity 18th – 20th Feb 2019
Main Steps in creating an Experiment / Report
AzureML Experiment PowerBI Report
 Get data
 Clean the data
 Prepare the data (adding columns, calculations,
missing data types, joins, SQL manipulations…)
 Divide the data – sample for the model to train, data
for evaluation
 Choose the model
 Train the Algorithm
 Score using the data for evaluation
 Evaluate
 Save as a trained model for later use or
 Create Web Service and predict for new data sets
 Get or connect to the data
 Clean the query
 Create measures and dimensions
 Create connections using ERD
 Create data visualizations
 Q&A Analyze the data and get the answers to
your question
 Add visualizations to Dashboard
 Create Application and publish
http://difinity.co.nz#Difinity 18th – 20th Feb 2019
Which Questions do we ask our Model?
Azure ML Lab PowerBI
 How do we predict if a certain flight is going to be
late?
 How does the weather affect the flight being late?
 If we are going to fly from a certain airport, will
our flight be late – Ask the Web service!
 What is the chance for the flight to be less than
15min late if it’s AA? What is the precision of this
prediction?
Future Events
 We generally don’t! It is mostly a data
Visualization tool not a tool we use to predict
 What is the average? Max? Min?
 Which Airport has the most late arrivals?
 What is the correlation and the trend between
the weather and the delay time?
 Clustering the data, which airports are in the most
late cluster? – histograms and brick charts
Events that have already happened, limited
prediction
http://difinity.co.nz#Difinity 18th – 20th Feb 2019
What is a prediction model?
Which Algorithm is the best fit to predict the results, depending on the data
Has the data seasonal? hads repetitions? Categorical?
Linear Regression or Poisson Regression?
How can we know what works best? Based on the past results!
Main model types:
Anomaly Detection
Classification
Clustering
Regression
http://difinity.co.nz#Difinity 18th – 20th Feb 2019
Statistics…
Average
Single Exponential Smoothing
Exponential smoothing is a rule of thumb technique
for smoothing time series data using
the exponentialwindow function. Whereas in the
simple moving average the past observations are
weighted equally,exponential functions are used to
assignexponentially decreasing weights over time.
( Wikipedia to the rescue… )
Moving Average
The last month might be a better prediction for flights
than the last 20 months
Weighted Moving Average
Some observations are more significant than others,
flights of a domastic flight company have different
performance and cannot be compared to others or big vs
small planes
Can be chosen, for the single smoothing, between 0.1 and
0.9, is chosen through a local optimal minimum value
We choose the best value for α so the value which results
in the smallest MSE. (Mean of Square Errors)
http://difinity.co.nz#Difinity 18th – 20th Feb 2019
Adding information to our data visualization
PowerBI
Min value line
Max value line
Trend line – we can see that the AVG delay time
increases?
Expediential Smooth
Seasonality – 7 points (week in a month)
Ignore last 10 points – to check our prediction
Forecast length- to see what the other 7 days will
look like
http://difinity.co.nz#Difinity 18th – 20th Feb 2019
Adding information to our data visualization
PowerBI – How can we explain the predicted results?
Trend line – we can see that the AVG delay time
increases?
How can we validate and score the predicted results? Azure ML Lab
• End of October - Thanksgiving?
• Weather changes at the airports for the worse
• The trend line doesn’t continue for the predicted data
• How can we control the Alpha? Well in Power View for O365, not in PowerBI yet
http://difinity.co.nz#Difinity 18th – 20th Feb 2019
More options in PowerBI? – R
R model for more, simple prediction options in PowerBI
Add the R code in the PowerBI model for the relevant data column
The R visualization can do predictive models of your choice
It is limited but very useful for business case scenarios
Recommended Blog post -
Revenue and forecasting by Christian Berg – Plot using R
https://community.powerbi.com/t5/Community-Blog/Revenue-and-forecasting/ba-p/86299
New Series of Time Series by PHD MVP Leiila Etatti – RADACAD your sponsors and organizers
http://radacad.com/new-series-of-time-series-part-1
Predictive analytics with R in PowerBI – https://feathersanalytics.com - Joseph Yeates
http://difinity.co.nz#Difinity 18th – 20th Feb 2019
Meanwhile in Azure ML Lab
Unfortunately, the ETS – Exponential smoothing module was deprecated, so lets
choose a better one!
Edit Metadata – Adding the column for the Average values
Split the data into sample and population (not just ignore last
10 but randomize the split)
The question what is the average late time expected is simply
wrong for this tool, we would like to use it for actually
predicting for each flight if it is going to be late, or how the
weather affects the flights being late.
http://difinity.co.nz#Difinity 18th – 20th Feb 2019
Azure ML Lab some of the Mathematical models
Decision Forest Regression
Linear Regression (Excell as well…Solver)
2 Class Boosted Decision Tree
Decision Tree
2 Class Logistic Regression
Will be used in the prediction demo
to compare which is predicting the best way
K- Mean Clustering (PBI as well)
http://difinity.co.nz#Difinity 18th – 20th Feb 2019
• Bullet one
• Bullet two
• Bullet three
The Prediction by Airport –
Hartsfield in Atlanta
Georgia and Chicago are
the 2 leading airports that
the weather has a very
large impact on the delay
times, the delay times
there are the largest.
(How many Hallmark
movies are using the
weather in Chicago airport
during a snowstorm in
Christmas…)
http://difinity.co.nz#Difinity 18th – 20th Feb 2019
• Bullet one
• Bullet two
• Bullet three
http://difinity.co.nz#Difinity 18th – 20th Feb 2019
• Bullet one
• Bullet two
• Bullet three
The Flight Delay prediction compare the
scored models
 So the blue prediction model is
slightly better than the red one,
to predict if the flight is going to
be late.
 Two class boosted decision tree
is slightly better than two class
logistics regression
http://difinity.co.nz#Difinity 18th – 20th Feb 2019
Azure ML
Data scientists, developers Business users, end users and customers, Analysts
friendly
Be the development platform for prediction analytics
solutions Development platform and publishing platform for
data visualization
Upload the data, manipulate the data, divide into
data set and training set, train the model, evaluate
the model create service, predict for other data sets
PowerBI
Connect to data, create report, analyze exciting data
and get data insights
The Summary Slide
Ask questions – Business users and managers
questions, evaluate, compare, classify, display
Predict given a mathematical trained model based on
past results
The next generation is already here… Azure IoT hub,
Azure AI and Machine learning focused on devs
Focused on EVERYBODY
(the new data flow prediction capability shown by Layla today)
http://difinity.co.nz#Difinity 18th – 20th Feb 2019
Questions?
http://difinity.co.nz#Difinity 18th – 20th Feb 2019
Evaluate Sessions and Win a Prize!
https://www.surveymonkey.com/r/5LR9LFB
http://difinity.co.nz#Difinity 18th – 20th Feb 2019
Thanks to our sponsors
SilverPlatinum Sponsors
Exhibitor

Power bi and azure ml

  • 1.
    http://difinity.co.nz#Difinity 18th –20th Feb 2019 Welcome Auckland, New Zealand 18-20 February 2019
  • 2.
    http://difinity.co.nz#Difinity 18th –20th Feb 2019 Azure Machine Learning Studio vs. Power BI Yana Berkovich, Microsoft MVP, Consultant BI Dev lead – Finning Canada & Blue Silver Shift Canada @Yana_Berkovich
  • 3.
    http://difinity.co.nz#Difinity 18th –20th Feb 2019 About Me BIAnalyst&DEV,DataPlatformMVP Consultant, ProductManager MemberofBI,BA,SharePoint, O365,PMcommunities DataPlatformConsultant -FinningCaterpillar BlueSilverShift Experimenting withO365 https://www.linkedin.com/in/yanaberkovich http://yanaberkovich.com @Yana_Berkovich
  • 4.
    http://difinity.co.nz#Difinity 18th –20th Feb 2019 from LinkedIn repost couldn’t find the source… (Gadi Evron)
  • 5.
    http://difinity.co.nz#Difinity 18th –20th Feb 2019 What are we going to talk about today? (Expectations: This is level 101…) AzureML Lab & Azure Notebook vs PowerBI Getting the Data Processing the Data The prediction model Sample, population and your data set Example - Exponential Smoothing Method Quick Summary
  • 6.
    http://difinity.co.nz#Difinity 18th –20th Feb 2019 Why are we doing this? (AKA the Business Value) by Gartner
  • 7.
    http://difinity.co.nz#Difinity 18th –20th Feb 2019 What is Azure ML Studio? & The Notebook • Azure ML -a collaborative, drag-and-drop tool, Build, test, and deploy predictive analytics solutions on your data. The models can be consumed by BI & data visualization tools https://studio.azureml.net/Home • Jupiter Notebook run on Azure- Azure Notebook – Free development browser service using Jupyter - an open source project that enables executable code and graphics https://notebooks.azure.com • More capabilities with subscription Audience: Data Analysts, Statisticians, Actuary, Data Scientists … Users: Data Analysts, Data Scientists Copyright IMDB site
  • 8.
    http://difinity.co.nz#Difinity 18th –20th Feb 2019 A suite of business analytics tools that deliver insights. Data processing and data visualization tool https://powerbi.microsoft.com What is PowerBI? Audience: Business Users & Managers Users: IT, Finance, Marketing, Manufacturing, Data Analysts…
  • 9.
    http://difinity.co.nz#Difinity 18th –20th Feb 2019 What is currently part of PowerBI Power BI desktop Power BI Desktop is the report authoring tool - https://powerbi.microsoft.com/en-us/desktop Access data from various data sources and transform them for your reporting needs Power BI Service – Pro/ Premium (Capacity, Licensing and Monitoring) + Applications Browser based portal - https://app.powerbi.com Share and collaborate with your collogues and wider audience PowerBI Report Server On premise solution for organizational reporting PowerBI Mobile Mobile Application, can be connected to your PowerBI on pemise or the cloud PowerBI Data Gateway Install in your organization, to enablesecure data connection (same as for PowerApps) Embeded Analytics PowerBI in Azure, set powerBI when needed, in the Azure portal Use PowerBI REST API & JS to embed in your applications Data Flows – Enabling basic ETL processing from various data sources
  • 10.
    http://difinity.co.nz#Difinity 18th –20th Feb 2019 Azure ML A service that was created for developers and data scientist Business users, end users and customers, Analysts friendly Predict the future Train and create custom models based on statistics that will help answer questions Visualize the existing data for business use Answer business questions Predict the future??!! Is there a better why that can potentially generate more value for the business? PowerBI Get insights to give information for the Decision Support Has basic prediction models Who? What? Why?
  • 11.
    http://difinity.co.nz#Difinity 18th –20th Feb 2019 Getting the data
  • 12.
    http://difinity.co.nz#Difinity 18th –20th Feb 2019 The Circle of Prediction Model Data Collection Data Preperation Data Manipulations Model Creation Model Evaluation
  • 13.
    http://difinity.co.nz#Difinity 18th –20th Feb 2019 IT all starts with the right question and Business Goal! (and a presentation…)
  • 14.
    http://difinity.co.nz#Difinity 18th –20th Feb 2019 Case Study Airplanes are never late…. We are going to analyze the data set of flights during the month of October This data set was taken from the sample data sets in ML studio
  • 15.
    http://difinity.co.nz#Difinity 18th –20th Feb 2019 Where did I get the data to start? • Sample Data to use with PowerBI https://docs.microsoft.com/en-us/power-bi/sample-datasets • In the ML Studio – there are sample data sets to practice • SQL data sets for testing and prototyping https://docs.microsoft.com/en-us/azure/sql-database/sql-database-public-data-sets • EdEx – Certification programs for Machine Learning • Kaggel - https://www.kaggle.com/ - the place for data science
  • 16.
    http://difinity.co.nz#Difinity 18th –20th Feb 2019 Get the Data Azure ML Lab PowerBI Data set CSV file, txt, Excel, Hive table, SQL table, Odata, SVMlight, Zip, R object Source – CSV file in this case, More than a 100 different sources Source Type Data Delimiter Data connection and refresh
  • 17.
    http://difinity.co.nz#Difinity 18th –20th Feb 2019 Visualizing the Data Azure ML Lab PowerBI Data Preview Histograms, box plots Raw data This is the main goal of this tool – Data visualization Recently, similar automatic visualizations Data view for all the visualizations click the Aggregated data
  • 18.
    http://difinity.co.nz#Difinity 18th –20th Feb 2019 Visualizing the Data PowerBI – Quick Insights Quick insights mode Quick insights mode
  • 19.
    http://difinity.co.nz#Difinity 18th –20th Feb 2019 Cleaning and preparing the data
  • 20.
    http://difinity.co.nz#Difinity 18th –20th Feb 2019 Azure ML Data Type, Change metadata module Data Type – automatic detection, Change the type in a SQL query, directly on the column Clean missing data – minimum maximum missing value ration (even 100% of the data cleaned) Remove uplications, first last top rows, missing & Null values Use DAX queries and R & Python  PowerBI Create measures calculated based on data ranges Data Cleansing Convert the data into categories from range Group categorical values Edit metadata SMOTE - increasing rows/facts number Edit metadata Use SQL queries and R & Python 
  • 21.
    http://difinity.co.nz#Difinity 18th –20th Feb 2019 Azure ML Selecting columns, Selecting columns, rows, creating calculations, pivoting the data, changing types Merging, Join with other data source – SQL manipulations, R Manipulations, Python manipulations Building Dimensions – Time dimension, Airport Dimension… Creating custom measures, quick measures and code based measures using DAX PowerBI ERD- create connections between the dimensions and the fact tables Data Manipulations Creating Join through SQL query, Merging, Appending lines Creating EDR through join of another dimension table for the selected columns Using R or Python for creating custom measures (avg, mean…)
  • 22.
    http://difinity.co.nz#Difinity 18th –20th Feb 2019 Azure ML Only if you build a model for that Out of the box visualization for the data set with 2 graphic options as previously mentioned Q&A functionality recently available on desktop Looks very similar to the visualizations that exist in ML lab Enables the user to add the FAQ visualization to the dashboard or report “native” language questions answered- What is the most late flight from Chicago airport? PowerBI Data Manipulations
  • 23.
    http://difinity.co.nz#Difinity 18th –20th Feb 2019 The prediction model
  • 24.
    http://difinity.co.nz#Difinity 18th –20th Feb 2019 Main Steps in creating an Experiment / Report AzureML Experiment PowerBI Report  Get data  Clean the data  Prepare the data (adding columns, calculations, missing data types, joins, SQL manipulations…)  Divide the data – sample for the model to train, data for evaluation  Choose the model  Train the Algorithm  Score using the data for evaluation  Evaluate  Save as a trained model for later use or  Create Web Service and predict for new data sets  Get or connect to the data  Clean the query  Create measures and dimensions  Create connections using ERD  Create data visualizations  Q&A Analyze the data and get the answers to your question  Add visualizations to Dashboard  Create Application and publish
  • 25.
    http://difinity.co.nz#Difinity 18th –20th Feb 2019 Which Questions do we ask our Model? Azure ML Lab PowerBI  How do we predict if a certain flight is going to be late?  How does the weather affect the flight being late?  If we are going to fly from a certain airport, will our flight be late – Ask the Web service!  What is the chance for the flight to be less than 15min late if it’s AA? What is the precision of this prediction? Future Events  We generally don’t! It is mostly a data Visualization tool not a tool we use to predict  What is the average? Max? Min?  Which Airport has the most late arrivals?  What is the correlation and the trend between the weather and the delay time?  Clustering the data, which airports are in the most late cluster? – histograms and brick charts Events that have already happened, limited prediction
  • 26.
    http://difinity.co.nz#Difinity 18th –20th Feb 2019 What is a prediction model? Which Algorithm is the best fit to predict the results, depending on the data Has the data seasonal? hads repetitions? Categorical? Linear Regression or Poisson Regression? How can we know what works best? Based on the past results! Main model types: Anomaly Detection Classification Clustering Regression
  • 27.
    http://difinity.co.nz#Difinity 18th –20th Feb 2019 Statistics… Average Single Exponential Smoothing Exponential smoothing is a rule of thumb technique for smoothing time series data using the exponentialwindow function. Whereas in the simple moving average the past observations are weighted equally,exponential functions are used to assignexponentially decreasing weights over time. ( Wikipedia to the rescue… ) Moving Average The last month might be a better prediction for flights than the last 20 months Weighted Moving Average Some observations are more significant than others, flights of a domastic flight company have different performance and cannot be compared to others or big vs small planes Can be chosen, for the single smoothing, between 0.1 and 0.9, is chosen through a local optimal minimum value We choose the best value for α so the value which results in the smallest MSE. (Mean of Square Errors)
  • 28.
    http://difinity.co.nz#Difinity 18th –20th Feb 2019 Adding information to our data visualization PowerBI Min value line Max value line Trend line – we can see that the AVG delay time increases? Expediential Smooth Seasonality – 7 points (week in a month) Ignore last 10 points – to check our prediction Forecast length- to see what the other 7 days will look like
  • 29.
    http://difinity.co.nz#Difinity 18th –20th Feb 2019 Adding information to our data visualization PowerBI – How can we explain the predicted results? Trend line – we can see that the AVG delay time increases? How can we validate and score the predicted results? Azure ML Lab • End of October - Thanksgiving? • Weather changes at the airports for the worse • The trend line doesn’t continue for the predicted data • How can we control the Alpha? Well in Power View for O365, not in PowerBI yet
  • 30.
    http://difinity.co.nz#Difinity 18th –20th Feb 2019 More options in PowerBI? – R R model for more, simple prediction options in PowerBI Add the R code in the PowerBI model for the relevant data column The R visualization can do predictive models of your choice It is limited but very useful for business case scenarios Recommended Blog post - Revenue and forecasting by Christian Berg – Plot using R https://community.powerbi.com/t5/Community-Blog/Revenue-and-forecasting/ba-p/86299 New Series of Time Series by PHD MVP Leiila Etatti – RADACAD your sponsors and organizers http://radacad.com/new-series-of-time-series-part-1 Predictive analytics with R in PowerBI – https://feathersanalytics.com - Joseph Yeates
  • 31.
    http://difinity.co.nz#Difinity 18th –20th Feb 2019 Meanwhile in Azure ML Lab Unfortunately, the ETS – Exponential smoothing module was deprecated, so lets choose a better one! Edit Metadata – Adding the column for the Average values Split the data into sample and population (not just ignore last 10 but randomize the split) The question what is the average late time expected is simply wrong for this tool, we would like to use it for actually predicting for each flight if it is going to be late, or how the weather affects the flights being late.
  • 32.
    http://difinity.co.nz#Difinity 18th –20th Feb 2019 Azure ML Lab some of the Mathematical models Decision Forest Regression Linear Regression (Excell as well…Solver) 2 Class Boosted Decision Tree Decision Tree 2 Class Logistic Regression Will be used in the prediction demo to compare which is predicting the best way K- Mean Clustering (PBI as well)
  • 33.
    http://difinity.co.nz#Difinity 18th –20th Feb 2019 • Bullet one • Bullet two • Bullet three The Prediction by Airport – Hartsfield in Atlanta Georgia and Chicago are the 2 leading airports that the weather has a very large impact on the delay times, the delay times there are the largest. (How many Hallmark movies are using the weather in Chicago airport during a snowstorm in Christmas…)
  • 34.
    http://difinity.co.nz#Difinity 18th –20th Feb 2019 • Bullet one • Bullet two • Bullet three
  • 35.
    http://difinity.co.nz#Difinity 18th –20th Feb 2019 • Bullet one • Bullet two • Bullet three The Flight Delay prediction compare the scored models  So the blue prediction model is slightly better than the red one, to predict if the flight is going to be late.  Two class boosted decision tree is slightly better than two class logistics regression
  • 36.
    http://difinity.co.nz#Difinity 18th –20th Feb 2019 Azure ML Data scientists, developers Business users, end users and customers, Analysts friendly Be the development platform for prediction analytics solutions Development platform and publishing platform for data visualization Upload the data, manipulate the data, divide into data set and training set, train the model, evaluate the model create service, predict for other data sets PowerBI Connect to data, create report, analyze exciting data and get data insights The Summary Slide Ask questions – Business users and managers questions, evaluate, compare, classify, display Predict given a mathematical trained model based on past results The next generation is already here… Azure IoT hub, Azure AI and Machine learning focused on devs Focused on EVERYBODY (the new data flow prediction capability shown by Layla today)
  • 37.
  • 38.
    http://difinity.co.nz#Difinity 18th –20th Feb 2019 Evaluate Sessions and Win a Prize! https://www.surveymonkey.com/r/5LR9LFB
  • 39.
    http://difinity.co.nz#Difinity 18th –20th Feb 2019 Thanks to our sponsors SilverPlatinum Sponsors Exhibitor

Editor's Notes

  • #3 And without further ado, here is Yana with Azure Machine Learning Studio and PowerBI. {SPEAKER begins}
  • #10 How to design reports in Power Bi Desktop How to publish to Power BI Service
  • #18 Show the Fish Boston Report, visualization page 3 as an extra example
  • #21 stands for Synthetic Minority Oversampling Technique. This is a statistical technique for increasing the number of cases in your dataset in a balanced way.
  • #26 Show the moview web service
  • #27 Show the applications in ML
  • #31 In PowerBI there are other methods such as K clustering usage with a plot build with R script in order to predict events
  • #41 Emphasize the blogs The data science and ML course to take Kaggle for data sets