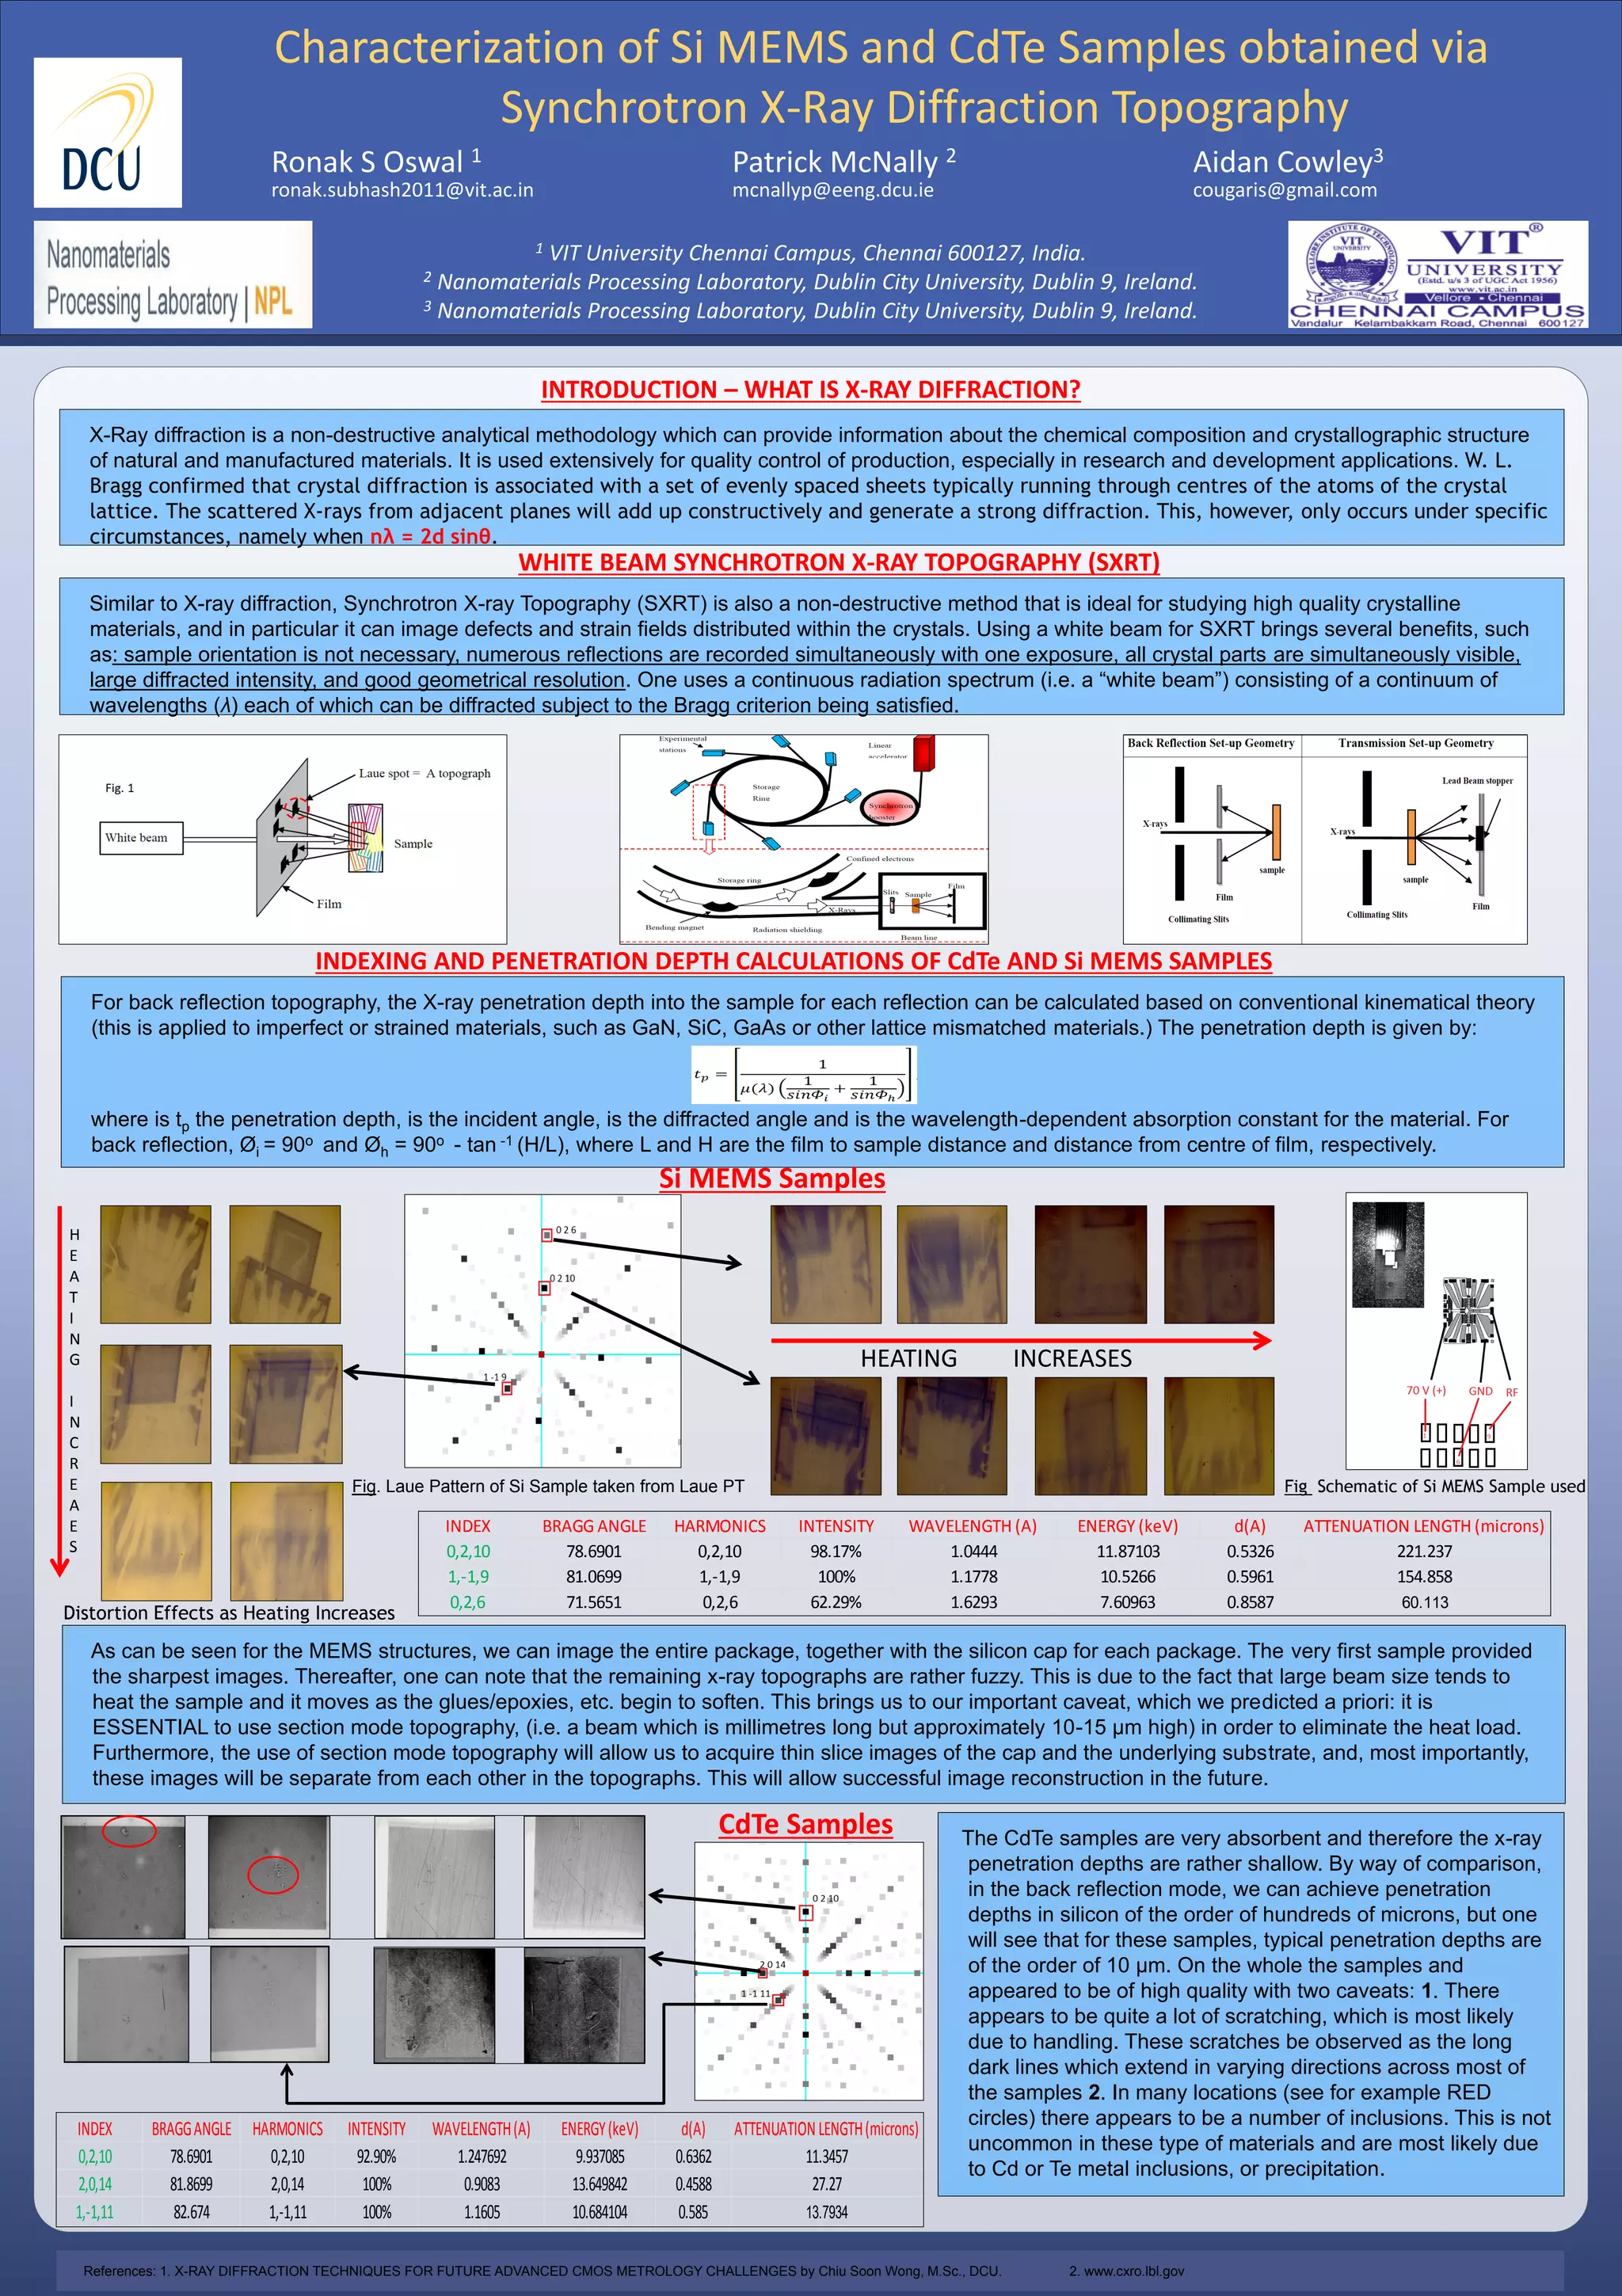
RESEARCH POSTER PRESENTATION DESIGN © 2012
www.PosterPresentations.com
Similar to X-ray diffraction, Synchrotron X-ray Topography (SXRT) is also a non-destructive method that is ideal for studying high quality crystalline
materials, and in particular it can image defects and strain fields distributed within the crystals. Using a white beam for SXRT brings several benefits, such
as: sample orientation is not necessary, numerous reflections are recorded simultaneously with one exposure, all crystal parts are simultaneously visible,
large diffracted intensity, and good geometrical resolution. One uses a continuous radiation spectrum (i.e. a “white beam”) consisting of a continuum of
wavelengths (λ) each of which can be diffracted subject to the Bragg criterion being satisfied.
WHITE BEAM SYNCHROTRON X-RAY TOPOGRAPHY (SXRT)
X-Ray diffraction is a non-destructive analytical methodology which can provide information about the chemical composition and crystallographic structure
of natural and manufactured materials. It is used extensively for quality control of production, especially in research and development applications. W. L.
Bragg confirmed that crystal diffraction is associated with a set of evenly spaced sheets typically running through centres of the atoms of the crystal
lattice. The scattered X-rays from adjacent planes will add up constructively and generate a strong diffraction. This, however, only occurs under specific
circumstances, namely when nλ = 2d sinθ.
INTRODUCTION – WHAT IS X-RAY DIFFRACTION?
Distortion Effects as Heating Increases
CdTe Samples
Fig. Laue Pattern of Si Sample taken from Laue PT
INDEXING AND PENETRATION DEPTH CALCULATIONS OF CdTe AND Si MEMS SAMPLES
For back reflection topography, the X-ray penetration depth into the sample for each reflection can be calculated based on conventional kinematical theory
(this is applied to imperfect or strained materials, such as GaN, SiC, GaAs or other lattice mismatched materials.) The penetration depth is given by:
where is tp the penetration depth, is the incident angle, is the diffracted angle and is the wavelength-dependent absorption constant for the material. For
back reflection, Øi = 90о and Øh = 90о - tan -1 (H/L), where L and H are the film to sample distance and distance from centre of film, respectively.
Si MEMS Samples
Fig Schematic of Si MEMS Sample used
1 VIT University Chennai Campus, Chennai 600127, India.
2 Nanomaterials Processing Laboratory, Dublin City University, Dublin 9, Ireland.
3 Nanomaterials Processing Laboratory, Dublin City University, Dublin 9, Ireland.
Ronak S Oswal 1 Patrick McNally 2 Aidan Cowley3
ronak.subhash2011@vit.ac.in mcnallyp@eeng.dcu.ie cougaris@gmail.com
Characterization of Si MEMS and CdTe Samples obtained via
Synchrotron X-Ray Diffraction Topography
H
E
A
T
I
N
G
I
N
C
R
E
A
E
S
INDEX BRAGG ANGLE HARMONICS INTENSITY WAVELENGTH (A) ENERGY (keV) d(A) ATTENUATION LENGTH (microns)
0,2,10 78.6901 0,2,10 98.17% 1.0444 11.87103 0.5326 221.237
1,-1,9 81.0699 1,-1,9 100% 1.1778 10.5266 0.5961 154.858
0,2,6 71.5651 0,2,6 62.29% 1.6293 7.60963 0.8587 60.113
HEATING INCREASES
INDEX BRAGGANGLE HARMONICS INTENSITY WAVELENGTH(A) ENERGY(keV) d(A) ATTENUATIONLENGTH(microns)
0,2,10 78.6901 0,2,10 92.90% 1.247692 9.937085 0.6362 11.3457
2,0,14 81.8699 2,0,14 100% 0.9083 13.649842 0.4588 27.27
1,-1,11 82.674 1,-1,11 100% 1.1605 10.684104 0.585 13.7934
As can be seen for the MEMS structures, we can image the entire package, together with the silicon cap for each package. The very first sample provided
the sharpest images. Thereafter, one can note that the remaining x-ray topographs are rather fuzzy. This is due to the fact that large beam size tends to
heat the sample and it moves as the glues/epoxies, etc. begin to soften. This brings us to our important caveat, which we predicted a priori: it is
ESSENTIAL to use section mode topography, (i.e. a beam which is millimetres long but approximately 10-15 µm high) in order to eliminate the heat load.
Furthermore, the use of section mode topography will allow us to acquire thin slice images of the cap and the underlying substrate, and, most importantly,
these images will be separate from each other in the topographs. This will allow successful image reconstruction in the future.
The CdTe samples are very absorbent and therefore the x-ray
penetration depths are rather shallow. By way of comparison,
in the back reflection mode, we can achieve penetration
depths in silicon of the order of hundreds of microns, but one
will see that for these samples, typical penetration depths are
of the order of 10 µm. On the whole the samples and
appeared to be of high quality with two caveats: 1. There
appears to be quite a lot of scratching, which is most likely
due to handling. These scratches be observed as the long
dark lines which extend in varying directions across most of
the samples 2. In many locations (see for example RED
circles) there appears to be a number of inclusions. This is not
uncommon in these type of materials and are most likely due
to Cd or Te metal inclusions, or precipitation.
References: 1. X-RAY DIFFRACTION TECHNIQUES FOR FUTURE ADVANCED CMOS METROLOGY CHALLENGES by Chiu Soon Wong, M.Sc., DCU. 2. www.cxro.lbl.gov

POSTER_RONAK

  • 1.
    RESEARCH POSTER PRESENTATIONDESIGN © 2012 www.PosterPresentations.com Similar to X-ray diffraction, Synchrotron X-ray Topography (SXRT) is also a non-destructive method that is ideal for studying high quality crystalline materials, and in particular it can image defects and strain fields distributed within the crystals. Using a white beam for SXRT brings several benefits, such as: sample orientation is not necessary, numerous reflections are recorded simultaneously with one exposure, all crystal parts are simultaneously visible, large diffracted intensity, and good geometrical resolution. One uses a continuous radiation spectrum (i.e. a “white beam”) consisting of a continuum of wavelengths (λ) each of which can be diffracted subject to the Bragg criterion being satisfied. WHITE BEAM SYNCHROTRON X-RAY TOPOGRAPHY (SXRT) X-Ray diffraction is a non-destructive analytical methodology which can provide information about the chemical composition and crystallographic structure of natural and manufactured materials. It is used extensively for quality control of production, especially in research and development applications. W. L. Bragg confirmed that crystal diffraction is associated with a set of evenly spaced sheets typically running through centres of the atoms of the crystal lattice. The scattered X-rays from adjacent planes will add up constructively and generate a strong diffraction. This, however, only occurs under specific circumstances, namely when nλ = 2d sinθ. INTRODUCTION – WHAT IS X-RAY DIFFRACTION? Distortion Effects as Heating Increases CdTe Samples Fig. Laue Pattern of Si Sample taken from Laue PT INDEXING AND PENETRATION DEPTH CALCULATIONS OF CdTe AND Si MEMS SAMPLES For back reflection topography, the X-ray penetration depth into the sample for each reflection can be calculated based on conventional kinematical theory (this is applied to imperfect or strained materials, such as GaN, SiC, GaAs or other lattice mismatched materials.) The penetration depth is given by: where is tp the penetration depth, is the incident angle, is the diffracted angle and is the wavelength-dependent absorption constant for the material. For back reflection, Øi = 90о and Øh = 90о - tan -1 (H/L), where L and H are the film to sample distance and distance from centre of film, respectively. Si MEMS Samples Fig Schematic of Si MEMS Sample used 1 VIT University Chennai Campus, Chennai 600127, India. 2 Nanomaterials Processing Laboratory, Dublin City University, Dublin 9, Ireland. 3 Nanomaterials Processing Laboratory, Dublin City University, Dublin 9, Ireland. Ronak S Oswal 1 Patrick McNally 2 Aidan Cowley3 ronak.subhash2011@vit.ac.in mcnallyp@eeng.dcu.ie cougaris@gmail.com Characterization of Si MEMS and CdTe Samples obtained via Synchrotron X-Ray Diffraction Topography H E A T I N G I N C R E A E S INDEX BRAGG ANGLE HARMONICS INTENSITY WAVELENGTH (A) ENERGY (keV) d(A) ATTENUATION LENGTH (microns) 0,2,10 78.6901 0,2,10 98.17% 1.0444 11.87103 0.5326 221.237 1,-1,9 81.0699 1,-1,9 100% 1.1778 10.5266 0.5961 154.858 0,2,6 71.5651 0,2,6 62.29% 1.6293 7.60963 0.8587 60.113 HEATING INCREASES INDEX BRAGGANGLE HARMONICS INTENSITY WAVELENGTH(A) ENERGY(keV) d(A) ATTENUATIONLENGTH(microns) 0,2,10 78.6901 0,2,10 92.90% 1.247692 9.937085 0.6362 11.3457 2,0,14 81.8699 2,0,14 100% 0.9083 13.649842 0.4588 27.27 1,-1,11 82.674 1,-1,11 100% 1.1605 10.684104 0.585 13.7934 As can be seen for the MEMS structures, we can image the entire package, together with the silicon cap for each package. The very first sample provided the sharpest images. Thereafter, one can note that the remaining x-ray topographs are rather fuzzy. This is due to the fact that large beam size tends to heat the sample and it moves as the glues/epoxies, etc. begin to soften. This brings us to our important caveat, which we predicted a priori: it is ESSENTIAL to use section mode topography, (i.e. a beam which is millimetres long but approximately 10-15 µm high) in order to eliminate the heat load. Furthermore, the use of section mode topography will allow us to acquire thin slice images of the cap and the underlying substrate, and, most importantly, these images will be separate from each other in the topographs. This will allow successful image reconstruction in the future. The CdTe samples are very absorbent and therefore the x-ray penetration depths are rather shallow. By way of comparison, in the back reflection mode, we can achieve penetration depths in silicon of the order of hundreds of microns, but one will see that for these samples, typical penetration depths are of the order of 10 µm. On the whole the samples and appeared to be of high quality with two caveats: 1. There appears to be quite a lot of scratching, which is most likely due to handling. These scratches be observed as the long dark lines which extend in varying directions across most of the samples 2. In many locations (see for example RED circles) there appears to be a number of inclusions. This is not uncommon in these type of materials and are most likely due to Cd or Te metal inclusions, or precipitation. References: 1. X-RAY DIFFRACTION TECHNIQUES FOR FUTURE ADVANCED CMOS METROLOGY CHALLENGES by Chiu Soon Wong, M.Sc., DCU. 2. www.cxro.lbl.gov