Terahertz Spectroscopic Analysis and Multispectral Imaging of Epitaxially Gro...
2011-IPP-CT Data Evaluation of Fibre Reinforced Polymers to Determine Fibre Length Distribution_Kannappan
1. D. Salaberger1*, K. A. Kannappan1
, J. Kastner1
, J. Reussner2
, T. Auinger3
1
University of Applied Sciences, Upper Austria, Wels, Austria
2
Borealis Polyolefine GmbH, Linz, Austria
3
Transfercenter für Kunststofftechnik GmbH, Wels, Austria
Evaluation of Computed Tomography Data
from Fibre Reinforced Polymers to Determine
Fibre Length Distribution
Sub-lm computed tomography (sub-lm-CT) was used to deter-
mine the fibre orientation and fibre length distribution in long
glass fibre filled polypropylene. For data evaluation two differ-
ent concepts based on the application of a sequence of different
filters were applied. The first concept is based on segmentation
by binarisation using a global threshold, followed by a detailed
analysis of regions where fibres are touching. The second con-
cept is based on analysis of the original gray value image. For
each voxel the local fibre orientation is determined by calcu-
lating the Hessian Matrix and analysing its Eigen values.
The effectivity of the two data analysis concepts in determin-
ing orientation and length was investigated. For this purpose
the algorithms were applied to specimens with four different
levels of fibre content: 1, 5, 10 and 30% by weight. To quantify
the level of error in fibre determination, a minimum and aver-
age probability for correct fibre determination were estimated.
The results show a strong dependence of the level of error on
the fibre content. Whilst the determination of fibre orientation is
not significantly affected, determination of fibre length distribu-
tion is significantly influenced by fibre content. For samples
with fibre content above 5%, concept 1 does not produce cor-
rect representations of all fibres. In particular, problems arise
if the fibres are touching. Concept 2 delivers much better results
and represents most of the fibres correctly even at higher fibre
content levels and for touching fibres. This was proven by using
artificial CT-data sets generated by CT-simulation and by sys-
tematic comparisons. A practical application of the CT-evalua-
tion pipeline is presented for glass fibre reinforced rings pro-
duced by injection-moulding and extrusion. For both samples
the orientation tensors are calculated and the orientations of
the fibres are visualized in three dimensions by colour coding.
1 Introduction
To be able to predict and modify the mechanical properties of a
structural component made from heterogeneous polymers,
knowledge of the geometrical details of the different phases is
necessary. For long and short glass fibre filled polymers the pa-
rameters fibre orientation distribution (FOD), fibre length dis-
tribution (FLD) and fibre content have been identified as very
important for the mechanical behaviour of this composite ma-
terial. (Matsuoka, 1995; von Bradsky et al., 1997)
Knowledge of the correlation between manufacturing techni-
ques and parameters and mechanical properties is very important
for improvement of the technique or the development of new
technologies. FOD and FLD are input parameters for mechanical
simulations which are useful in the prediction of mechanical
properties like the strength or stiffness of the produced part.
Therefore these two properties have to be determined accurately.
Methods have already been established to measure FOD and
FLD. The best established methods are destructive methods that
can usually gather information either about orientation or length
distribution. (Zak et al, 2000) For orientation, thin cross sections
can be analyzed, either with light optical microscopy (LOM) or
X-ray methods. (Phelps et al., 2008) Fibre length can be deter-
mined by LOM- methods after burning the matrix or estimating
the length from cross sections. Correction of fibre lengths deter-
mined from cross sections may be necessary when the number of
analysed cross sections is low due to statistical effects that have
to be taken into account. (Fu et al., 2002, Clarke et al., 1995)
Recently, three dimensional methods based on X-ray tomo-
graphy (CT) have also been developed. (Shen et al., 2004;
Kastner et al., 2008b; Teßmann et al., 2010) Depending on the
tomographic method used, the results can only be estimates or
detailed analyses. Since data quality is determined by resolu-
tion as well as the appearance of artefacts, at the moment the
best CT-data quality can be achieved by Synchrotron scanning
(SCT). Industrial CT devices are most commonly l-CT de-
vices that are capable of resolutions of a few lm.
The disadvantages of the destructive methods are usually the
time required, the fact that for fibre length and fibre orientation
two different methods have to be applied and that the specimen
cannot be used for further investigations. Synchrotron CT is
cost intensive and availability is a limiting factor.
CT devices that deliver CT data with quality approaching
SCT quality are available. These sub-lm-CT devices usually
work according to the cone beam CT principle. (Kastner,
2008a) The specimen is rotated in an X-ray beam that is gener-
SPECIAL ISSUE ON INJECTION MOLDING AND MOLDS
Intern. Polymer Processing XXVI (2011) 3 Ó Carl Hanser Verlag, Munich 283
* Mail address: Dietmar Salaberger, University of Applied Sciences,
Upper Austria, Stelzhamerstr. 23, 4600 Wels, Austria
E-mail: d.salaberger@fh-wels.at
2011CarlHanserVerlag,Munich,Germanywww.polymer-process.comNotforuseininternetorintranetsites.Notforelectronicdistribution.
2. D. Salaberger et al.: Evaluation of CT Data to Determine Fibre Length Distribution
ated by an X-ray tube. The X-rays are attenuated according to
density and atomic number. The resulting projection is grabbed
by a digital detector that usually works according to the scintil-
lation principle. More than thousand projections are usually
generated from different angles. These projections are recon-
structed using mathematical algorithms resulting in a 3D data
set which consists of volumetric pixels (voxels) with different
grey values. After the specimen has been rotated once through
3608 the full representation of the specimen is available.
Sub-lm-CT devices are equipped with X-ray tubes with
very small focal spots to be able to minimize the effect of blur-
ring. X-ray detectors with more than 2000 pixels in one direc-
tion are well established. Best achievable resolutions are in
the range of a few 100 nm. These devices are constructed in a
desktop-style and can be bought from different manufacturers.
The achievable resolution depends on the one hand on the
CT equipment and on the other hand on the size of the speci-
men. To be able to determine length and orientation very accu-
rately a compromise has to be found between small sample size
and representative volume.
The quality of CT data also determines the way the analysis
has to be carried out. Many different algorithms have been de-
veloped to determine FOD from many different three dimen-
sional data. (Requena et al., 2009; Vincent et al., 2005; Park
et al., 2001) It is evident that it was mainly possible to segment
single fibres with SCT data whereas global or averaged orien-
tations were determined with l-CT data.
The algorithms developed in-house for CT data analysis
were designed to determine fibre orientation using l-CT data.
(Kastner et al., 2008b) The resolution was in the range of the
diameter of the fibres or even lower. The orientation could be
determined accurately but the fibre length could not be deter-
mined since data quality was inadequate.
This publication deals with the application of the previously
developed algorithms to sub-lm-CT data to determine fibre
length distribution as accurately as possible. It will be shown
how it was possible to estimate accuracy and how the algo-
rithms were improved further. The influence of fibre content
on the quality of the analysis is shown as well as a comparison
of CT data analysis with the standard method of pyrolysis.
2 Experimental
2.1 Materials
The material that was used for this study was injection-
moulded polypropylene (PP) filled with long glass fibres (initi-
al length 4.5 mm). Levels of fibre content of 1, 5, 10 and 30%
by weight were analysed. The average diameter of the raw fi-
bres was 13.5 lm.
Two mould geometries were used: a standard tensile bar and
a ring-shaped geometry. One additional ring was produced by
extruding a tube and turning the ring from this tube.
2.2 CT Data Acquisition
For the generation of CT data the sub-lm-CT device Nanotom
(Phoenix|x-ray, Wunstorf, Germany) was used. The Nanofocus®
tube was operated at 50 kV and a focal spot size of about 2 lm. A
Hamamatsu detector with 2300 x 2300 pixels was used.
For comparison, l-CT data was generated using the RayScan
250 E (RayScan Technologies, Meersburg, Germany) microfocus
tube.
To be able to visualise the complete cross section of a tensile
bar test specimen of 4 by 10 mm edge length, it was possible to
set the resolution to 6 lm per voxel. To improve image quality
and reduce artefacts, measurements with a resolution of 2 lm
per voxel were performed on a smaller part of the specimen.
For the datasets for 1 and 5% fibre content, two sample vol-
umes were cut out, a smaller and a larger one.
For the two ring-shaped specimens the resolution was set to
5 lm per voxel because the outer diameter was 10 mm.
Synchrotron-CT-measurements were carried out at the
ESRF (European Synchrotron Radiation Facilities) in Greno-
ble using monochromatic X-rays at 21.2 keV and a resolution
of 0.7 lm. The sample volume that could be scanned was ap-
proximately 1 mm in diameter.
2.3 CT Data Analysis
Two basic concepts were developed to extract the information
about fibre orientation and fibre length from CT data. The ba-
sic workflow idea is to define a sequence of filters and subse-
quently apply them.
Pre-processing is necessary to reduce noise and increase
contrast between fibres and matrix. For all datasets an aniso-
tropic diffusion filter was applied to reduce noise without blur-
ring the edges. The aim is to extract each and every fibre in
such a way that start and endpoint are determined accurately.
The first concept implemented was based on segmentation
using a global threshold followed by a detailed analysis of re-
gions where fibres are touching. This sequence of filters was
proposed by Kastner et al. (2008c). The fibres are separated
from the matrix by binarisation using the principle proposed
by Otsu (1979). This guarantees for user independent and com-
parable results of binarization. In the next step binary thinning
is applied to extract only a single line of voxels for each fibre.
The last step treats regions where fibres are touching, or “clus-
ters”, in such a way that the fibres are separated into single ob-
jects. The following parameters were set for the algorithms:
. “Anisotropic diffusion”: iteration (10), time step (0.0625),
conductance (5),
. “Binarisation”: Otsu-value · 1.25,
. “Cluster analysis”: kink angle: 1608, cluster distance:
14 lm (ca. fibre diameter).
The performance of this concept will be discussed in this paper.
It will be shown that the FOD can be determined very well but
an accurate analysis of fibre details like fibre length is not pos-
sible with this approach.
Therefore a second concept was developed based on the ana-
lysis of the original grey value image. The step of binarisation
is not essential for this concept. For each voxel the local fibre ori-
entation is calculated by calculating the Hessian Matrix and ana-
lysing their Eigen values. A similar concept was proposed by
Teßmann et al. (2010). In addition to the local orientation, the
grey value distribution of an axial cross section through a fibre
is taken into account. In the ideal case radial grey value profiles
284 Intern. Polymer Processing XXVI (2011) 3
2011CarlHanserVerlag,Munich,Germanywww.polymer-process.comNotforuseininternetorintranetsites.Notforelectronicdistribution.
3. in every direction perpendicular to the direction within one cross
section should follow a Gaussian distribution. This means that
the centre of a fibre has the highest grey value. This is true for
free-standing fibres but can be different in regions where fibres
are touching. Due to the big difference in density between fibre
and matrix (glass: 2.5 g/cm3
, PP: 0.9 g/cm3
) artifacts are intro-
duced into the CT data. These artifacts can also influence the
ideal Gaussian grey value distribution. The result of this “ortho
plane analysis” is a binary image where only the centre voxels
of the fibres are set to foreground. In the touching areas this ap-
proach guarantees that most of the fibres are separated from each
other. This dataset can be used as input for the filters developed
for the first concept to determine the start- and endpoint of each
fibre. Information from concept 2 can also be used for improving
the remaining cluster points’ analysis. In Fig. 1 the filters and
data flow is shown for both concepts, see also Table 1.
To evaluate the quality of software-concept 1, the standard
3D data analysis tool “VG Studio MAX 2.0” (Volume Graphics,
Heidelberg, Germany) was used to determine the number of fi-
bres accurately. The toolbox “Geometry analysis” was therefore
used to fit cylinders by manually selecting each individual fibre.
The fitted cylinders can be visualised within the slice images
which makes it easy to count each fibre exactly once.
2.4 Simulation
A CT-simulation tool was used to generate artificial data sets.
The tool was implemented by Reiter et al. (2009) mainly to op-
timise CT-scan parameters.
For this study cylindrical geometries
were defined using Constructive Solid
Geometries (CSG) which are defined by
surface equations. The advantage of sim-
ulated data is that every artificial fibre is
characterised precisely by the surface
equation and the quality of CT data can
be chosen by the simulation parameters.
Some representative fibre network
structures were chosen for the real data-
sets that were modelled by CSG. The da-
tasets were used to develop the software
concepts and to evaluate them.
3 Results and Discussion
The result of a CT scan with a sub-lm-CT
device delivers much better quality for
polymeric samples than a more common
l-CT device. (Fig. 2) The reason is on the
one hand better quality of the X-ray beam
since the focal spot is very small and the
energy spectrum has its maximum at low-
er energies which leads to a better contrast
for less absorbing materials like polymers.
On the other hand the detectors used have
1024 (l-CT) and 2300 (sub-lm-CT) pix-
els in a row which leads to half the voxel-
size for the sub-lm-CT device for the
same size of specimen.
Fig. 2 shows slice images of data sets
that were generated using different CT de-
vices. It is clearly visible that the Synchro-
tron CT measurement represents each and
D. Salaberger et al.: Evaluation of CT Data to Determine Fibre Length Distribution
Intern. Polymer Processing XXVI (2011) 3 285
Specimen 1%
small
1%
large
5%
small
5%
large
10% 30%
Size (MB) 286 2080 80 1327 33 3.8
Voxels X 533 1064 388 754 210 125
Voxels Y 497 1001 217 751 204 124
Voxels Z 552 1000 485 1200 388 126
Fibres (manually counted) 82 – 107 – 175 112
Table 1. Overview of analysed data, voxel size: 2 lm, the specimens will hereinafter be re-
ferred to as: “1% small”, “1% large”, “5% small”, “5% large”, “10%” and “30%”
Fig. 1. Filter sequence for concept 1 and 2
Fig. 2. Frontal CT-slice images of different regions in an injection-moulded PP tensile bar with
10% glass fibres. (A) sub-lm-CT at 12 lm voxel size, (B) l-CT at 10 lm voxel size, (C) sub-lm-
CT at 2 lm voxel size, (D) synchrotron-CT at 0.7 lm voxel size
A) B)
C) D)
2011CarlHanserVerlag,Munich,Germanywww.polymer-process.comNotforuseininternetorintranetsites.Notforelectronicdistribution.
4. D. Salaberger et al.: Evaluation of CT Data to Determine Fibre Length Distribution
every fibre very well. For sub-lm-CT and high resolution
(Fig. 2C, 2 lm) the data quality is also good enough to separate
single fibres. When resolution decreases (Fig. 2A, 12 lm) single
fibres cannot be resolved properly any more. A similar result is
achieved with l-CT with the disadvantage of only half the size
of measurement volume compared to sub-lm-CT.
3.1 Determination of Fibre Orientation Distribution
For two rings, one produced by injection-moulding, the other by
extrusion, the software pipeline of concept 1 was applied. It was
expected that the fibre orientations would display different be-
haviour. For the extrusion process the main fibre orientation
should point in the direction of extrusion. For injection-mould-
ing the fibres should show a main orientation within the axial
plane following the shape of the ring. This behaviour is clearly
visible in Fig. 3. On the right most fibres are coloured red which
shows that most of the fibres are oriented in the X-direction. On
the left of the image the fibres are mainly coloured green and
blue which means that most fibres are lying in parallel planes
that are oriented in the direction of injection. In addition one
can detect the position of the gate and a weld line because at
these points the expected fibre orientation is disturbed.
Quantitative analysis of the orientation can be performed by
calculating a mean fibre orientation tensor for the whole speci-
men (Table 2). The elements of the main diagonal (a11, a22,
a33) describe the strength of orientation in the three axes of co-
ordinates. The results for the injection-moulded ring show simi-
lar values in the plane of the flow (Y and Z) and the lowest value
in the third coordinate axis. The value in direction X is highest
for the extruded ring since this is the direction of extrusion.
Very similar results can be gained by performing l-CT
scans. Even with limited data quality or limited resolution the
orientation of the fibres is visible and can be quantified using
appropriate software algorithms.
3.2 Evaluation of Data Analysis Concepts
3.2.1 Qualitative Evaluation
For the design of filters for concept 2, artificial CT data sets
were produced using CT simulation. Scenarios of touching fi-
bres, which are common in the high con-
tent specimens, were simulated to be able
to investigate the influence of filter pa-
rameters and different algorithms on the
extracted fibres. The results of this inves-
tigation lead to the choice of filters for
the improved concept 2.
Two scenarios that were simulated are
shown in Fig. 4. Most of the typical struc-
tures in the region of fibres touching can
be analysed correctly. In Fig. 4D the long
vertical fibre is broken because of the
sharp angle between the two touching fi-
bres. Especially this kind of touching
structure and also parallel fibres were
found most difficult for analysing.
Since every fibre in the artificial data
sets is defined entirely, these data sets
will also be used as reference for parame-
ters like fibre diameter, surface and vol-
ume.
3.2.2 Quantitative Evaluation
To be able to identify how many fibres
within the analysed volume are repre-
sented correctly, the total number of fi-
bres was determined by a manual data
analysis. For each fibre a cylinder was
fitted to guarantee counting each fibre
286 Intern. Polymer Processing XXVI (2011) 3
Fig. 3. 3D views of the extracted fibres for an injection-moulded (left) and an extruded (right)
ring. The orientation of the fibres is visualised by colour coding with voxel size: 5 lm
Orientation Production
Injection-moulded Extruded
a11 (X) 0.26 0.49
a22 (Y) 0.38 0.25
a33 (Z) 0.36 0.26
Table 2. Elements of main diagonal of orientation tensor for two
ring-shaped specimens
2011CarlHanserVerlag,Munich,Germanywww.polymer-process.comNotforuseininternetorintranetsites.Notforelectronicdistribution.
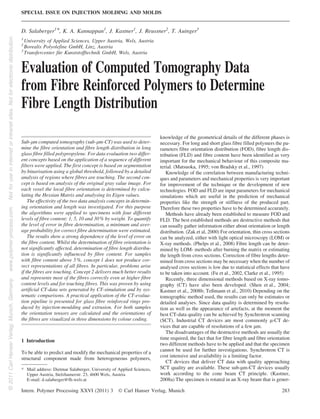
5. only once. In Fig. 5 the fibres are shown semi-transparent so
the fitted cylinders as well as the fibres can be seen. For the
evaluation of the algorithms all specimens were scanned at
2 lm voxel size.
The aim was not only to analyse the
quality of the result of extraction by look-
ing at images but also to quantify errors.
The problem is the determination of the
objective fact since no other 3D method
is available to extract fibres and a com-
parison with destructive methods is not
absolutely valid. Quantitative evaluations
were performed using concept 1 only. In
a first step the result of the automated
analysis was evaluated in terms of correct
number of fibres, see Table 3.
For investigation of the reason for the
errors in number of fibres, images of the
binarised, the binary thinned as well as
the extracted fibres were analysed.
(Fig. 5) These images showed that prob-
lems only occur in points where fibres
are touching. Free fibres are represented
correctly.
Two reasons were identified for the wrong extraction for
concept 1: binarisation and binary thinning. Due to artifacts
that influence the grey values for the fibres in different regions
of the data set, global thresholding will lead to the loss of small
fibres, if the threshold is too high. On the other hand the touch-
ing areas will increase if the threshold is too low.
Areas of touching fibres, the clusters, affect the result of bin-
ary thinning in such a way that the number of fibres cannot be
reconstructed in this area. Fibres that run parallel within a
small distance cannot be separated using concept 1. The aver-
age orientation that can be calculated for predefined volumes
is not affected much by these limitations of the applied filters.
Fig. 5 shows intermediate results of the filter pipeline of con-
cept 1 and concept 2. The original image contains seven fibres
that are touching at different angles. The images show the lim-
itations of applying binary thinning to the binarised data
(Fig. 5D). It is clearly visible that the two horizontal fibres can-
not be represented correctly on the right of the sample. In the im-
age of extracted fibres (Fig. 5F) one can count eight fibres but
more than one fibre is not represented correctly. Applying con-
cept 2 to the original data the medial region of the fibres can be
extracted well (Fig. 5C). Only very small fragments remain
mainly in cluster regions and at the surface of the fibres. These
fragments usually have a length smaller than the diameter and
can be removed by applying a length threshold at the end of the
evaluation without losing real fibres. Image (Fig. 5E) shows the
correct number and representation of fibres.
D. Salaberger et al.: Evaluation of CT Data to Determine Fibre Length Distribution
Intern. Polymer Processing XXVI (2011) 3 287
Fig. 4. 3D views of two simulated fibre network scenarios. Original grey value image (A, C), fi-
bre extraction result (B, D)
A) B)
C) D)
E) F)
Fig. 5. 3D images of subsequent results of different stages of the data
analysis pipeline. Cluster regions for 20% fibre content are shown:
original (A), binarisation (B), skeleton (C, D), extracted fibres (E, F),
concept 1 (C, E), concept 2 (D, F)
Specimen Manually
counted fibres
Total fibres Error in No.
of fibres
%
1% small 85 99 16.5
5% small 107 112 4.7
10% 175 179 2.3
30% 112 130 16.1
Table 3. Comparison of number of fibres counted manually and total
fibres extracted automatically
2011CarlHanserVerlag,Munich,Germanywww.polymer-process.comNotforuseininternetorintranetsites.Notforelectronicdistribution.
6. D. Salaberger et al.: Evaluation of CT Data to Determine Fibre Length Distribution
The effects of binarisation using global threshold and binary
thinning lead to the conclusion, that taking only the error in the
number of fibres into account is not sufficient to estimate the
overall error of the whole fibre extraction process.
From the fact that free fibres are always extracted in a cor-
rect way, we can define a minimum probability, PM, for ex-
tracting the fibres correctly (Table 4):
PM ¼
Free fibres
Total fibres
Á 100 %:
For the cluster fibres it turned out that, depending on the fibre
content, the error varies. Fig. 5 shows the main disadvantage
of global thresholding and binary thinning. Depending on the
grey value threshold in regions where fibres are close together
or touching, the area of touching varies. In the subsequent step
of binary thinning this area is transformed into a line of voxels.
The available cluster analysis was not capable of extracting
and combining the fibre fragments properly.
Since the complexity of the analysis and also artifacts in-
crease with increasing fibre content a trust factor t was defined.
The factor t was chosen by experience and was used to estimate
an average probability of extracting fibres correctly. The idea
is to estimate how many fibre segments are extracted and
joined together correctly. Different common geometries were
found in the touching areas. The complexity of these geome-
tries in respect of cluster analysis is similar for 1 and 5% fibre
content and is higher for 10 and 30%. The factor t was there-
fore set to 0.5 for 1 and 5% and to 0.25 for 10 and 30%. This
means that we expect a chance of 50% to join fibre segments
correctly in cluster regions for 1 and 5% fibre content (Ta-
ble 5).
PA ¼
Cluster fibres
Total fibres
Á t Á 100 % þ PM:
The problem discussed above was overcome to a great extent
by introducing the second software concept. Avoiding apply-
ing a global threshold leads to a much better representation of
the medial region. Applying binary thinning to this data leads
to a correct separation of fibres even with high fibre content.
3.3 Influence of Size of Analysed Volume on FLD and FOD
Since every fibre is represented by its start and endpoint after
extraction it is easy to calculate the orientation tensor for every
fibre. In Table 6 the average values for a11 (X-direction), a22
(Y-direction) and a33 (Z-direction) for all specimens with 1%
fibre content are shown.
Fig. 6 shows a comparison of original CT data and the result
of fibre extraction according to concept 1.
The top image shows the manually fitted cylinders and the
fibres whereas the image at the bottom shows the extracted fi-
bres using glyphs that connect every start and endpoint.
Most of the extracted fibres have corresponding fibres in the
original data. For bent fibres a straight line is drawn since the
algorithm was not designed for bent fibres and the represented
glyphs are straight lines. The colour of the glyphs gives infor-
mation about the orientation. It can be seen that many fibres
are coloured red, which means that there is a preferred orienta-
tion. In this case it is the z-direction which is the direction of in-
jection. Also the quantitative analysis shows the same result as
a33 has the highest value in both sample volumes.
A small sample volume is needed to achieve high resolu-
tions. Long fibres may not be completely contained in the sam-
ple volume. To investigate this effect, two different data sets
were generated for one scan of the 1% specimen. The edge
length of the small sample volume was ca. 1.1 mm and ca.
2 mm for the larger sample volume. Fig. 7 and Fig. 8 show the
results of the automated fibre extraction in terms of fibre
length.
The first length class was set to approximately twice the fi-
bre diameter (28 lm). Elements in this class are generally fibre
fragments that don’t have the ideal cylindrical shape of a fibre
288 Intern. Polymer Processing XXVI (2011) 3
Specimen Total fibres Free fibres Minimum
probability PM
%
1% small 99 66 67
5% small 112 77 69
10% 179 87 49
30% 130 19 15
Table 4. Estimate of the minimum probability of extracting the fibres
correctly from the number of free fibres
Specimen Cluster
fibres
t Average
probability PA
%
1% small 33 0.50 84
5% small 35 0.50 85
10% 92 0.25 62
30% 111 0.25 36
Table 5. Estimation of average probability to extract fibres cor-
rectly
Specimen Fibre count a 11
X
a 22
Y
a 33
Z
Mean fibre length
lm
Max fibre length
mm
1% small 84 0.12 0.18 0.70 417 1.12
1% large 493 0.24 0.08 0.68 446 1.65
Table 6. Number of extracted fibres that are longer than twice the diameter (28 lm), elements of the main diagonal of the orientation tensor
and mean and maximum fibre length; concept 1 applied
2011CarlHanserVerlag,Munich,Germanywww.polymer-process.comNotforuseininternetorintranetsites.Notforelectronicdistribution.
7. any more. There is no contribution by these fibres to reinforce-
ment since a critical fibre length can be determined (Vas, 2009)
that is the minimum necessary for reinforcement.
FLD for both sample volumes shows a similar result. The
average fibre length without fibre fragments is 417 lm for the
small and 446 lm for the larger volume. In the larger sample vol-
ume the frequency of the fragments is, at 33%, higher than in the
small volume, at 15%. An error will underlay the results of FLD
according to the previous results of data analysis evaluation.
Nevertheless, the results accord well with the visual inspection
since for example fibre fragments are visible in the slice images
as well. The proportion of long fibres is very similar in both sam-
ple volumes. The longest fibre in the smaller sample volume is
1.12 mm and in the larger sample volume 1.65 mm long.
3.4 Comparison of Standard Method and CT Data Analysis
for FLD
For a tensile bar test specimen, filled with 5% by weight glass
fibres, a well established method was applied to determine
FLD. The matrix was burned by pyrolysis, the remaining fibres
were then analysed by light optical microscopic analyses. The
analysis was carried out for 100 fibres with a minimum fibre
length of 43 lm.
The comparison of length distribution determined by CT
and the standard method show slightly different results. A shift
D. Salaberger et al.: Evaluation of CT Data to Determine Fibre Length Distribution
Intern. Polymer Processing XXVI (2011) 3 289
A)
B)
Fig. 6. 3D images of original CT data (A) and extracted fibres (B) for
1% fibre content and small sample volume
Fig. 7. Fibre length distribution for 1% fibre content and small sam-
ple volume (edge length: 1.1 mm)
Fig. 8. Fibre length distribution for 1% fibre content and large sam-
ple volume (edge length: 2 mm)
2011CarlHanserVerlag,Munich,Germanywww.polymer-process.comNotforuseininternetorintranetsites.Notforelectronicdistribution.
8. D. Salaberger et al.: Evaluation of CT Data to Determine Fibre Length Distribution
towards smaller lengths can be observed for CT analysis.
While the number of fibres analysed using CT data and con-
cept 1 is 1881, which is much higher compared to 100 fibres
for the standard method, mean fibre length differs from
352 lm to 751 lm. From concept 2, 1942 fibres were ex-
tracted and the mean fibre length was 373 lm.
FLD determined by concept 1 and concept 2 are almost sim-
ilar and shown in Fig. 9. Unfortunately it was not possible to
investigate exactly the same volume of the specimen with both
methods. However two specimens were prepared from the
same tensile bar.
Differences in FLD can be explained by the small number of
fibres which were analysed by the standard method. In a small
degree remaining errors in the software concepts contribute to
the difference.
4 Conclusions
Investigations were presented on the application of X-ray com-
puted tomography to determine fibre length and fibre orienta-
tion distribution.
In a first step, a CT-data analysis pipeline was developed
and applied to CT-data of specimens with fibre content be-
tween 1 and 30% by weight. 2 lm voxel size was identified
as applicable voxel resolution to be able to achieve sufficient
data quality together with acceptable sample volume. For eva-
luation of the software concept, error estimates were carried
out that showed an increase in error with increasing fibre con-
tent. The reason is the higher complexity of fibre network with
higher fibre content. The number of regions, where fibres are
touching, increases. The analysis of these regions is a crucial
task within the software pipeline because in contrast to free fi-
bres, the cluster regions induce errors in fibre extraction. For
the reduction of errors new filters were designed to pre- process
the data for subsequent cluster analysis.
The improvement could be shown on small samples of real
data sets and simulated data containing representative cluster
arrangements.
The comparison of CT data analysis and standard FLD de-
termination showed a shift to smaller fibre lengths for CT data
analysis.
The expected error for 5% fibre content is low and the num-
ber of free fibres is increased using concept 2. In addition the
difference of FLD between concept 1 and concept 2 is rather
small. For the investigated specimen this can lead to the con-
clusion that the FLD from CT-data analysis is more realistic
than the FLD from the given pyrolysis analysis.
An issue that has to be investigated more closely is the influ-
ence of the volume that is analysed. It was shown that not all fi-
bres are completely contained within the analysed volume
which leads to a shift of lengths to lower values. The investiga-
tions on the 1% specimen showed that the FLD changes only
slightly when the analysed volume is increased fourfold. Espe-
cially for areas where fibres are mainly oriented in one direc-
tion the size of specimen in this direction should be high.
For ring-shaped specimens the advantages of 3D tomo-
graphic methods were demonstrated. Both FOD and FLD can
be determined using the same data set without destroying the
specimen.
Acknowledgements
This study was supported by the Austrian Research Promotion
Agency (FFG). We thank our partner companies Borealis Poly-
olefins and Transfercenter for Polymer Technology (TCKT)
for delivering specimens and performing standard testing. Spe-
cial thanks go to Christoph Heinzl and Michael Reiter, who
supported the development of software concepts.
References
Bradsky von, G. J., et al., “Characterisation of Finite Length Compo-
sites – Part IV: Structural Studies on Injection-Moulded Compo-
sites”, Pure Appl. Chem., 12, 2523–2539 (1997)
Clarke, A. R., et al., “A Novel Technique for Determining the 3D Spa-
tial Distribution of Glass Fibres in Polymer Composites”, Comp.
Sci. Tech., 55, 75–91 (1995), DOI:10.1016/0266-3538(95)00087-9
Fu, S., et al., “Correction of the Measurement of Fiber Length of Short
Fiber Reinforced Thermoplastics”, Composites Part A., 33, 1549–
1555 (2002), DOI:10.1016/S1359-835X(02)00114-8
Kastner, J. (Ed.): ,,Industrielle Computertomografie Tagung, Wels,
Austria, Shaker Verlag, Aachen (2008a)
Kastner, J., et al., “Determination of Diameter, Length and Three-di-
mensional Distribution of Fibres in Short Glass-fibre Reinforced In-
jection-moulded Parts by l-X-ray Computed Tomography”, Pro-
ceedings PPS24, Salerno, Italy (2008b)
Kastner, J., et al., “Method for Three-dimensional Evaluation and Vi-
sualization of the Distribution of Fibres in Glass-fibre Reinforced
Injection Molded Parts by l-X-ray Computed Tomography”,
WCNDT Proceedings CD, Shanghai (2008c)
Matsuoka, T., “Chapter 3 Fiber Orientation Prediction in Injection
Molding”, in Polypropylene Structure, Blends and Composites, Vol-
ume 3 Composites, Karger-Kocsis, J. (Ed.), Chapman Hall, Lon-
don, p. 113–141 (1995)
Otsu, N., “A Threshold Selection Method from Grey Level Histo-
grams”, IEEE Transactions on Systems, Man, and Cybernetics, 9,
62–66 (1979)
290 Intern. Polymer Processing XXVI (2011) 3
Fig. 9. Fibre length distribution for 5% fibre content and larger sam-
ple volume, concept 1 and length threshold 43 lm applied
2011CarlHanserVerlag,Munich,Germanywww.polymer-process.comNotforuseininternetorintranetsites.Notforelectronicdistribution.
9. Park, C. H., et al., “A Study on Fibre Orientation in the Compression
Molding of Fibre Reinforced Polymer Composite Materials”, Mat.
Proc. Tech., 11, 233–239 (2001),
DOI:10.1016/S0924-0136(01)00523-4
Phelps, J. H., et al., “New Models for Fibre Orientation in Injection
Molded Composites”, Proceedings PPS24, Salerno, Italy (2008)
Reiter, M., et al., “Improvement of X-ray Image Acquisition Using a
GPU Based 3D CT Simulation Tool”, SPIE Quality Control by Arti-
ficial Vision Wels, Austria (2009)
Requena, G., et al., “3D-Quantification of the Distribution of Continu-
ous Fibres in Unidirectionally reinforced Composites”, Composites
Part A, 40, 152–163, (2009),
DOI:10.1016/j.compositesa.2008.10.014
Shen, H., et al., “Direct Observation and Measurement of Fibre Archi-
tecture in Short fibre Polymer Composite Foam through Micro-CT
Imaging”, Comp. Sci. Tech., 64, 2113–2120 (2004),
DOI:10.1016/j.compscitech.2004.03.003
Teßmann, M., et al., “Automatic Determination of Fiber Length Distri-
bution in Composite Material Using 3D CT Data”, EURASIP Jour-
nal on Advances in Signal Processing, article ID 545030 (2010),
DOI:10.1155/2010/545030
Vas, L. M., et al., “Active Fiber Length Distribution and its Applica-
tion to Determine the Critical Fiber Length”, Polym. Test., vol. 28,
Oct. 2009, pp. 752–759
Vincent, M., et al., “Description and Modelling of Fibre Orientation in
Injection Molding of Fibre Reinforced Thermoplastics”, Polymer,
46, 6719–6725 (2005), DOI:10.1016/j.polymer.2005.05.026
Zak, G., et al., “Estimation of Average Fibre Length in Short-fibre
Composites by a Two-Section Method”, Comp. Sci. Tech., 60,
1763–1772 (2000), DOI:10.1016/S0266-3538(00)00065-8
Date received: October 30, 2010
Date accepted: March 4, 2011
Bibliography
DOI 10.3139/217.2441
Intern. Polymer Processing
XXVI (2011) 3; page 283–291
ª Carl Hanser Verlag GmbH Co. KG
ISSN 0930-777X
You will find the article and additional material by enter-
ing the document number IIPP2441 on our website at
www.polymer-process.com
D. Salaberger et al.: Evaluation of CT Data to Determine Fibre Length Distribution
Intern. Polymer Processing XXVI (2011) 3 291
2011CarlHanserVerlag,Munich,Germanywww.polymer-process.comNotforuseininternetorintranetsites.Notforelectronicdistribution.