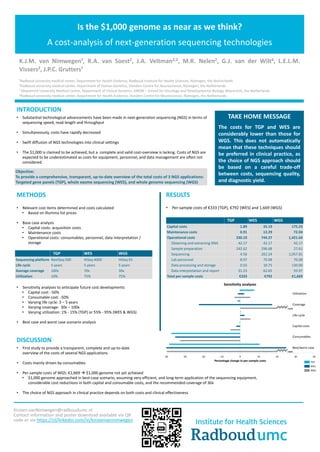
-40 -30 -20 -10 0 10 20 30 40
Percentage change in per-sample costs
Sensitivity analyses
Kirsten.vanNimwegen@radboudumc.nl
Contact information and poster download available via QR
code or via https://nl/linkedin.com/in/kirstenvannimwegen
INTRODUCTION
• Substantial technological advancements have been made in next-generation sequencing (NGS) in terms of
sequencing speed, read length and throughput
• Simultaneously, costs have rapidly decreased
• Swift diffusion of NGS technologies into clinical settings
• The $1,000 is claimed to be achieved, but a complete and valid cost-overview is lacking. Costs of NGS are
expected to be underestimated as costs for equipment, personnel, and data management are often not
considered.
Is the $1,000 genome as near as we think?
A cost-analysis of next-generation sequencing technologies
K.J.M. van Nimwegen¹, R.A. van Soest2, J.A. Veltman2,3, M.R. Nelen2, G.J. van der Wilt4, L.E.L.M.
Vissers2, J.P.C. Grutters¹
¹Radboud university medical center, Department for Health Evidence, Radboud Institute for Health Sciences, Nijmegen, the Netherlands
2Radboud university medical center, Department of Human Genetics, Donders Centre for Neuroscience, Nijmegen, the Netherlands
3 Maastricht University Medical Centre, Department of Clinical Genetics, GROW – School for Oncology and Developmental Biology, Maastricht, the Netherlands
4Radboud university medical center, Department for Health Evidence, Donders Centre for Neuroscience, Nijmegen, the Netherlands
DISCUSSION
• First study to provide a transparent, complete and up-to-date
overview of the costs of several NGS applications
• Costs mainly driven by consumables
• Per-sample costs of WGS: €1,669  $1,000 genome not yet achieved
• $1,000 genome approached in best-case scenario, assuming very efficient, and long-term application of the sequencing equipment,
considerable cost reductions in both capital and consumable costs, and the recommended coverage of 30x
• The choice of NGS approach in clinical practice depends on both costs and clinical effectiveness
TAKE HOME MESSAGE
The costs for TGP and WES are
considerably lower than those for
WGS. This does not automatically
mean that these techniques should
be preferred in clinical practice, as
the choice of NGS approach should
be based on a careful trade-off
between costs, sequencing quality,
and diagnostic yield.
RESULTS
• Per-sample costs of €333 (TGP), €792 (WES) and 1,669 (WGS)
Objective:
To provide a comprehensive, transparant, up-to-date overview of the total costs of 3 NGS applications:
Targeted gene panels (TGP), whole exome sequencing (WES), and whole genome sequencing (WGS)
TGP WES WGS
Sequencing platform NextSeq 500 HiSeq 4000 HiSeq X5
Life cycle 5 years 5 years 5 years
Average coverage 100x 70x 30x
Utilization 10% 75% 75%
TGP WES WGS
Capital costs 1.89 35.19 175.33
Maintenance costs 0.91 12.29 72.04
Operational costs 330.10 744.27 1,421.64
Obtaining and extracting DNA 42.17 42.17 42.17
Sample preparation 242.62 296.68 27.61
Sequencing 4.56 262.24 1,057.81
Lab personnel 8.97 70.08 70.08
Data processing and storage 0.55 10.75 130.00
Data interpretation and report 31.23 62.65 93.97
Total per-sample costs €333 €792 €1,669
+225%
TGP
WES
WGS
METHODS
• Relevant cost items determined and costs calculated
• Based on Illumina list prices
• Base case analysis
• Capital costs: acquisition costs
• Maintenance costs
• Operational costs: consumables, personnel, data interpretation /
storage
• Sensitivity analyses to anticipate future cost developments
• Capital cost: -50%
• Consumable cost: -50%
• Varying life cycle: 3 – 5 years
• Varying coverage: 30x – 100x
• Varying utilization: 1% - 15% (TGP) or 55% - 95% (WES & WGS)
• Best case and worst case scenario analysis
+369%
Utilization
Coverage
Life cycle
Consumables
Capital costs
Best/worst case

Poster ESHG

  • 1.
    -40 -30 -20-10 0 10 20 30 40 Percentage change in per-sample costs Sensitivity analyses Kirsten.vanNimwegen@radboudumc.nl Contact information and poster download available via QR code or via https://nl/linkedin.com/in/kirstenvannimwegen INTRODUCTION • Substantial technological advancements have been made in next-generation sequencing (NGS) in terms of sequencing speed, read length and throughput • Simultaneously, costs have rapidly decreased • Swift diffusion of NGS technologies into clinical settings • The $1,000 is claimed to be achieved, but a complete and valid cost-overview is lacking. Costs of NGS are expected to be underestimated as costs for equipment, personnel, and data management are often not considered. Is the $1,000 genome as near as we think? A cost-analysis of next-generation sequencing technologies K.J.M. van Nimwegen¹, R.A. van Soest2, J.A. Veltman2,3, M.R. Nelen2, G.J. van der Wilt4, L.E.L.M. Vissers2, J.P.C. Grutters¹ ¹Radboud university medical center, Department for Health Evidence, Radboud Institute for Health Sciences, Nijmegen, the Netherlands 2Radboud university medical center, Department of Human Genetics, Donders Centre for Neuroscience, Nijmegen, the Netherlands 3 Maastricht University Medical Centre, Department of Clinical Genetics, GROW – School for Oncology and Developmental Biology, Maastricht, the Netherlands 4Radboud university medical center, Department for Health Evidence, Donders Centre for Neuroscience, Nijmegen, the Netherlands DISCUSSION • First study to provide a transparent, complete and up-to-date overview of the costs of several NGS applications • Costs mainly driven by consumables • Per-sample costs of WGS: €1,669  $1,000 genome not yet achieved • $1,000 genome approached in best-case scenario, assuming very efficient, and long-term application of the sequencing equipment, considerable cost reductions in both capital and consumable costs, and the recommended coverage of 30x • The choice of NGS approach in clinical practice depends on both costs and clinical effectiveness TAKE HOME MESSAGE The costs for TGP and WES are considerably lower than those for WGS. This does not automatically mean that these techniques should be preferred in clinical practice, as the choice of NGS approach should be based on a careful trade-off between costs, sequencing quality, and diagnostic yield. RESULTS • Per-sample costs of €333 (TGP), €792 (WES) and 1,669 (WGS) Objective: To provide a comprehensive, transparant, up-to-date overview of the total costs of 3 NGS applications: Targeted gene panels (TGP), whole exome sequencing (WES), and whole genome sequencing (WGS) TGP WES WGS Sequencing platform NextSeq 500 HiSeq 4000 HiSeq X5 Life cycle 5 years 5 years 5 years Average coverage 100x 70x 30x Utilization 10% 75% 75% TGP WES WGS Capital costs 1.89 35.19 175.33 Maintenance costs 0.91 12.29 72.04 Operational costs 330.10 744.27 1,421.64 Obtaining and extracting DNA 42.17 42.17 42.17 Sample preparation 242.62 296.68 27.61 Sequencing 4.56 262.24 1,057.81 Lab personnel 8.97 70.08 70.08 Data processing and storage 0.55 10.75 130.00 Data interpretation and report 31.23 62.65 93.97 Total per-sample costs €333 €792 €1,669 +225% TGP WES WGS METHODS • Relevant cost items determined and costs calculated • Based on Illumina list prices • Base case analysis • Capital costs: acquisition costs • Maintenance costs • Operational costs: consumables, personnel, data interpretation / storage • Sensitivity analyses to anticipate future cost developments • Capital cost: -50% • Consumable cost: -50% • Varying life cycle: 3 – 5 years • Varying coverage: 30x – 100x • Varying utilization: 1% - 15% (TGP) or 55% - 95% (WES & WGS) • Best case and worst case scenario analysis +369% Utilization Coverage Life cycle Consumables Capital costs Best/worst case