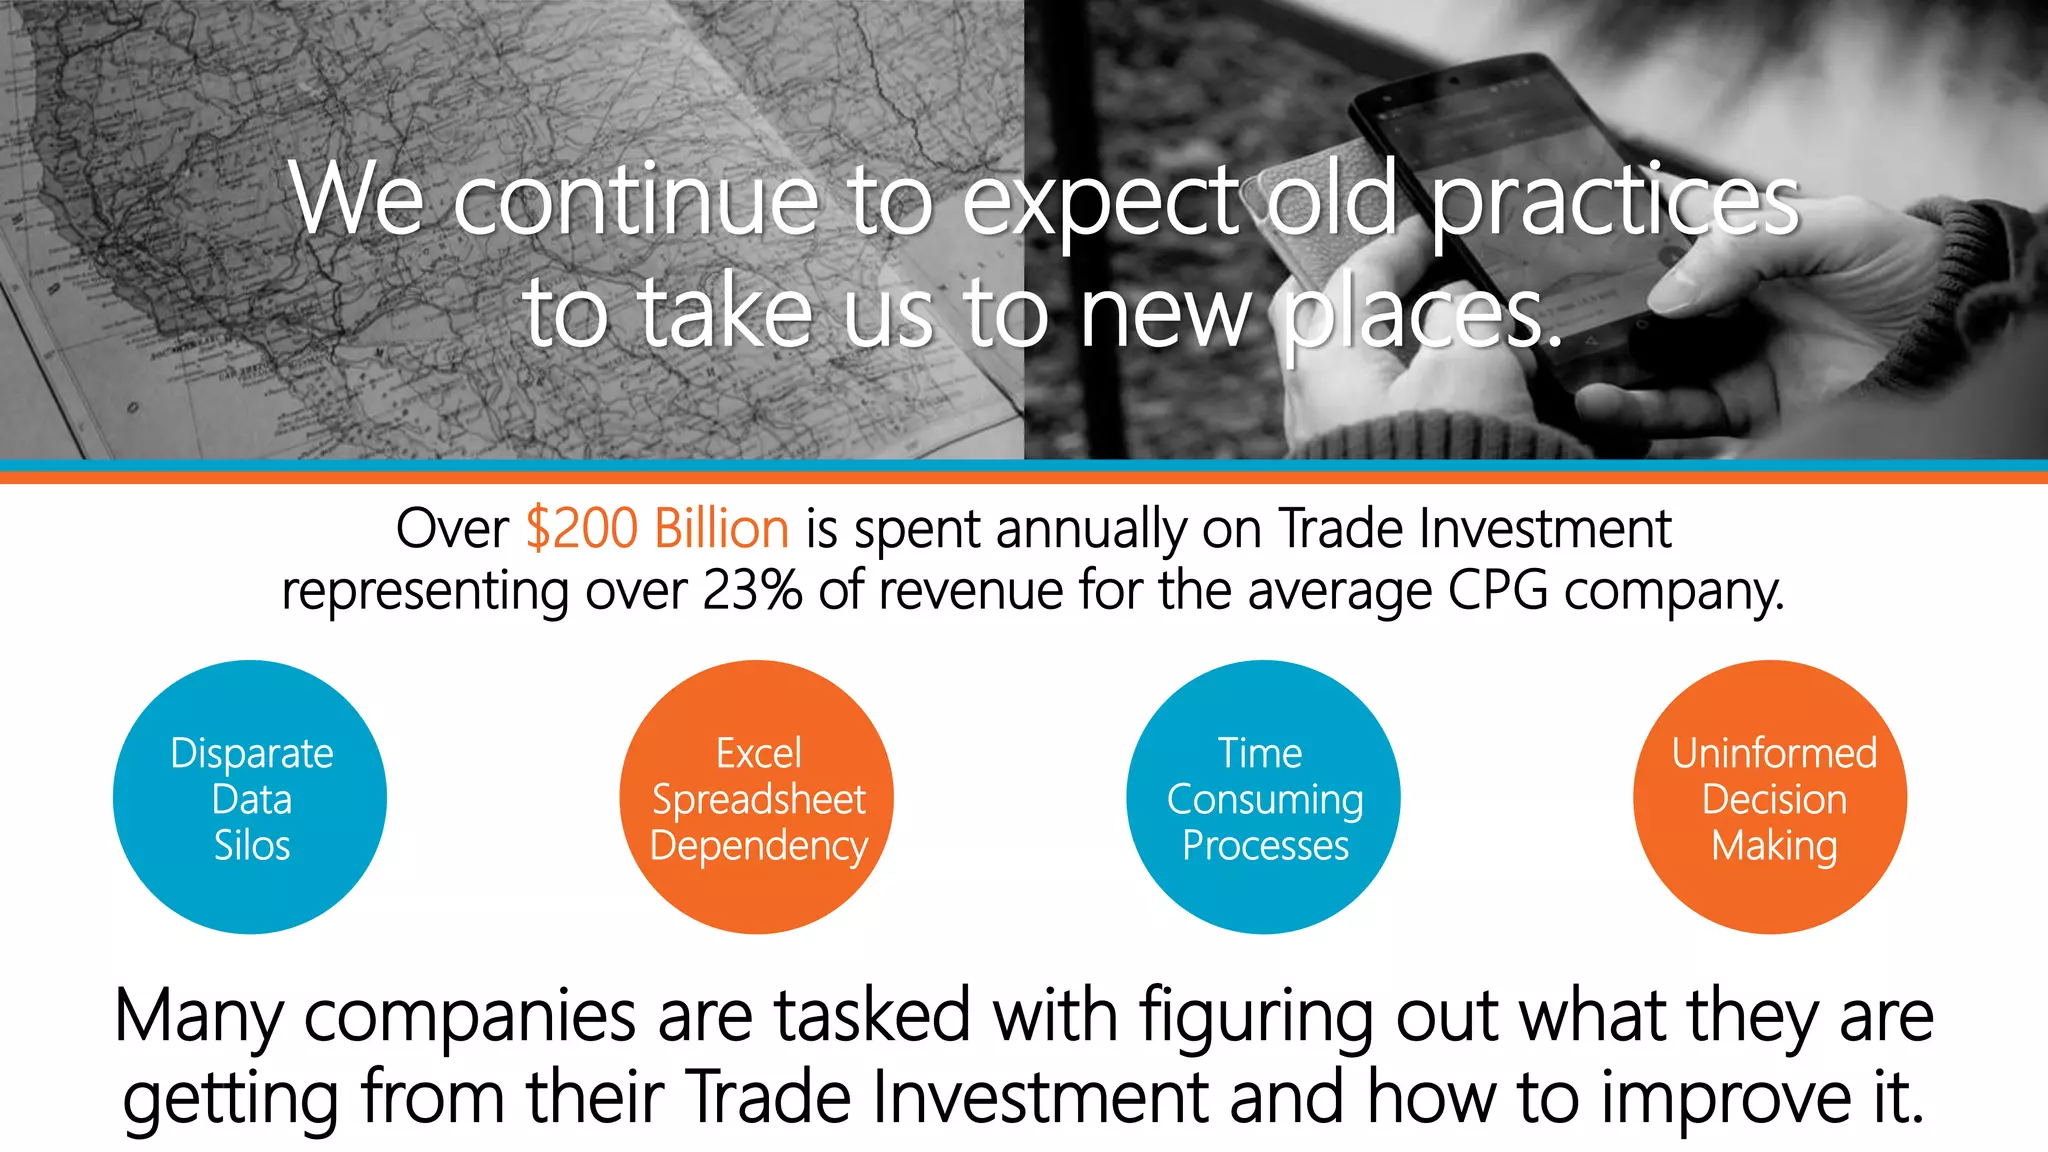
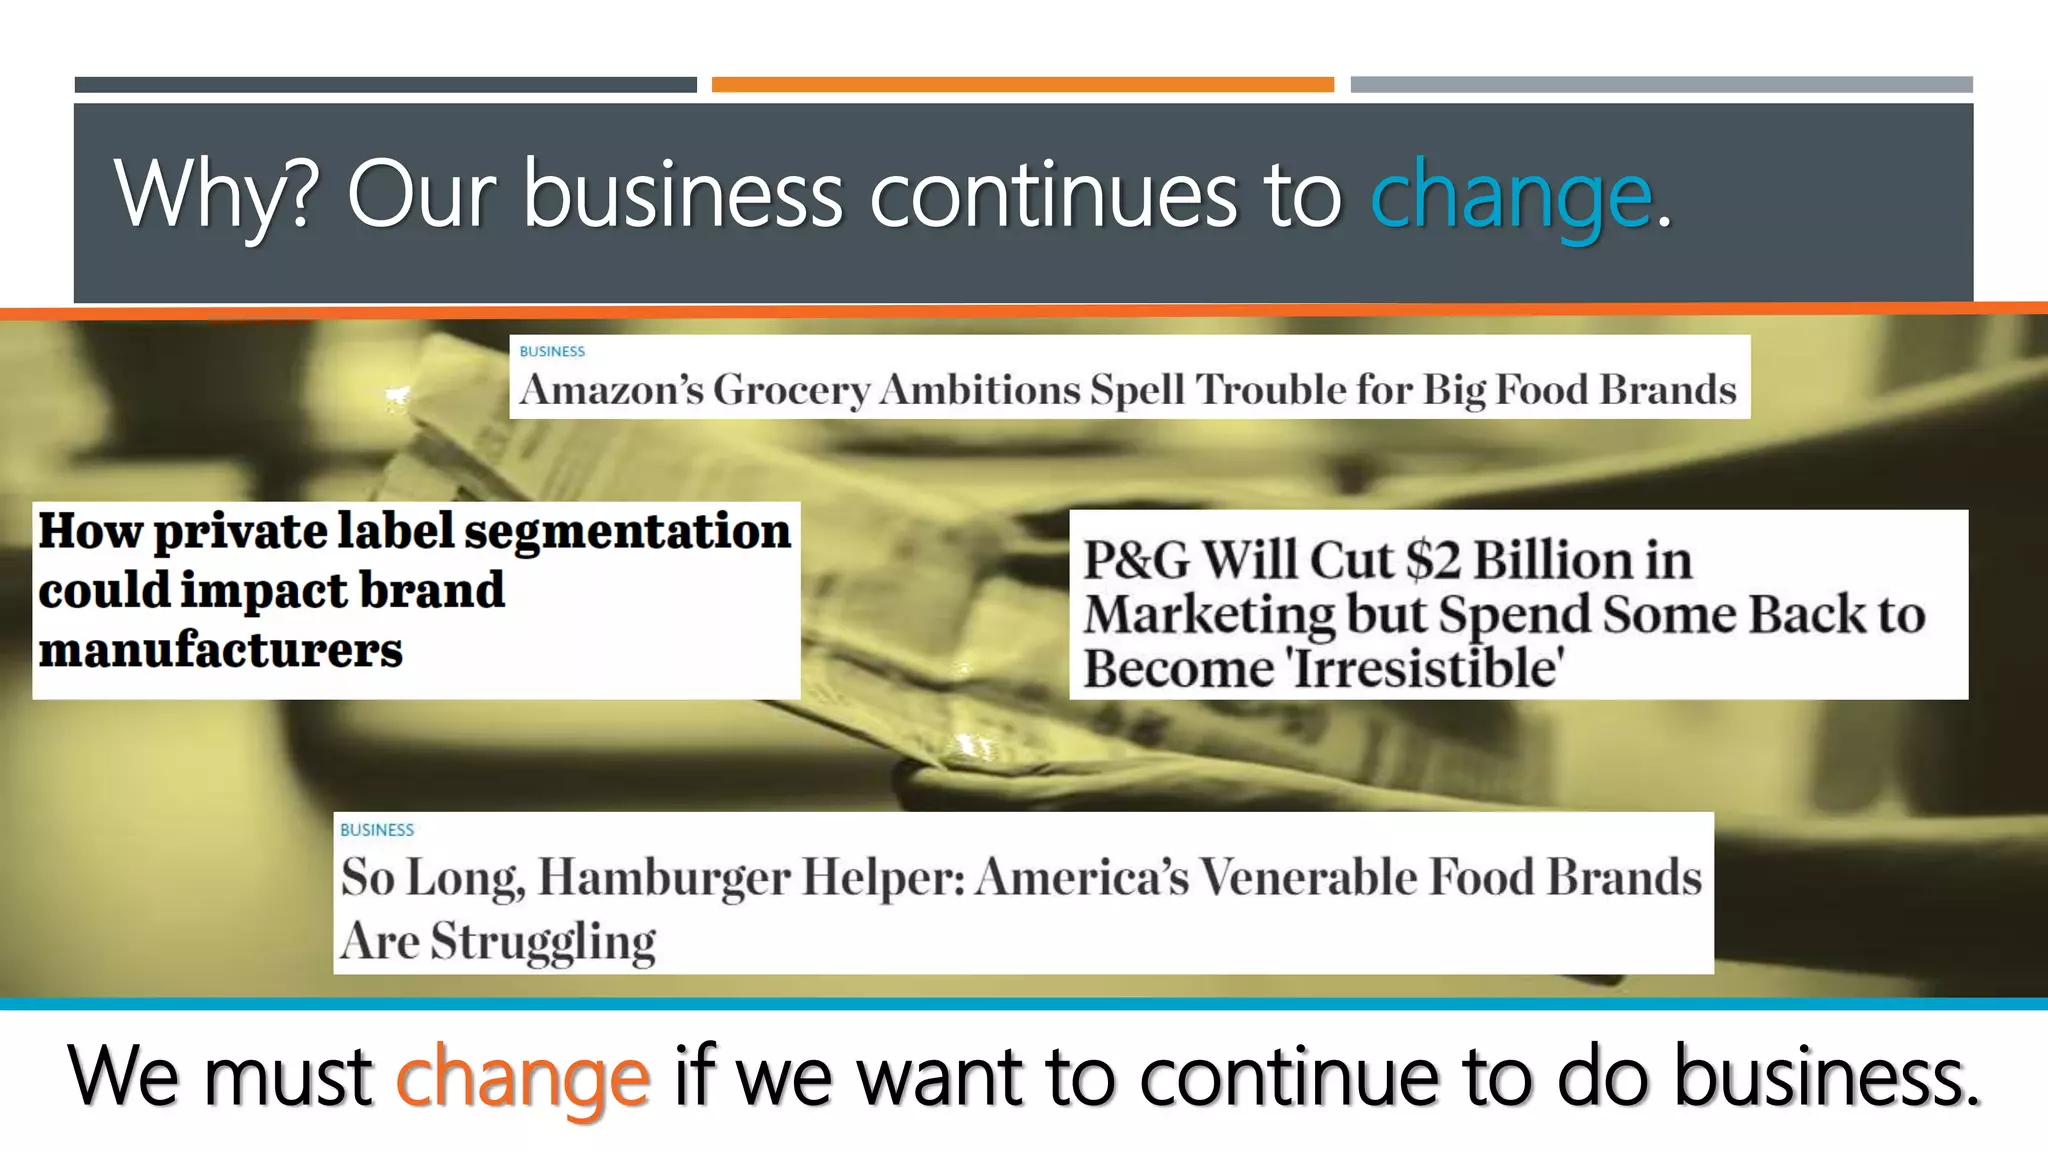
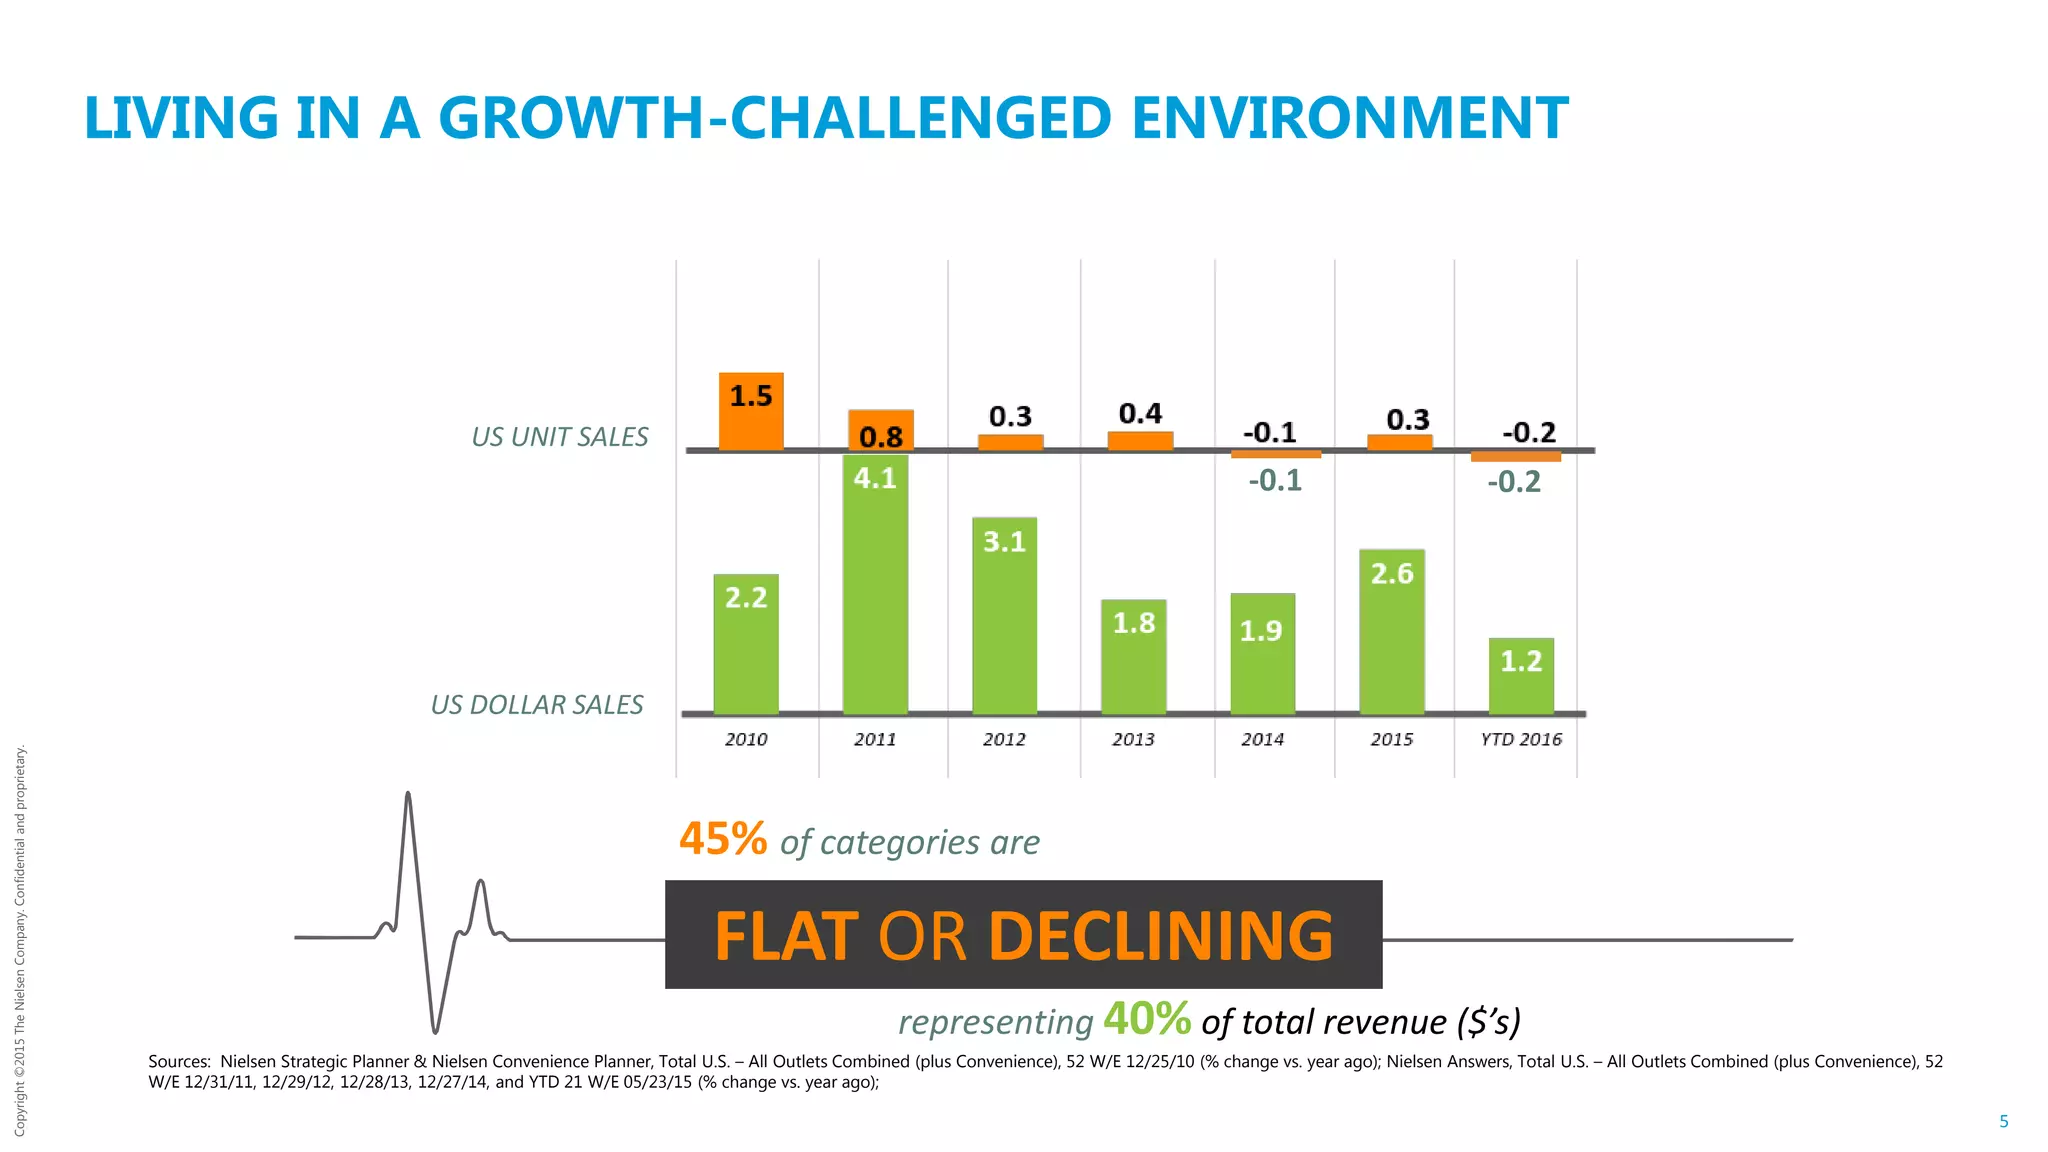
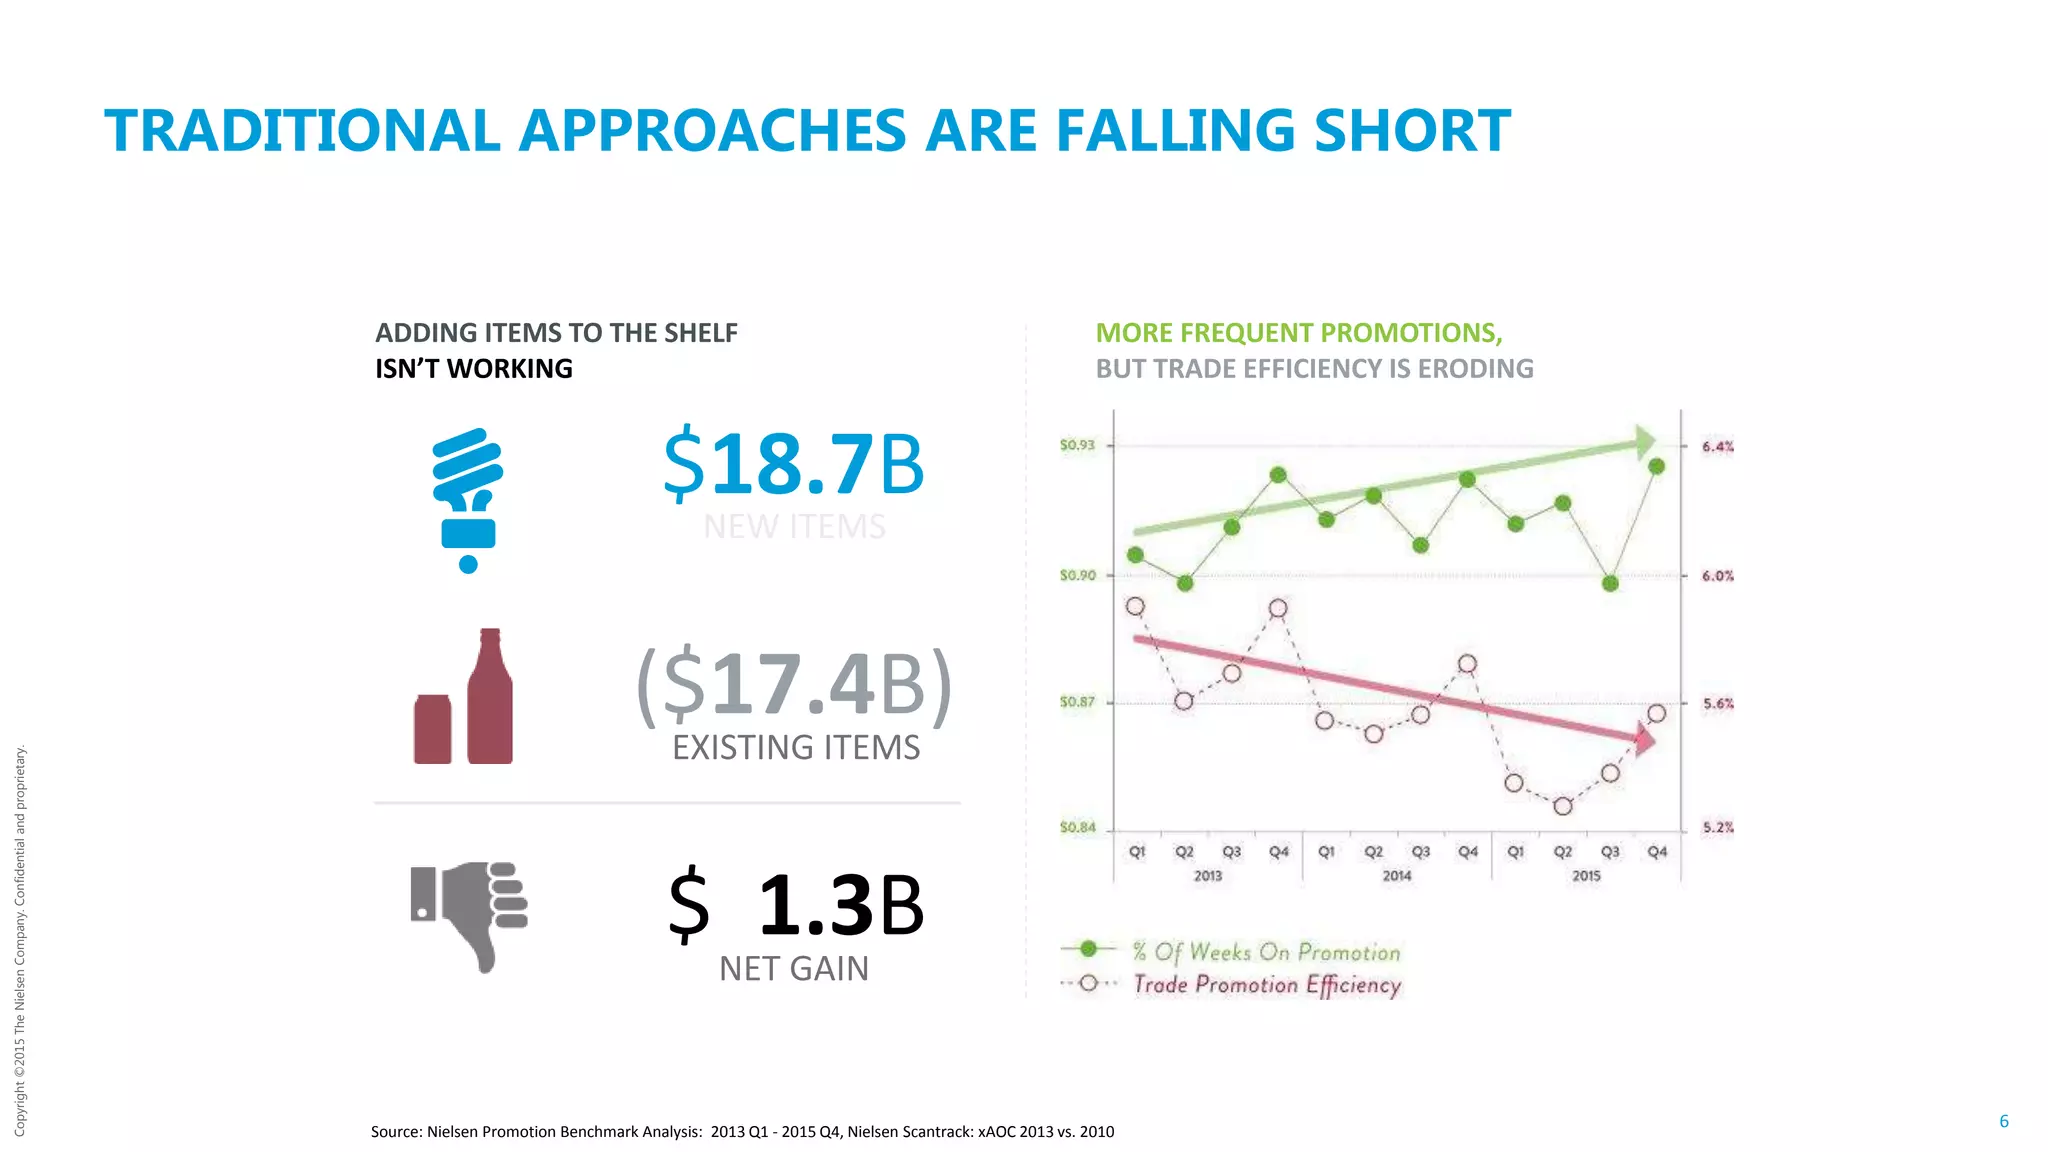
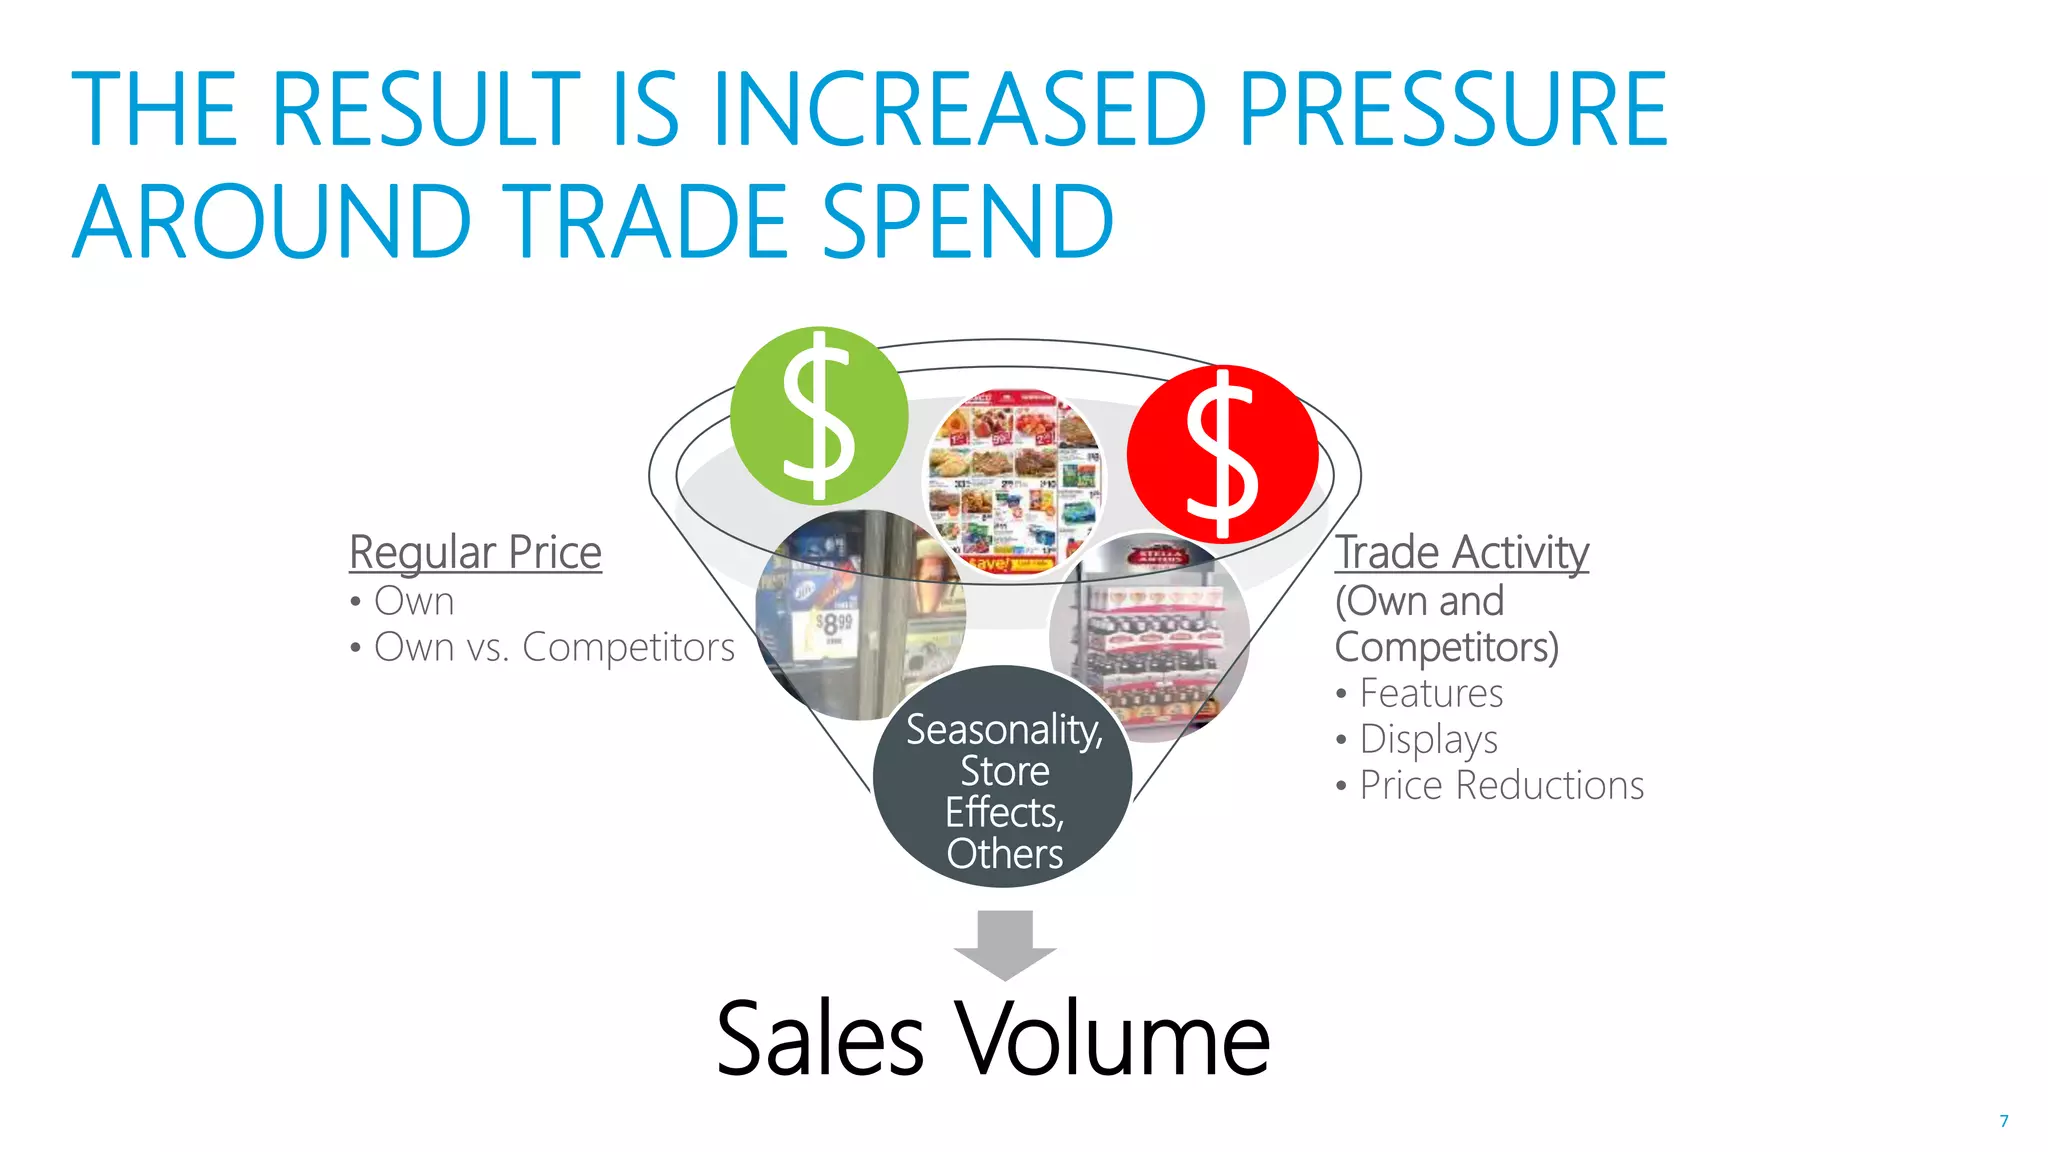
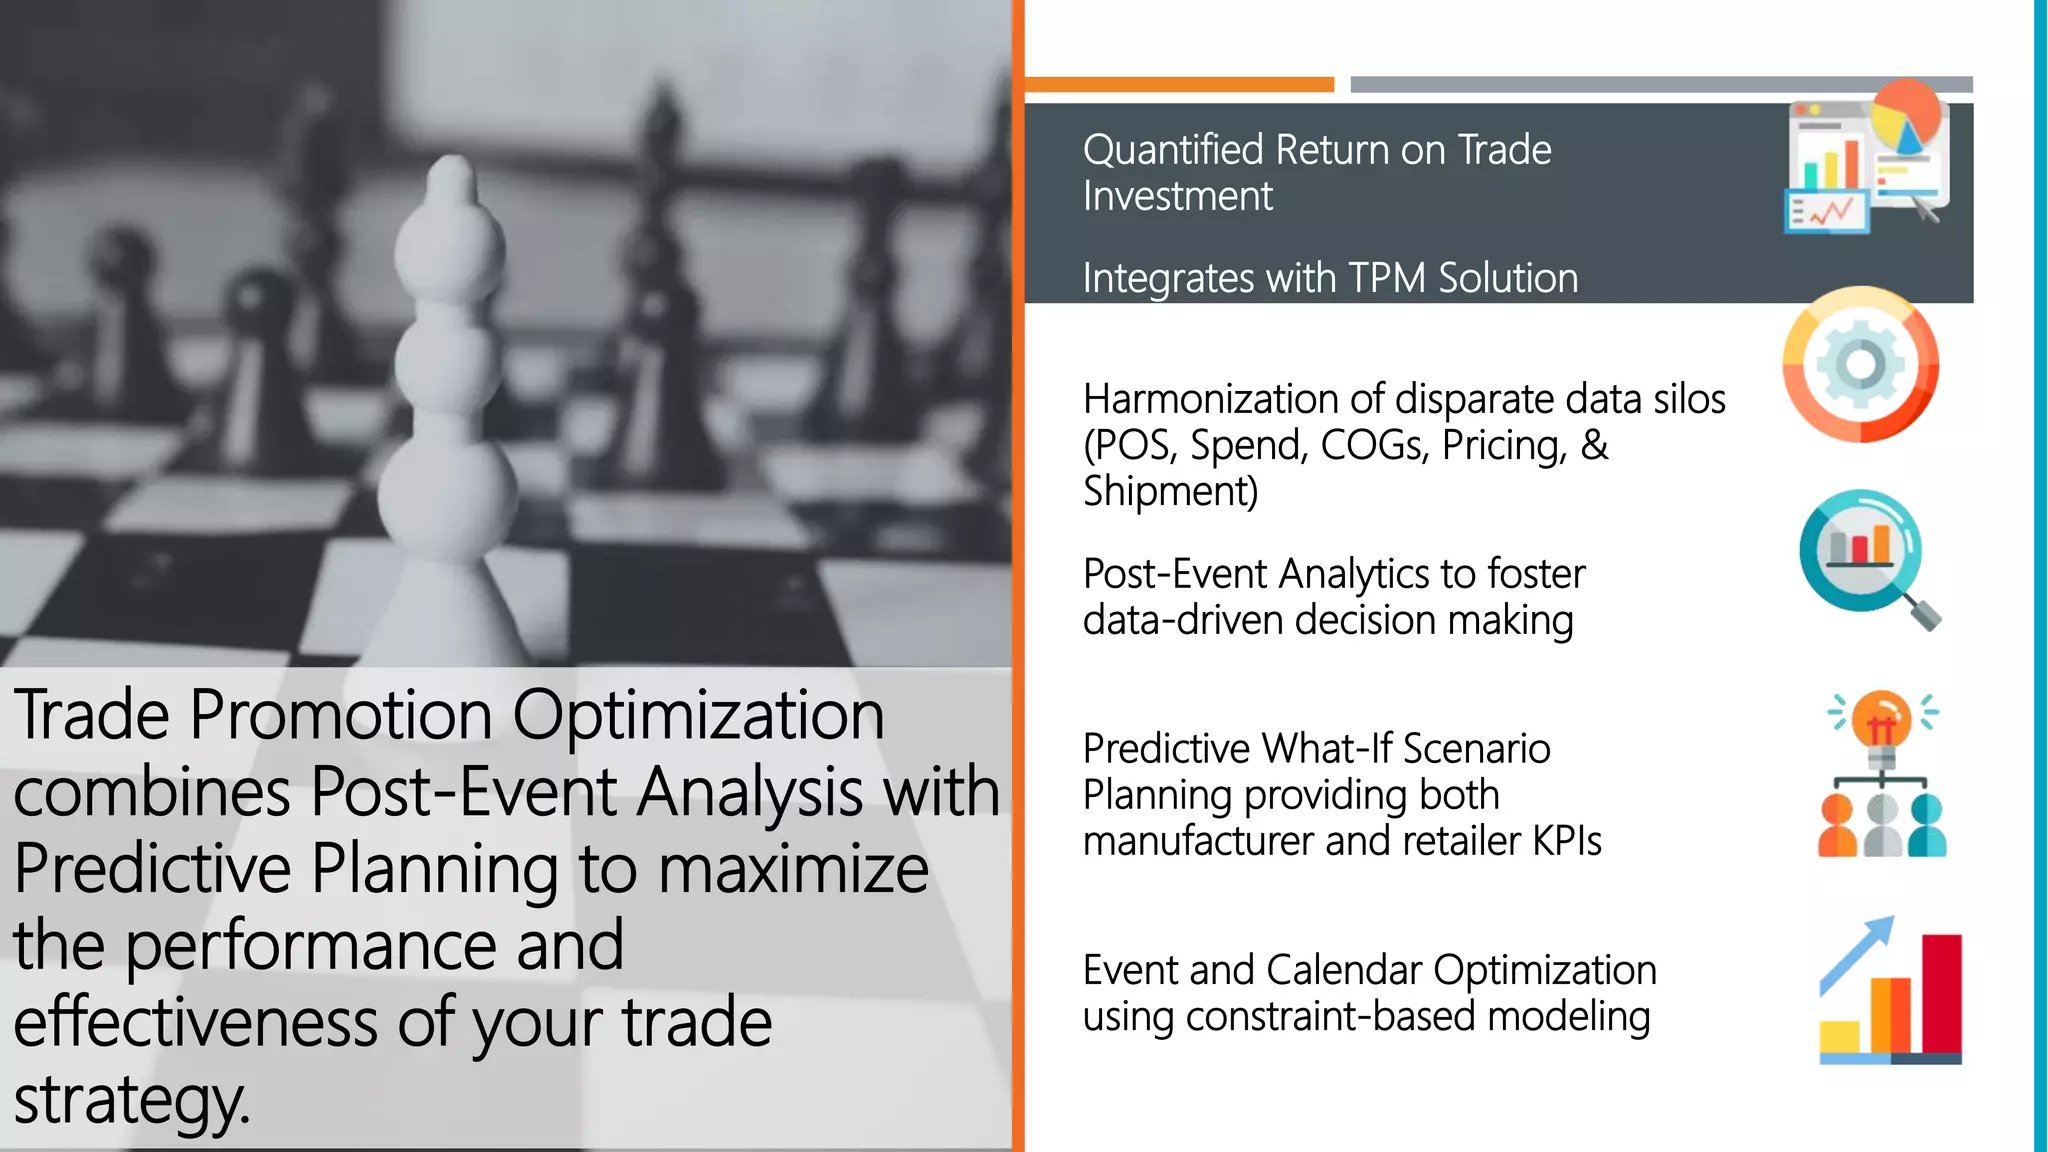
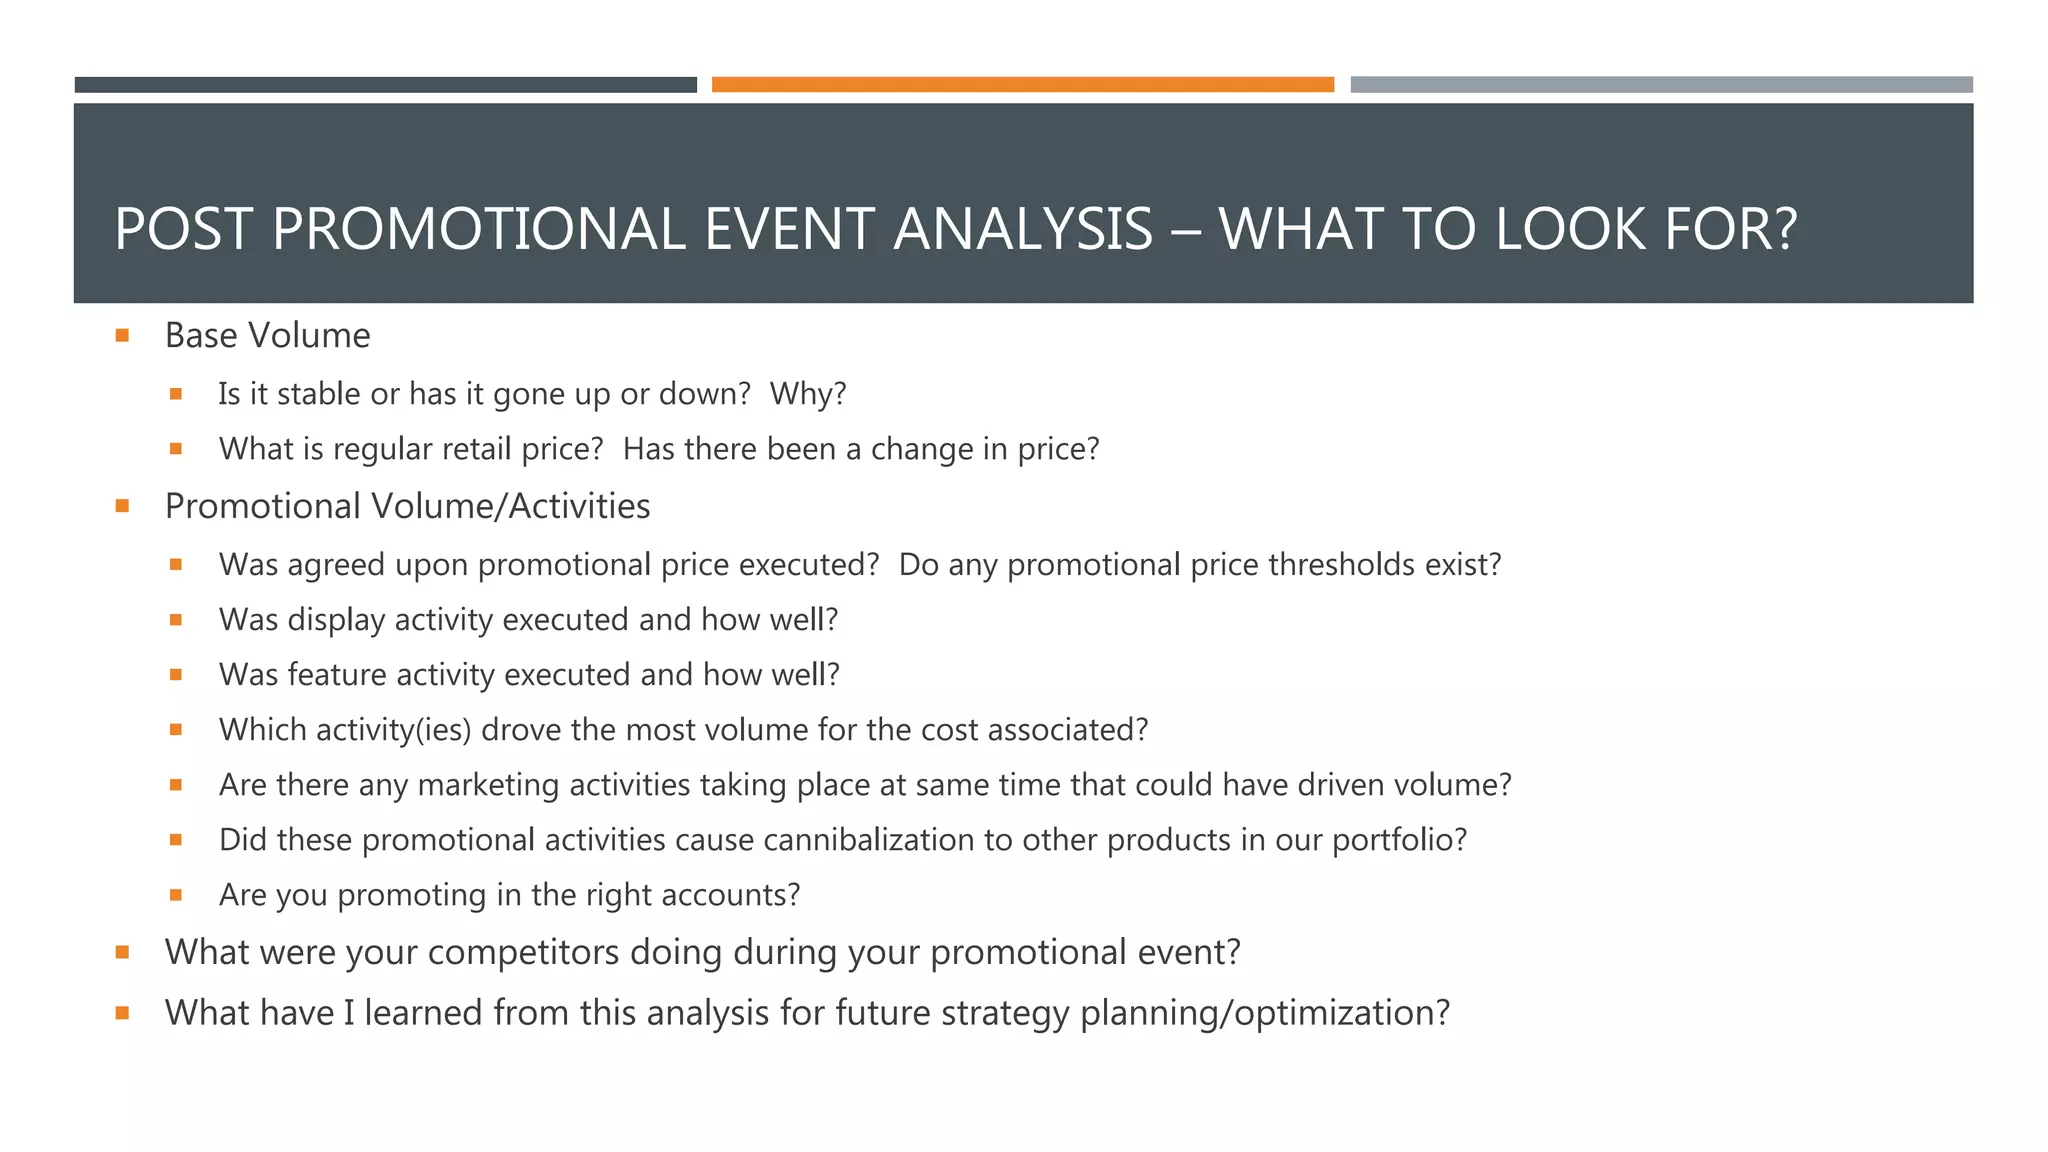
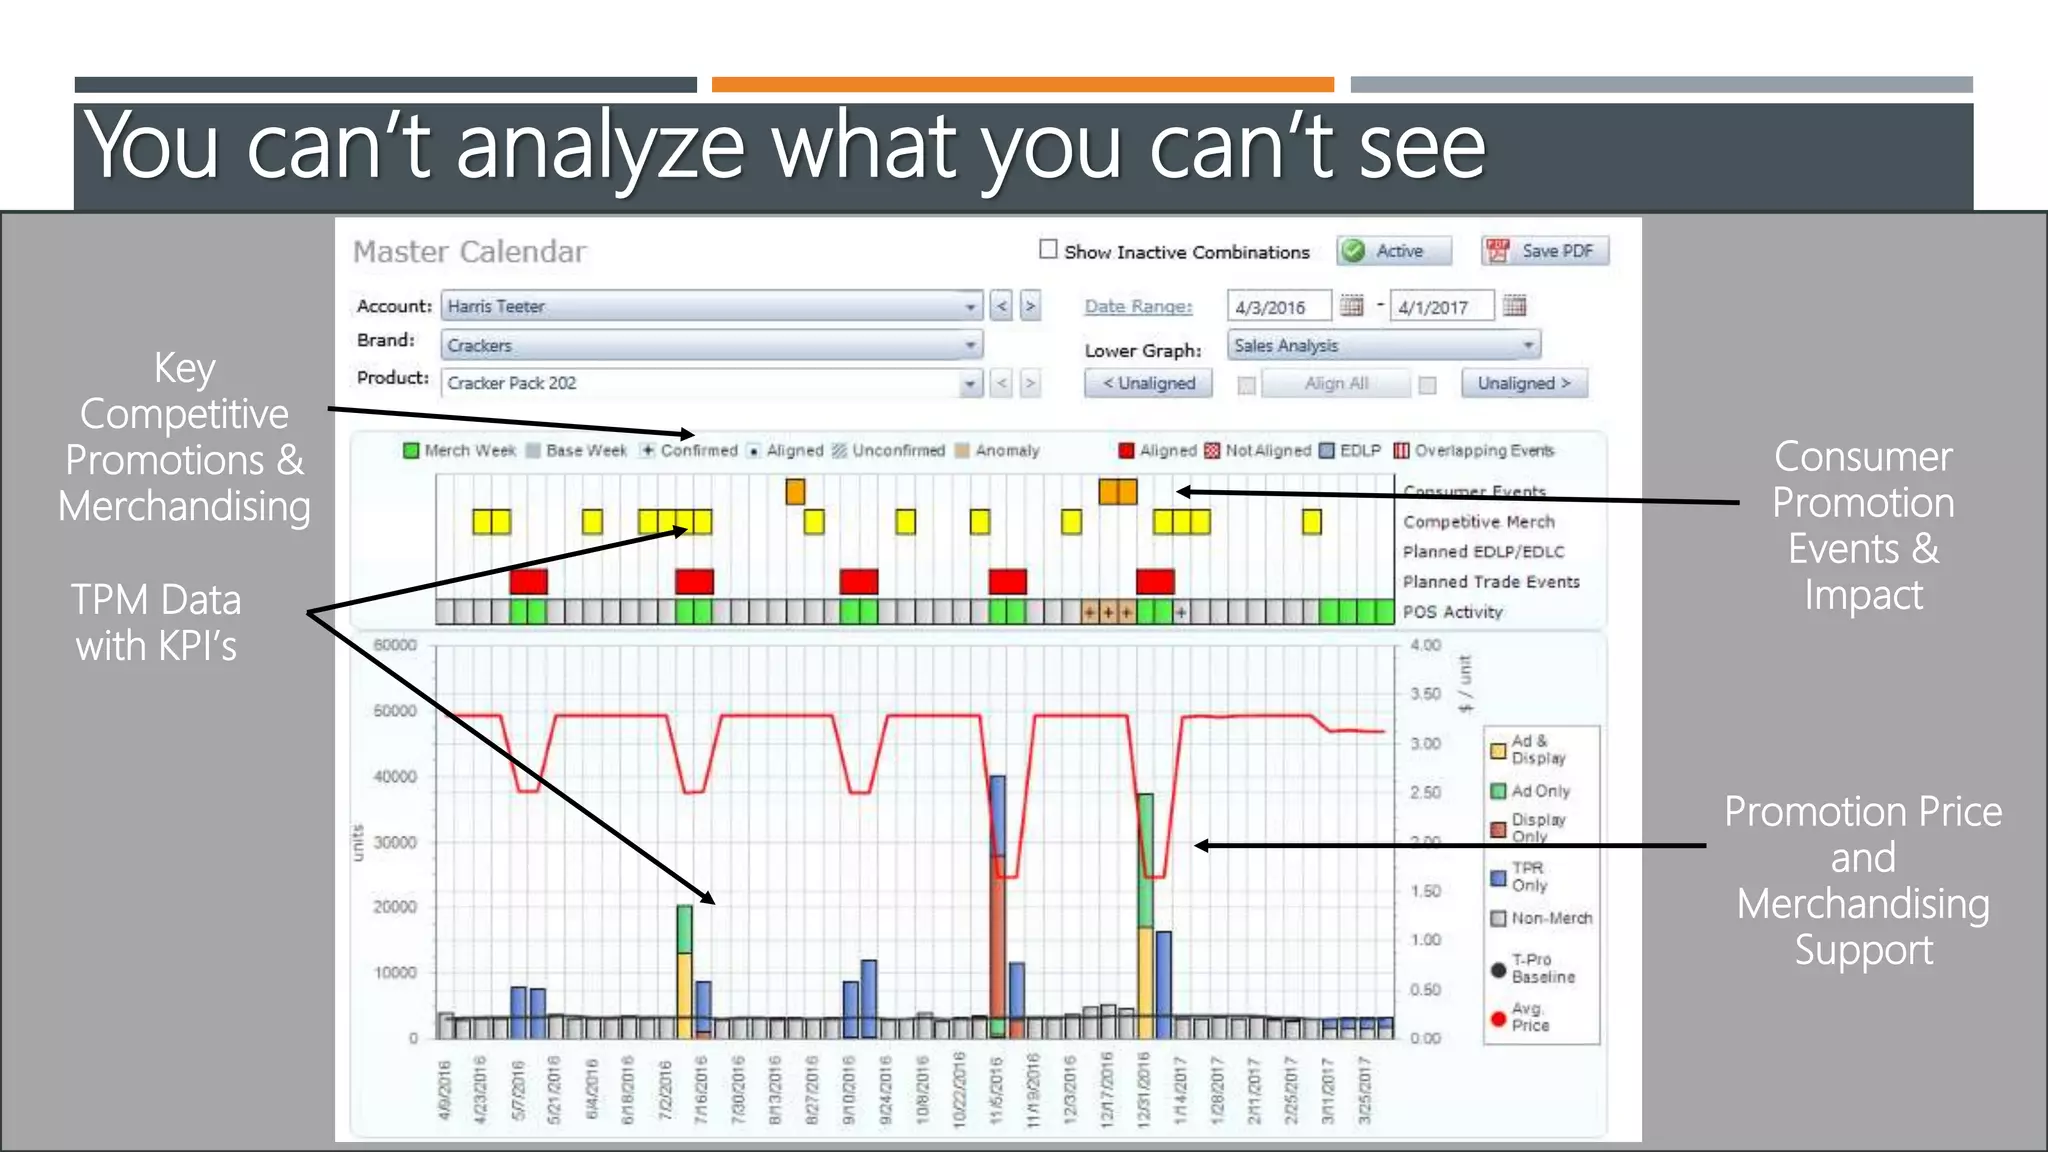
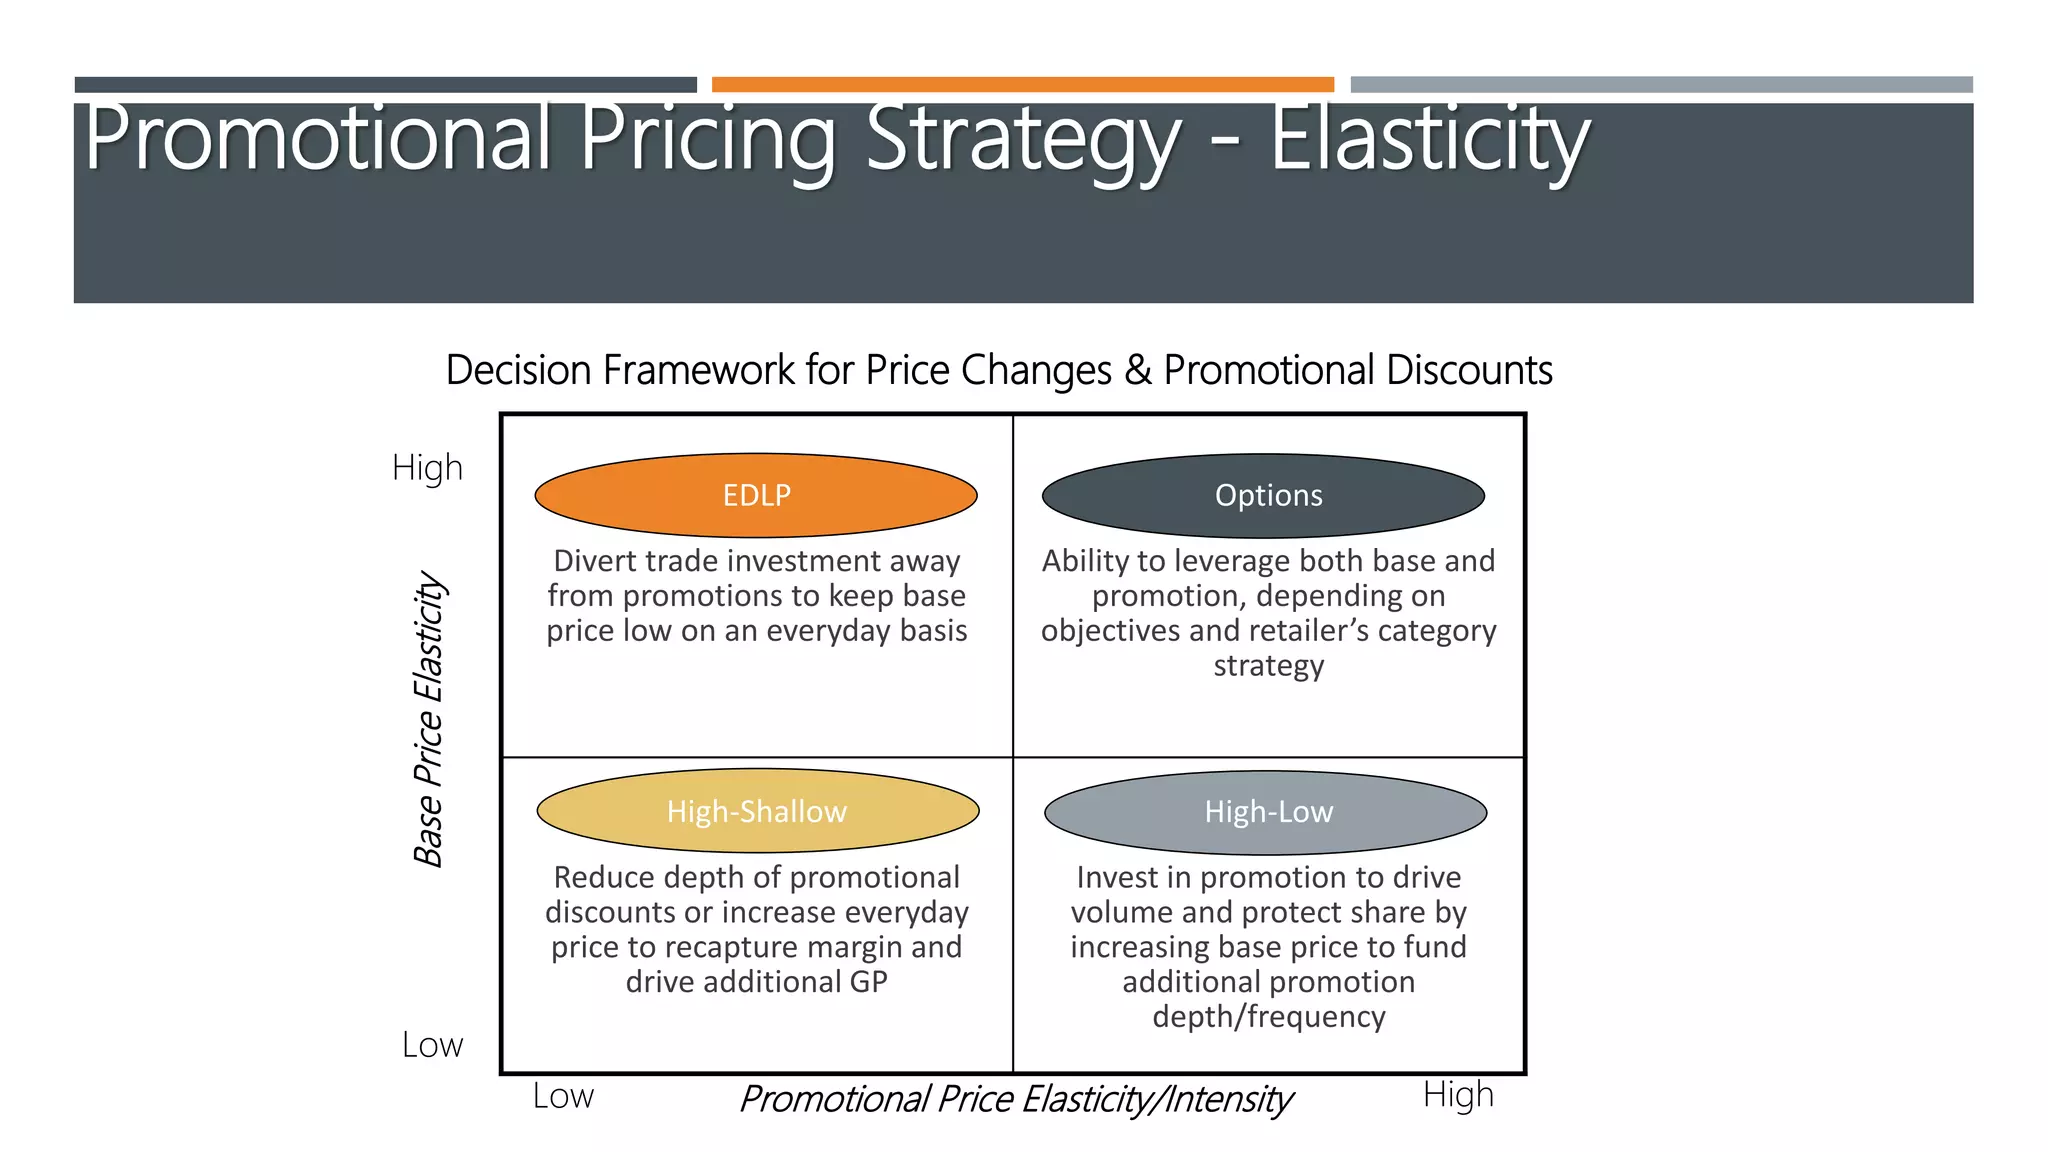
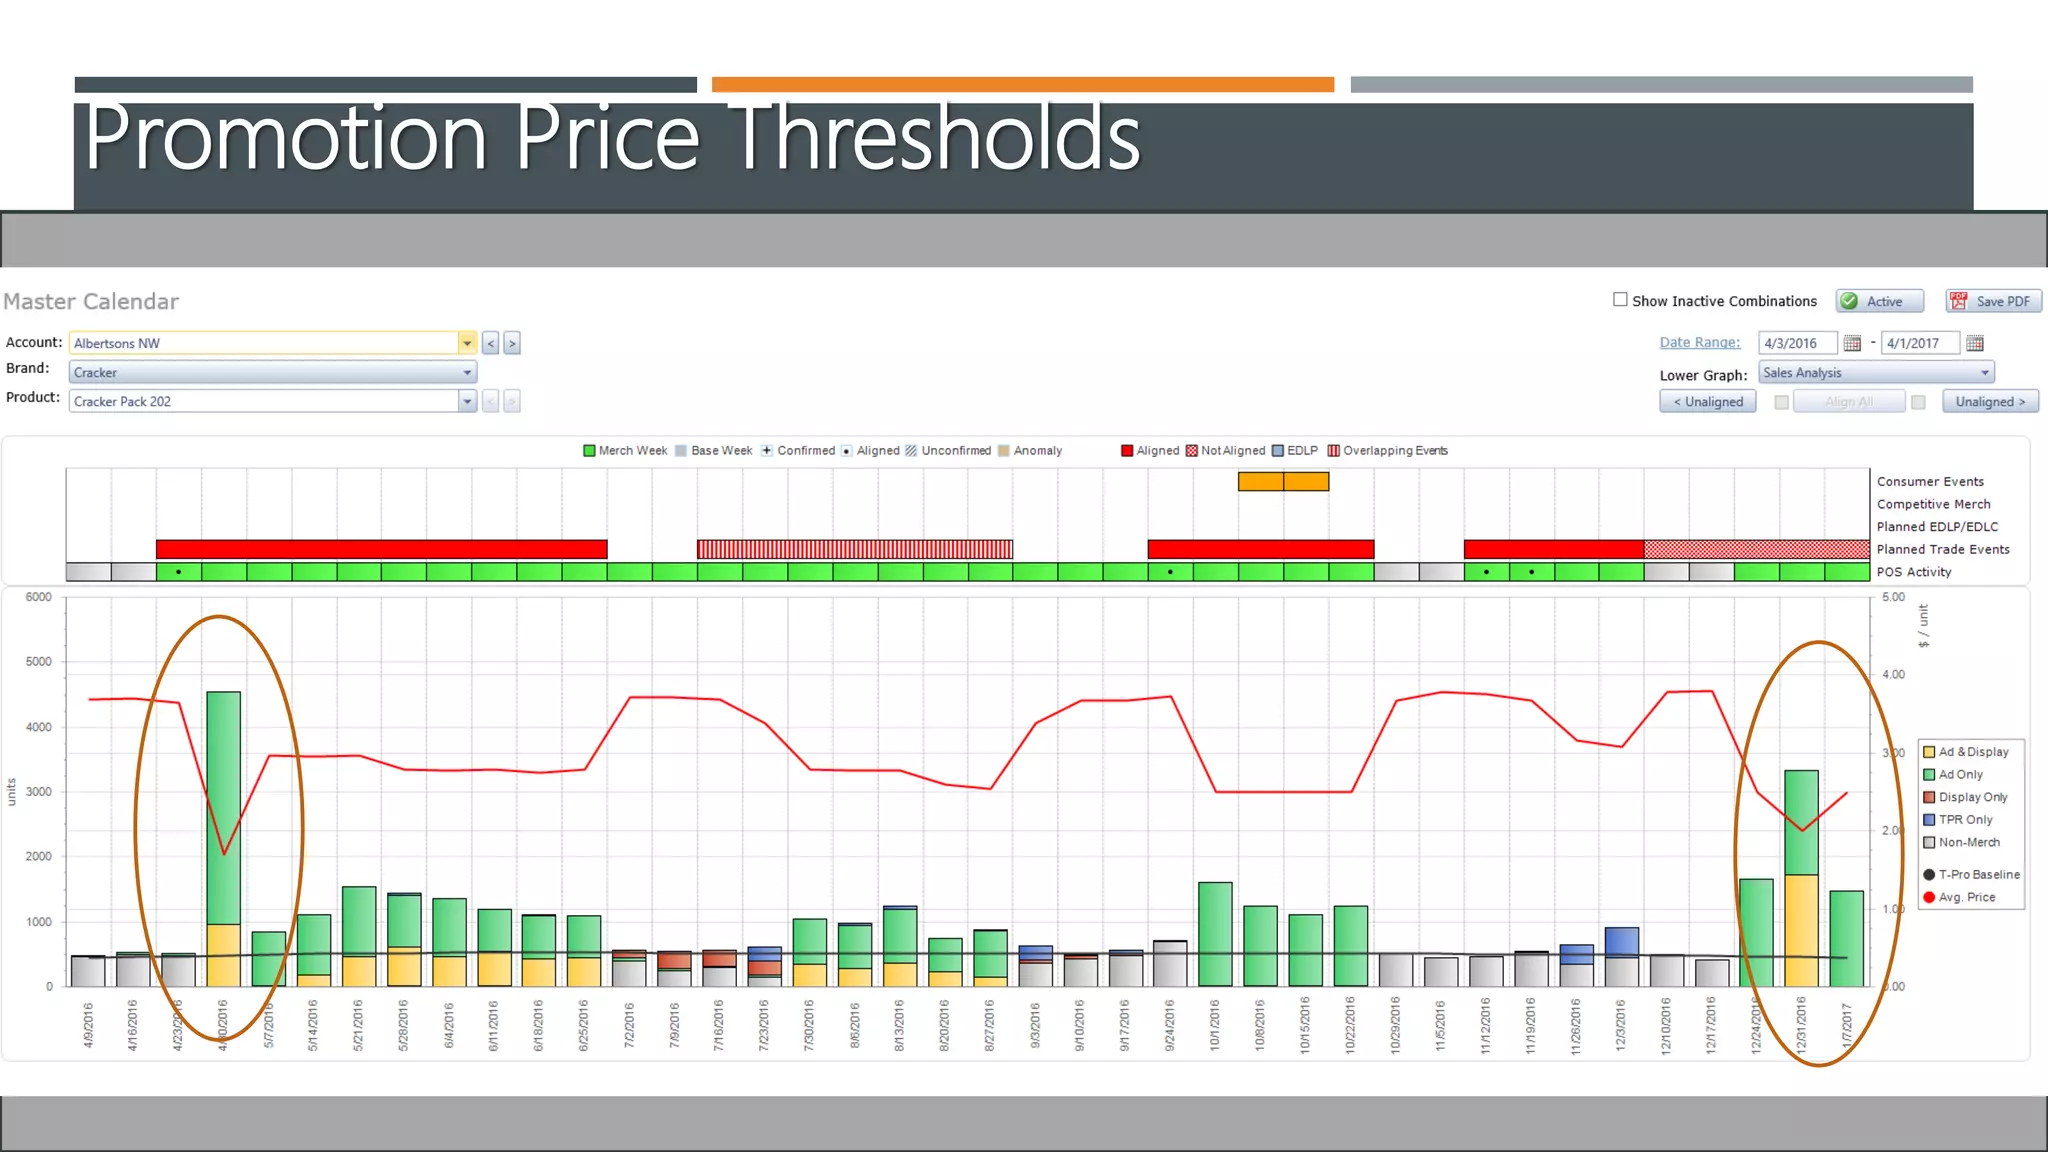
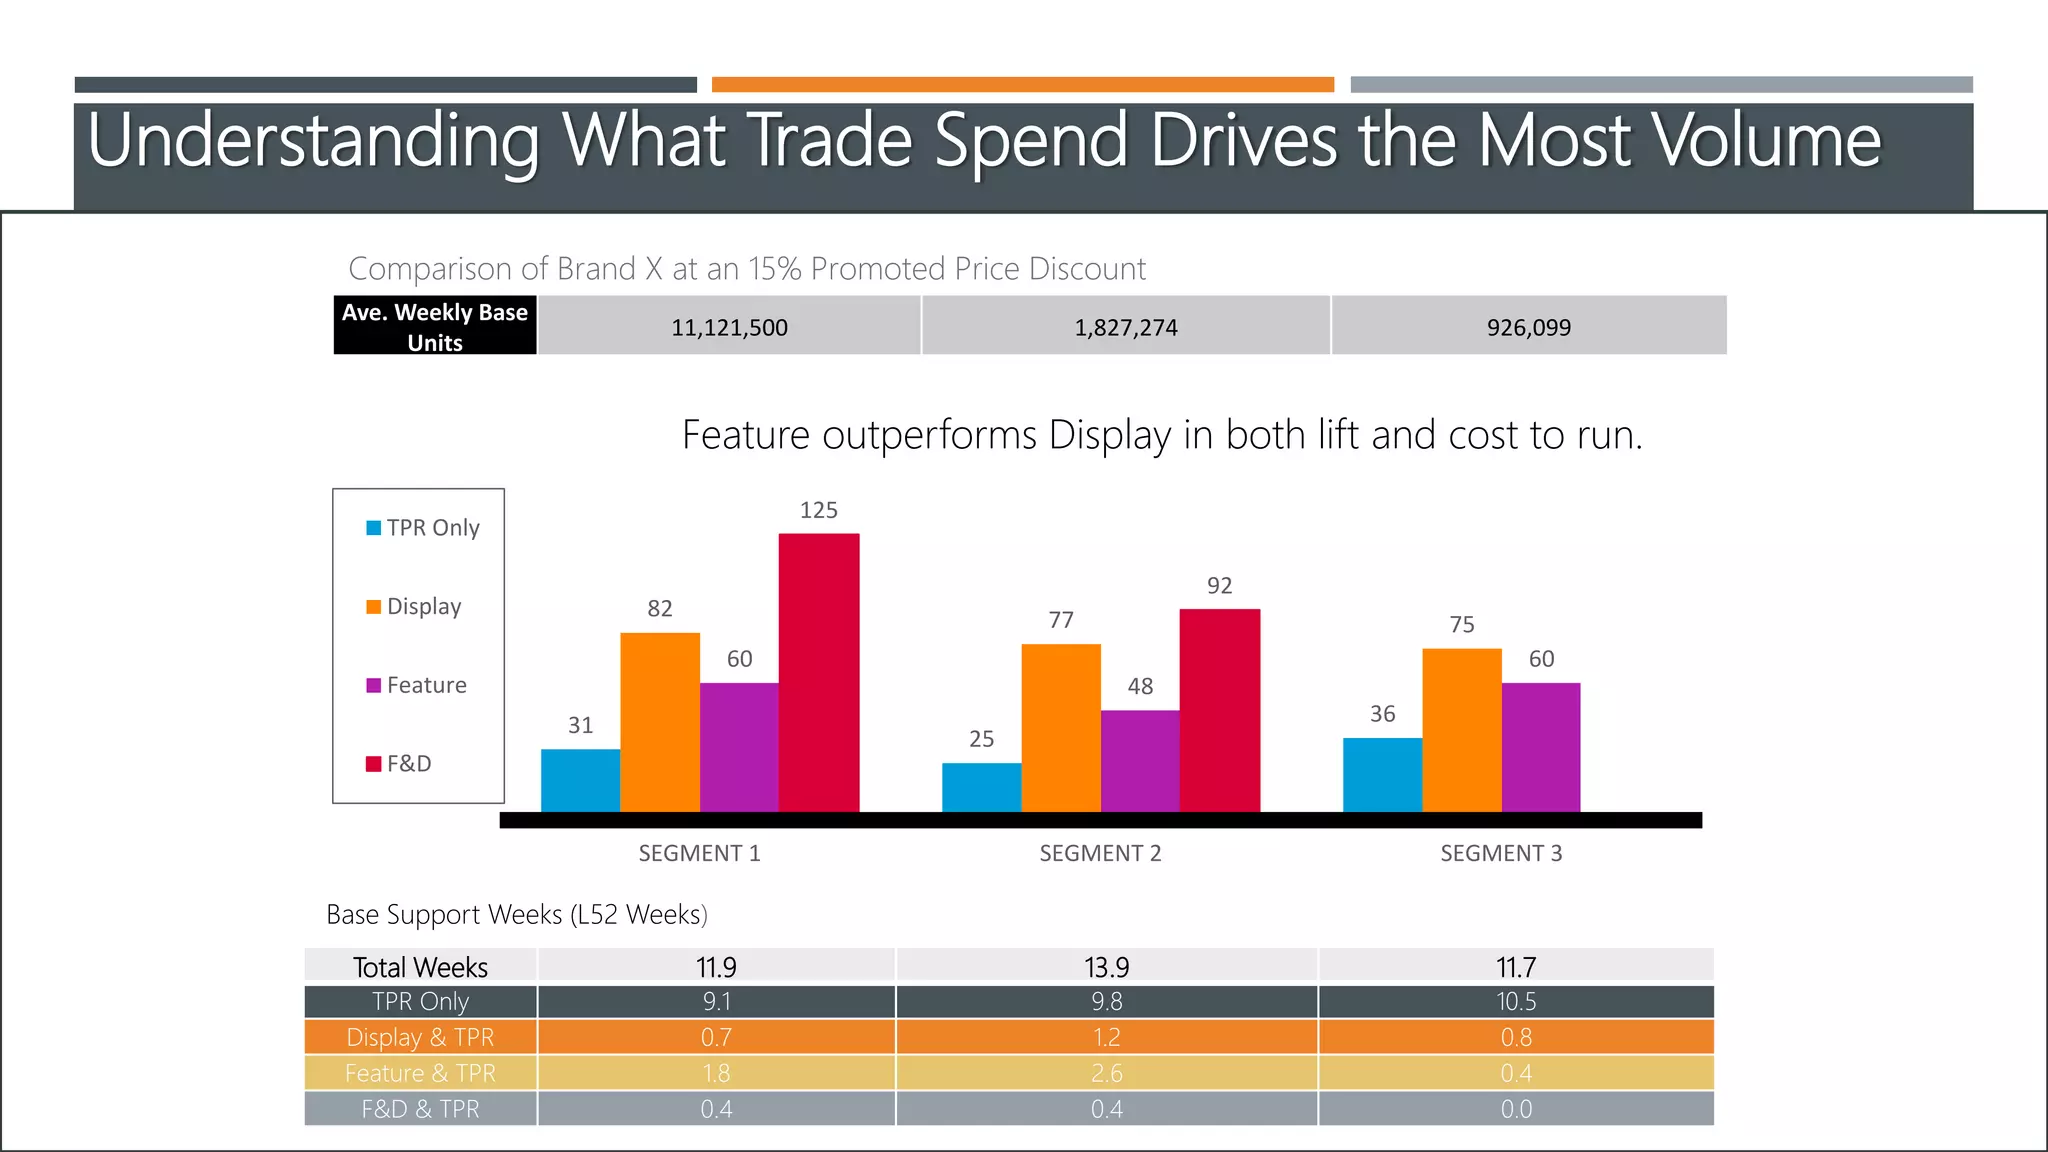
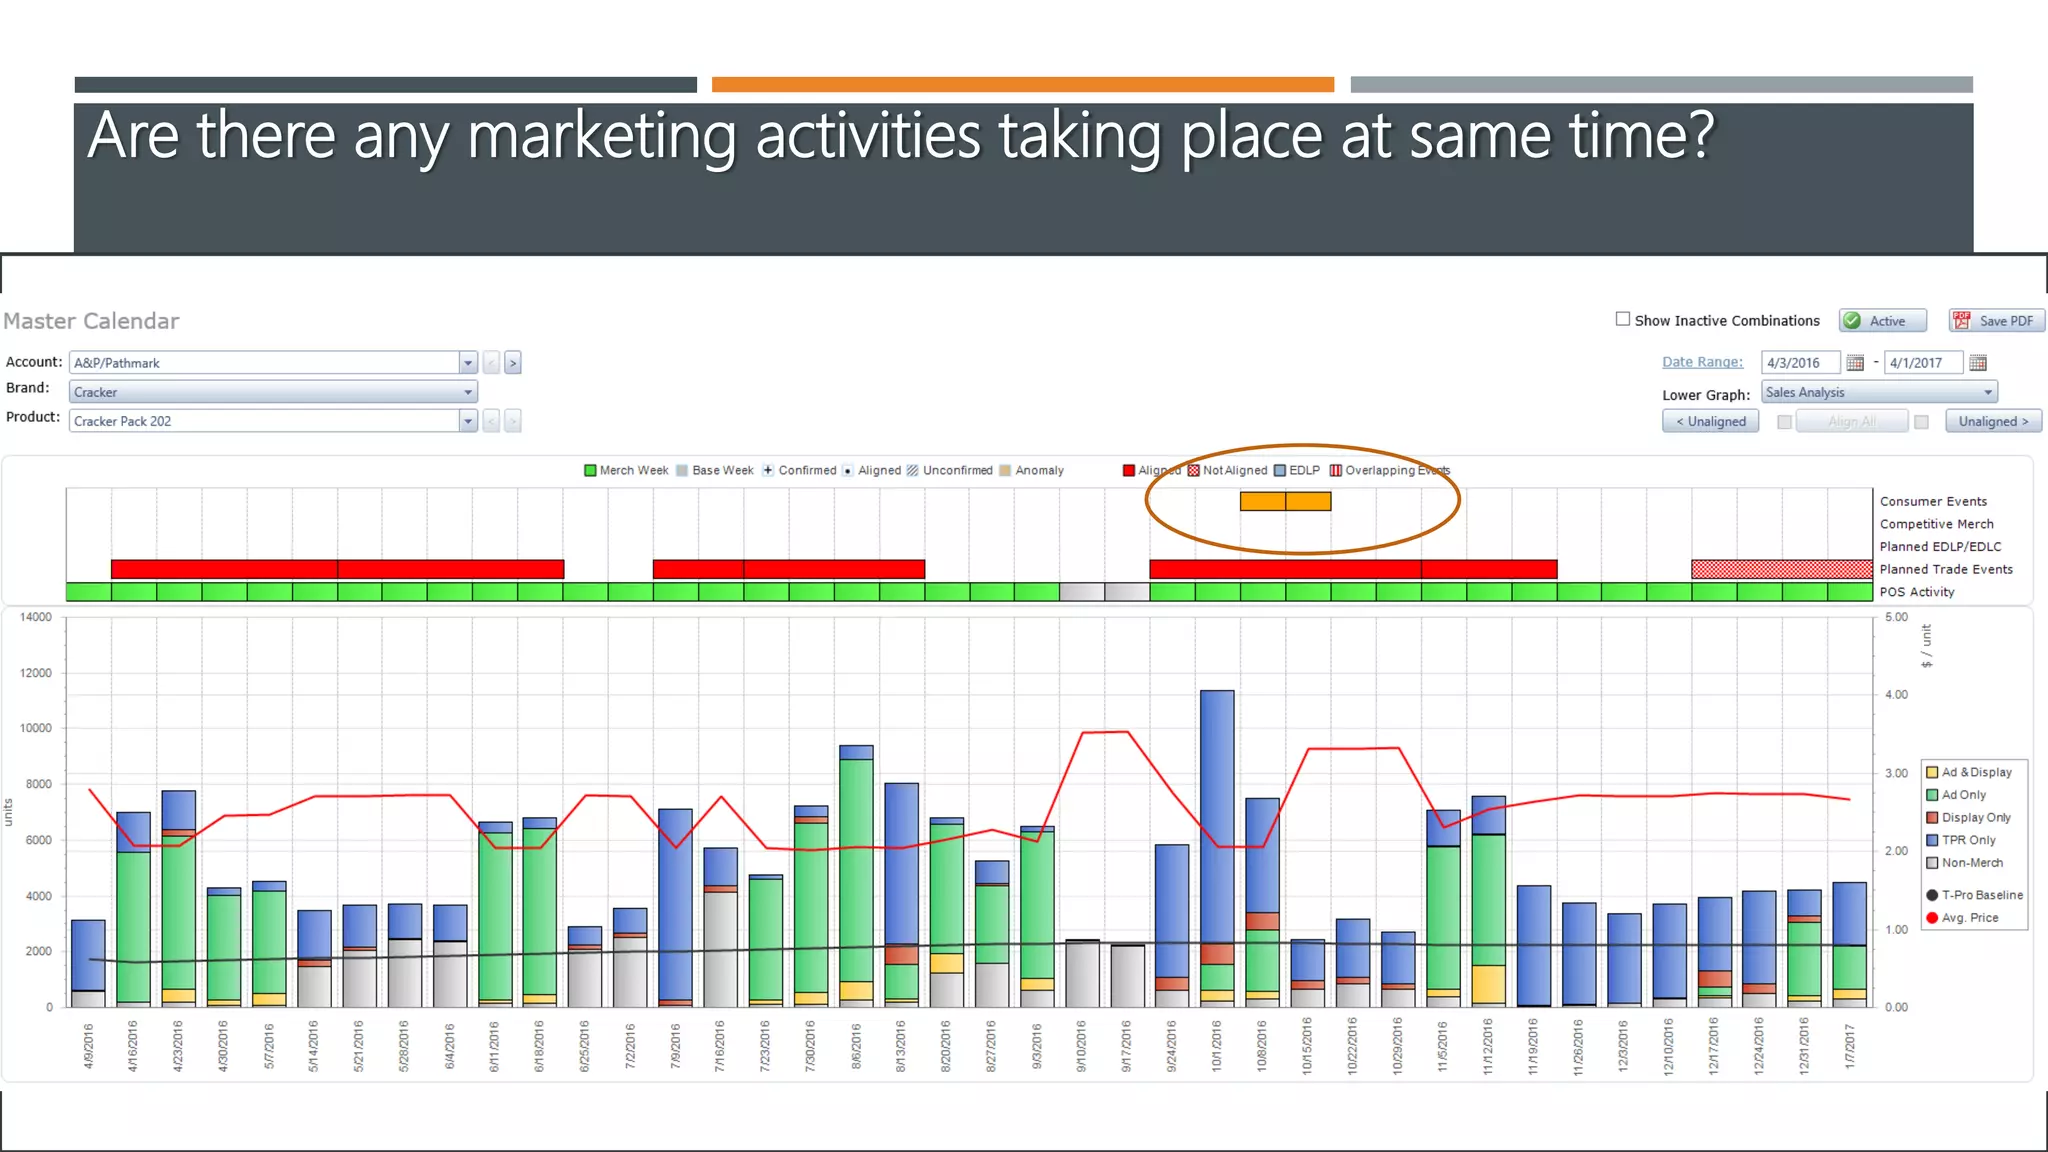
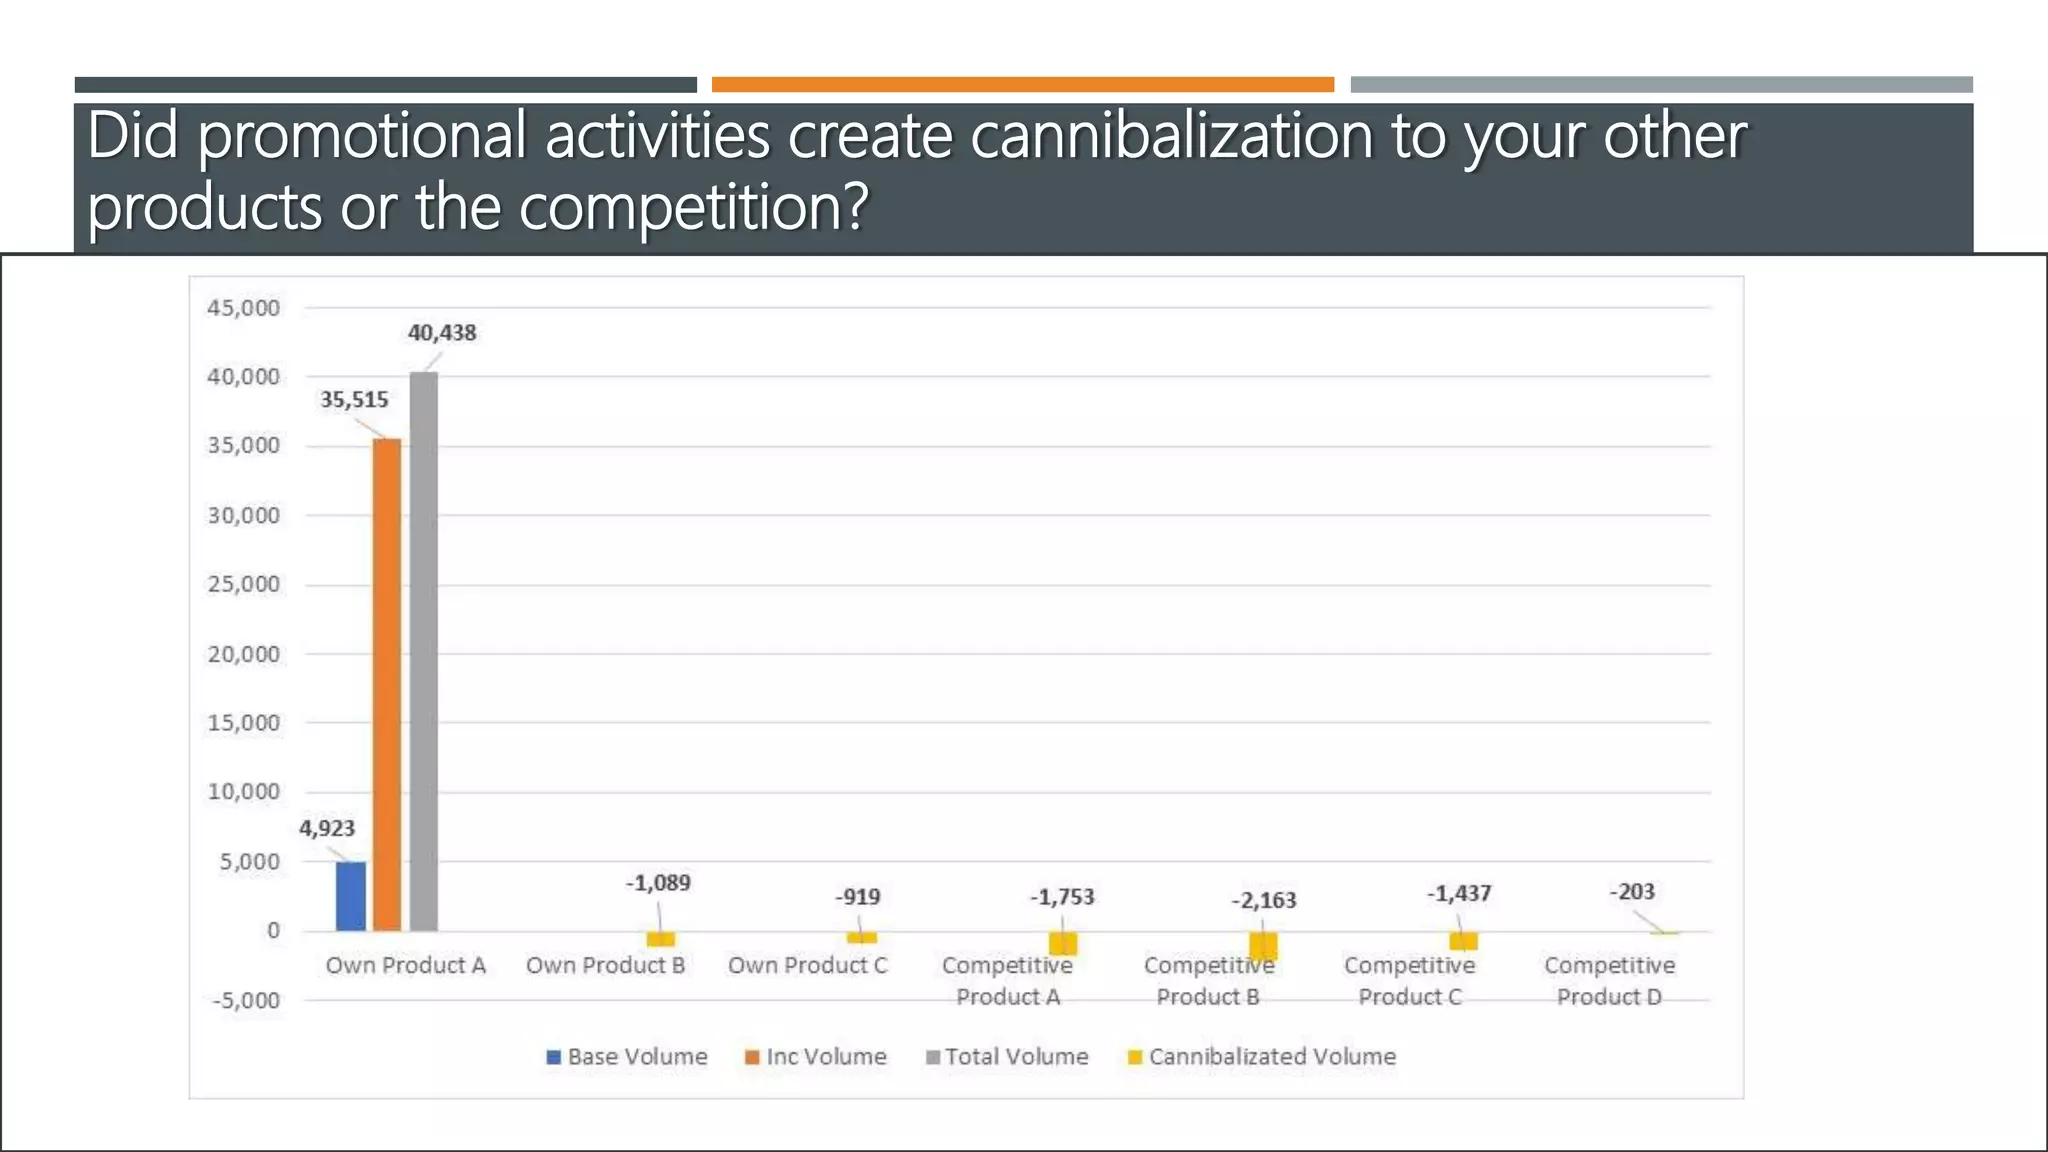
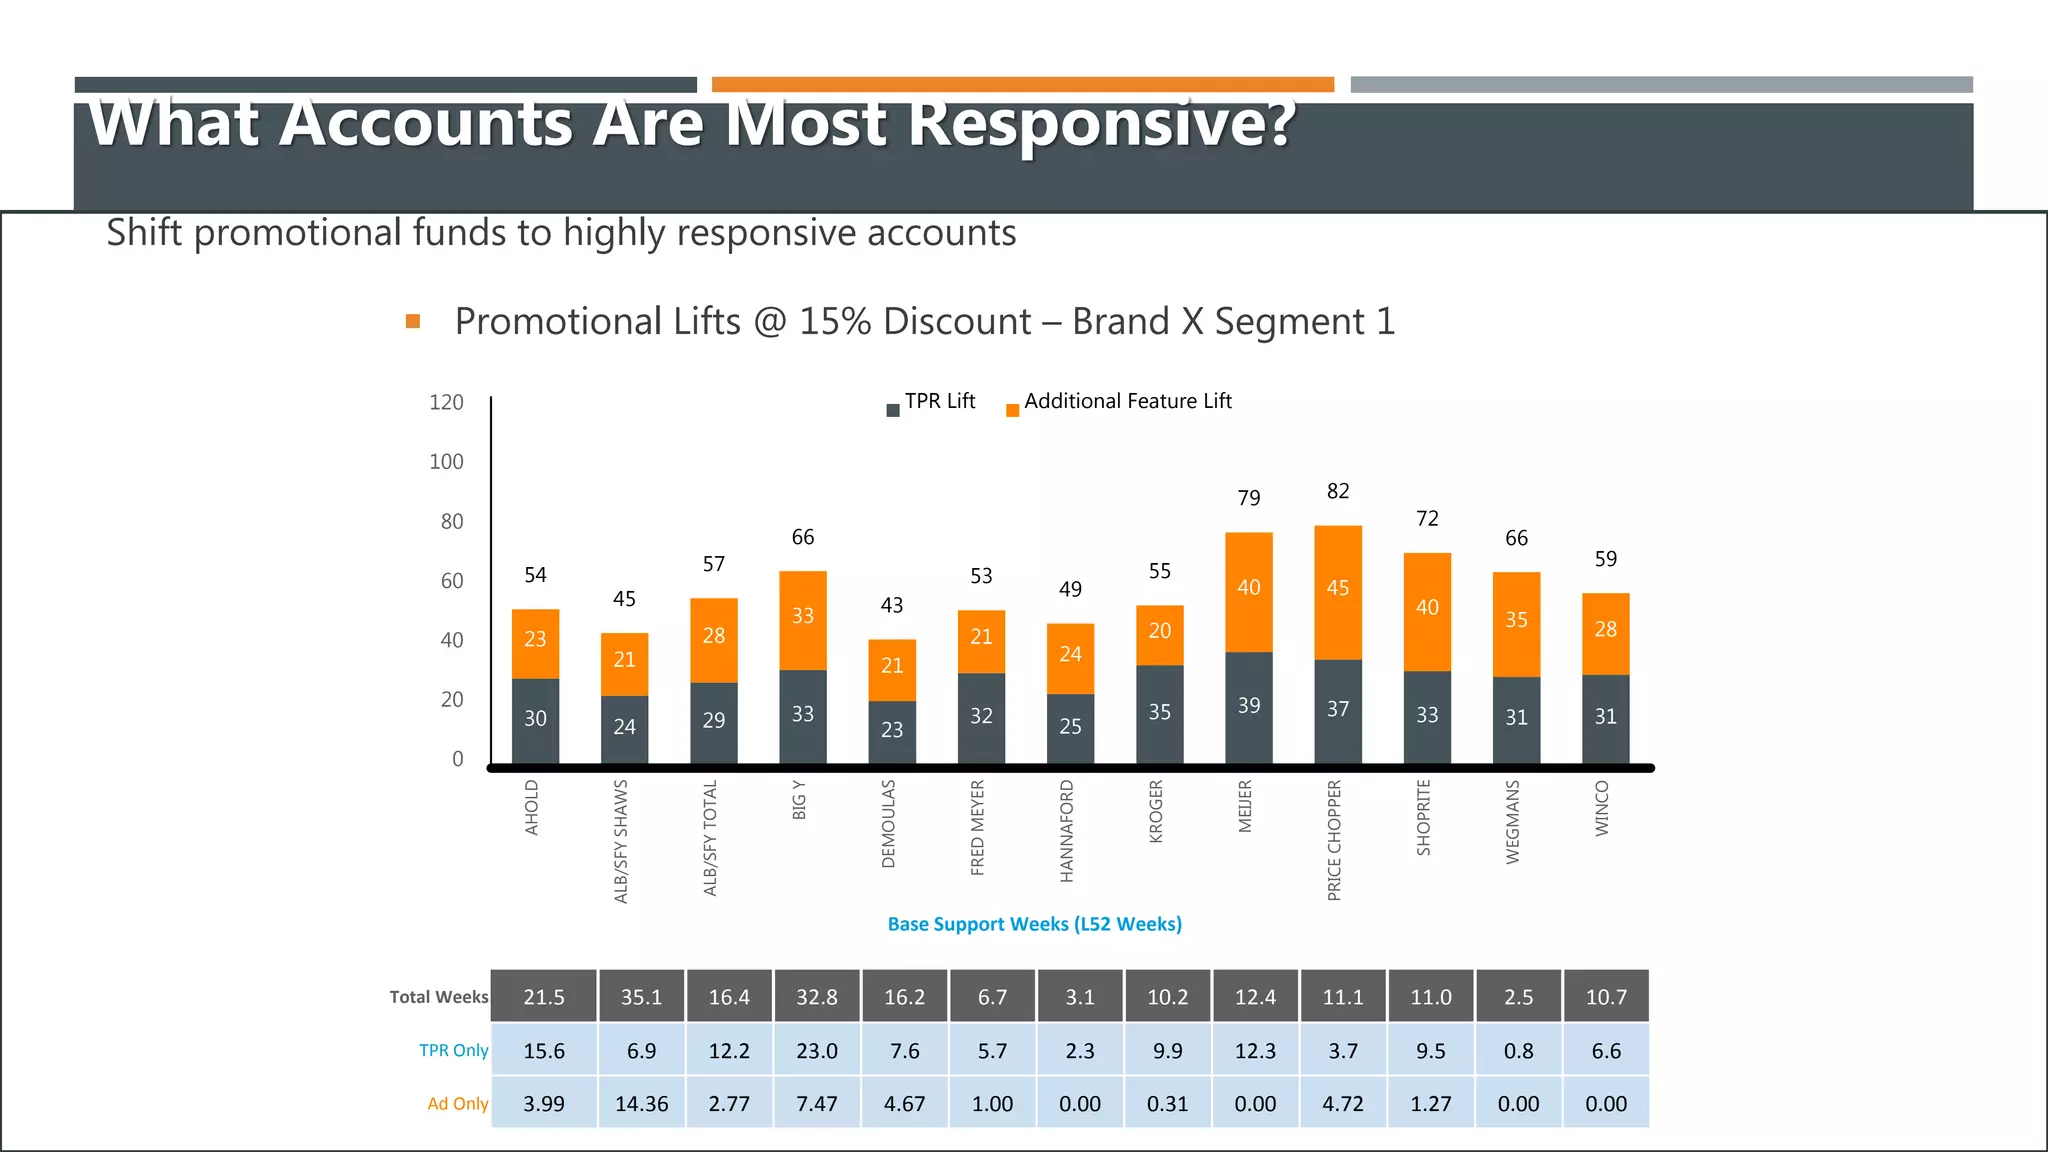
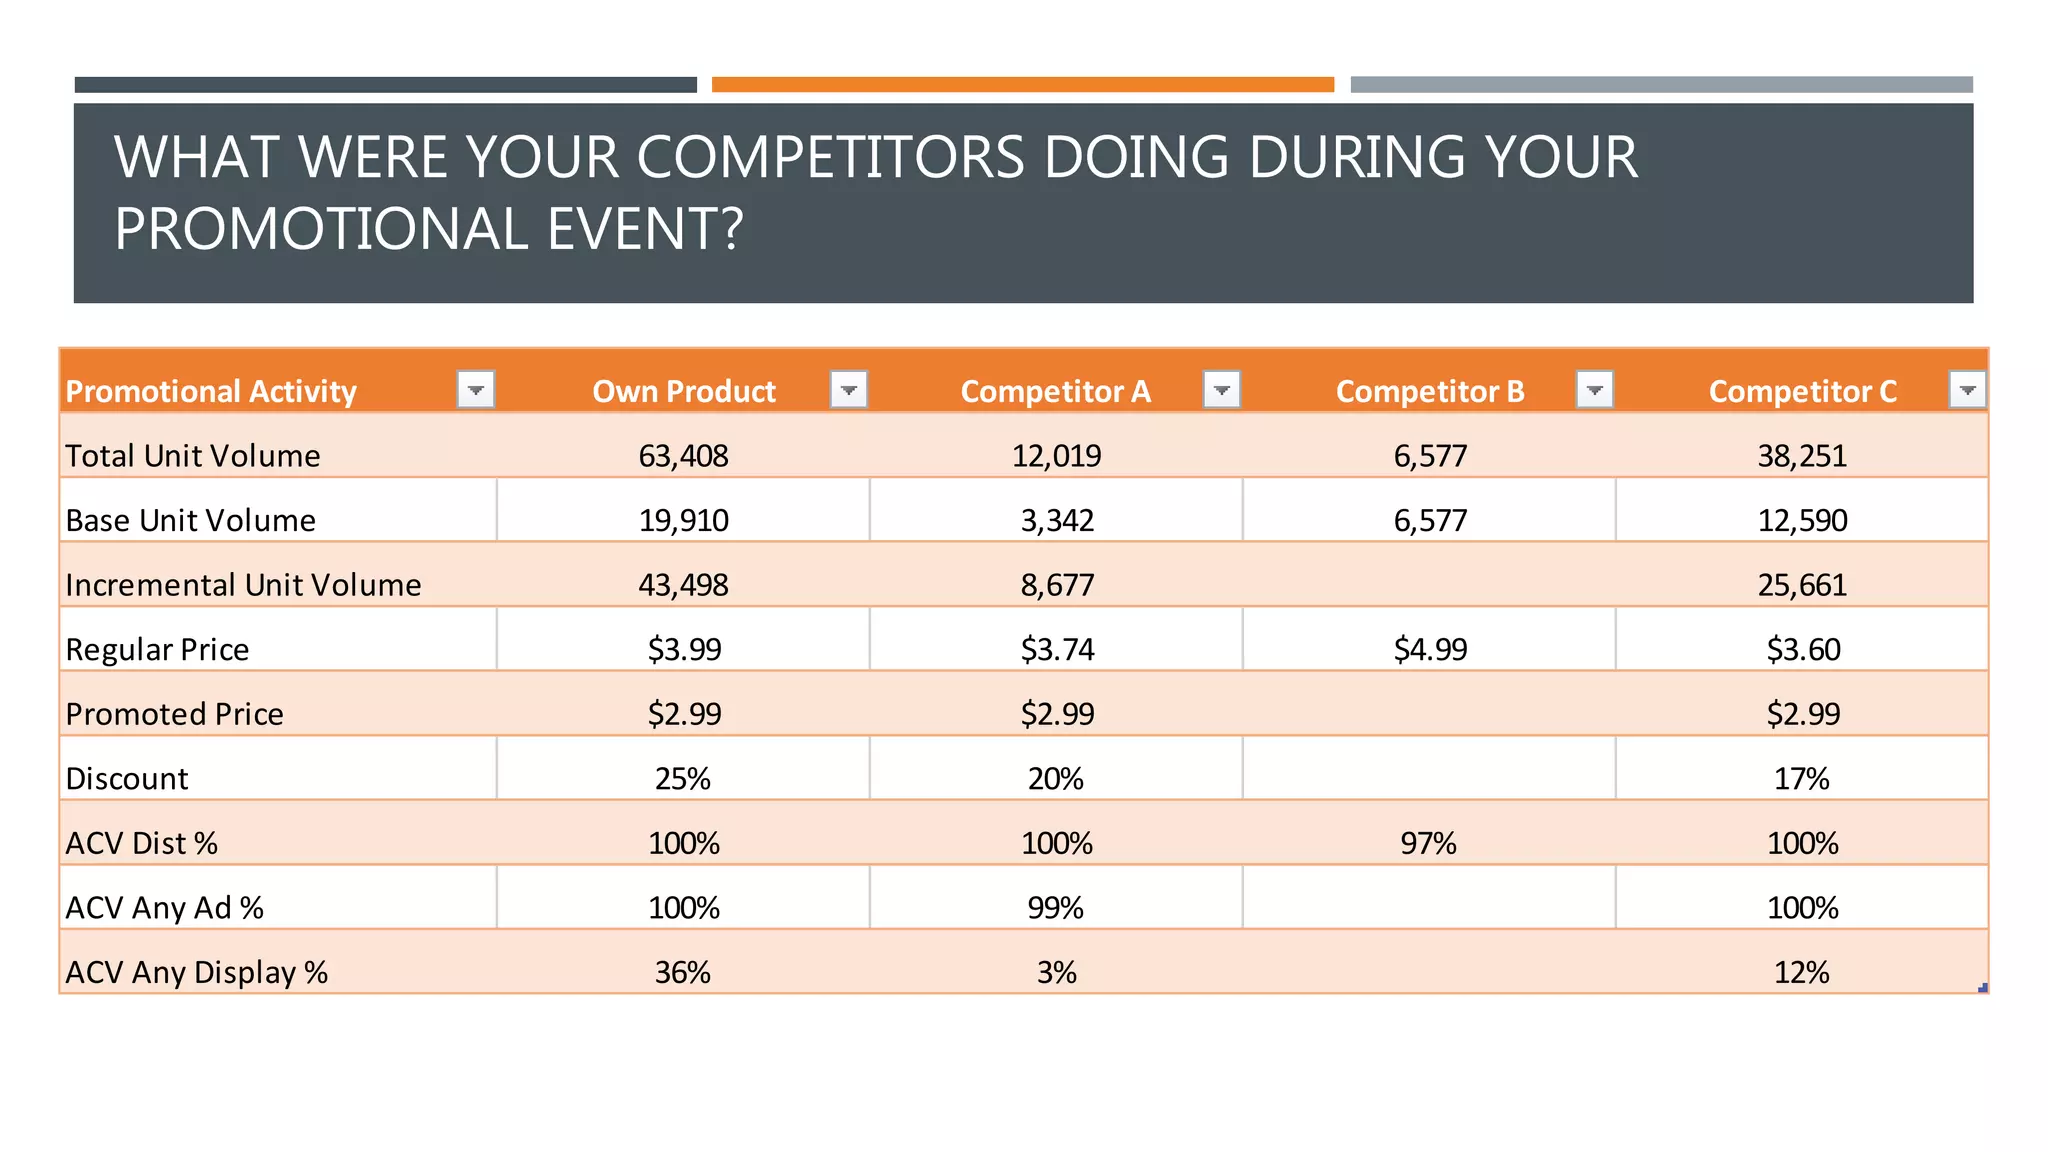
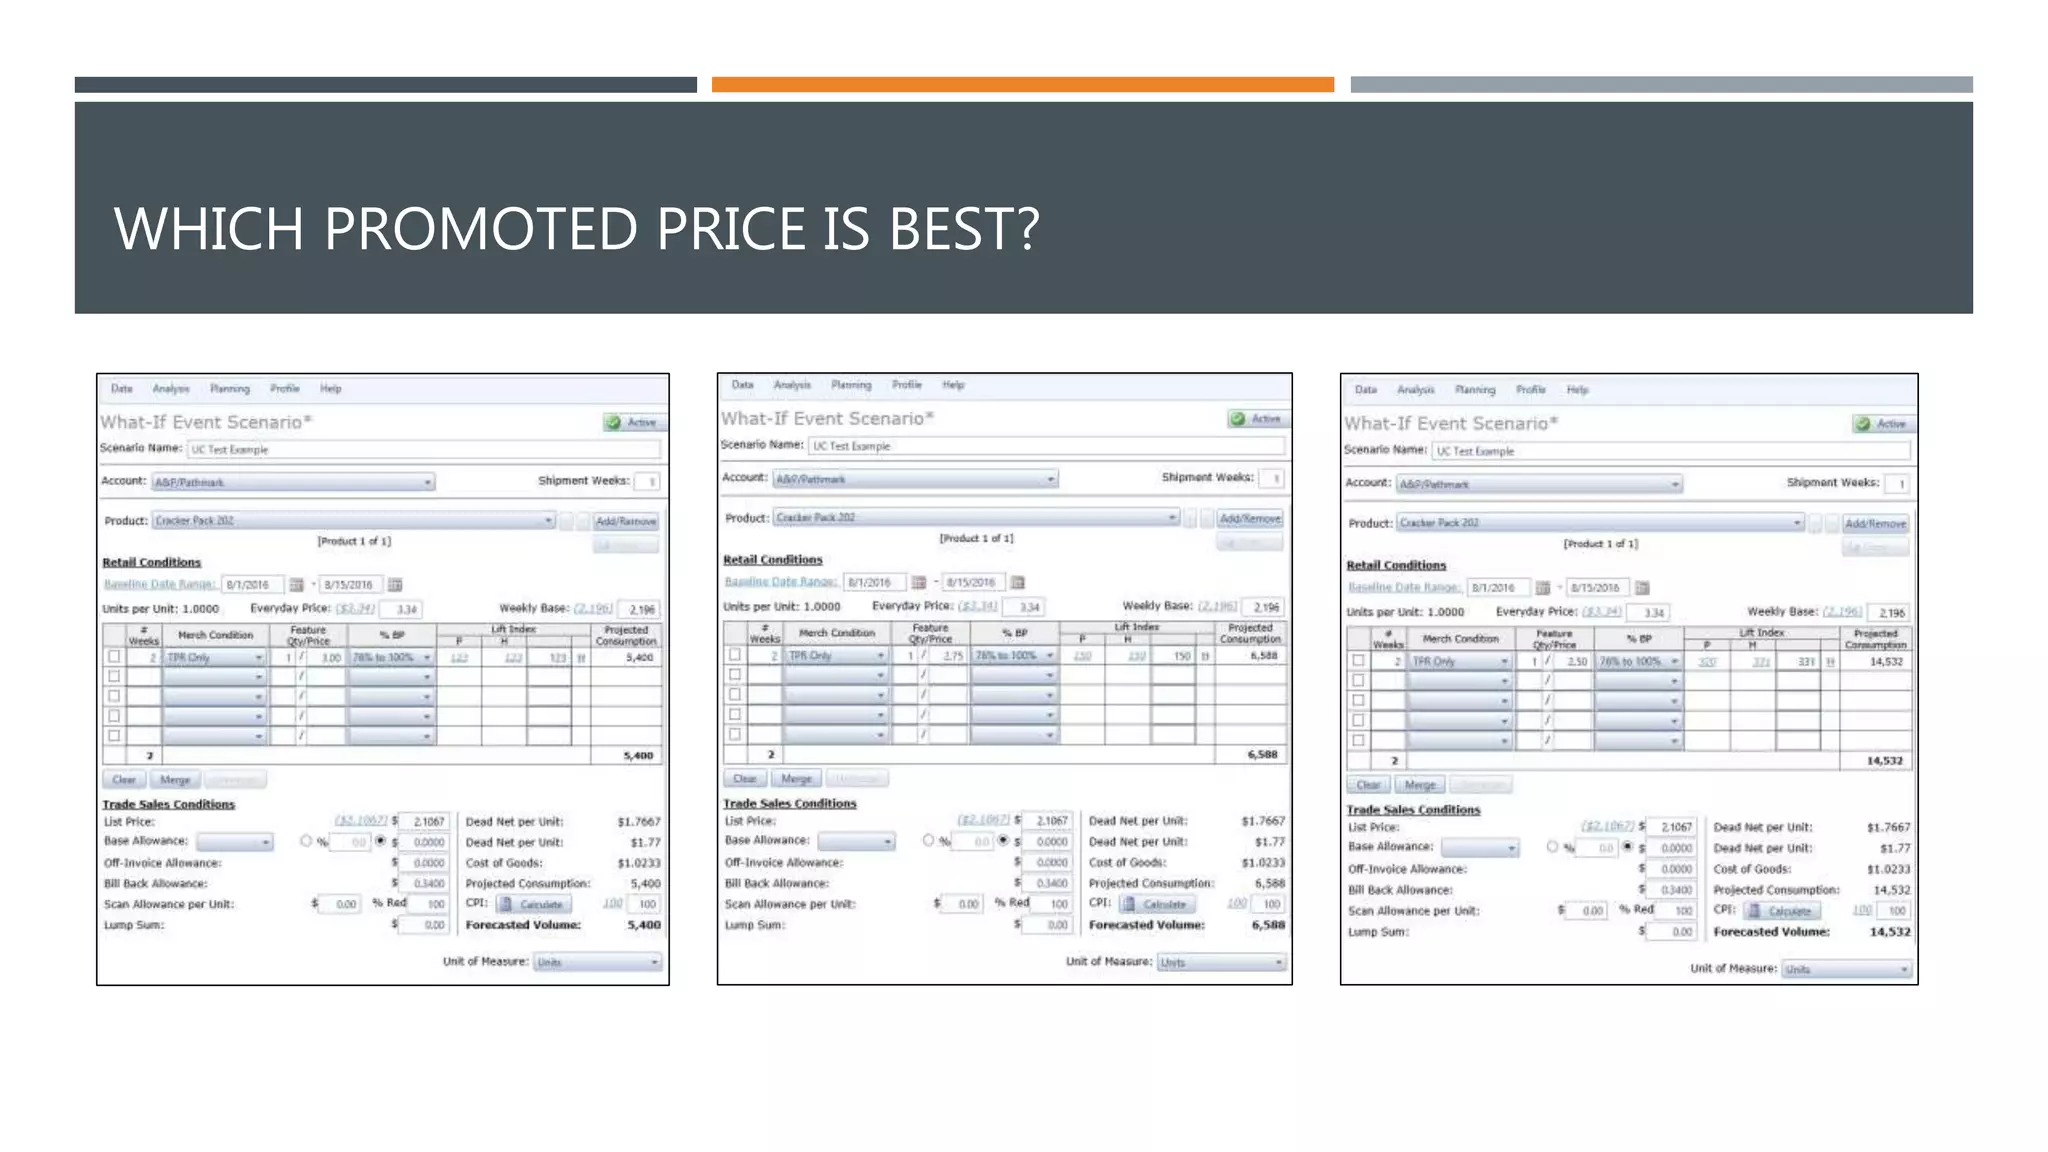
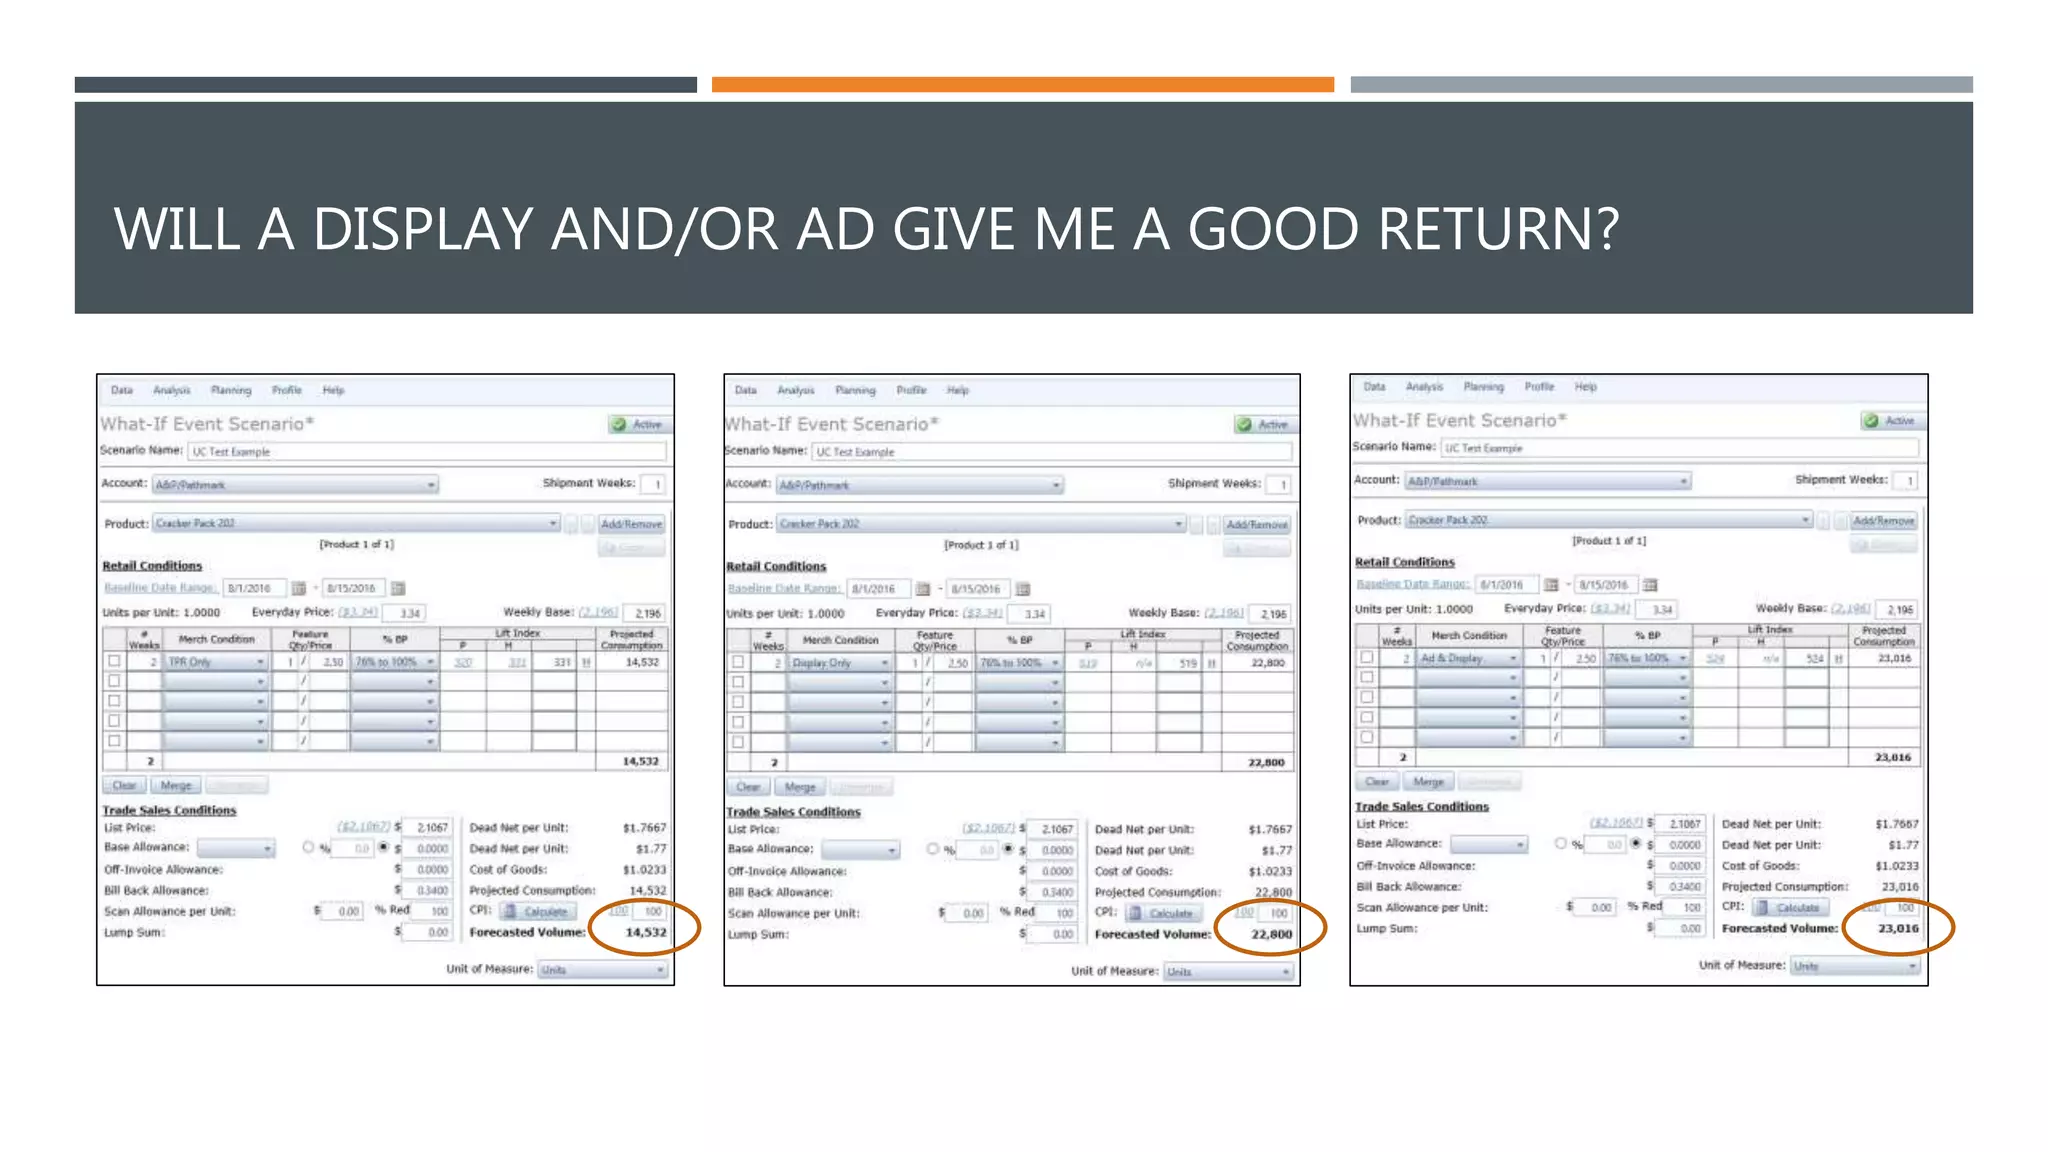
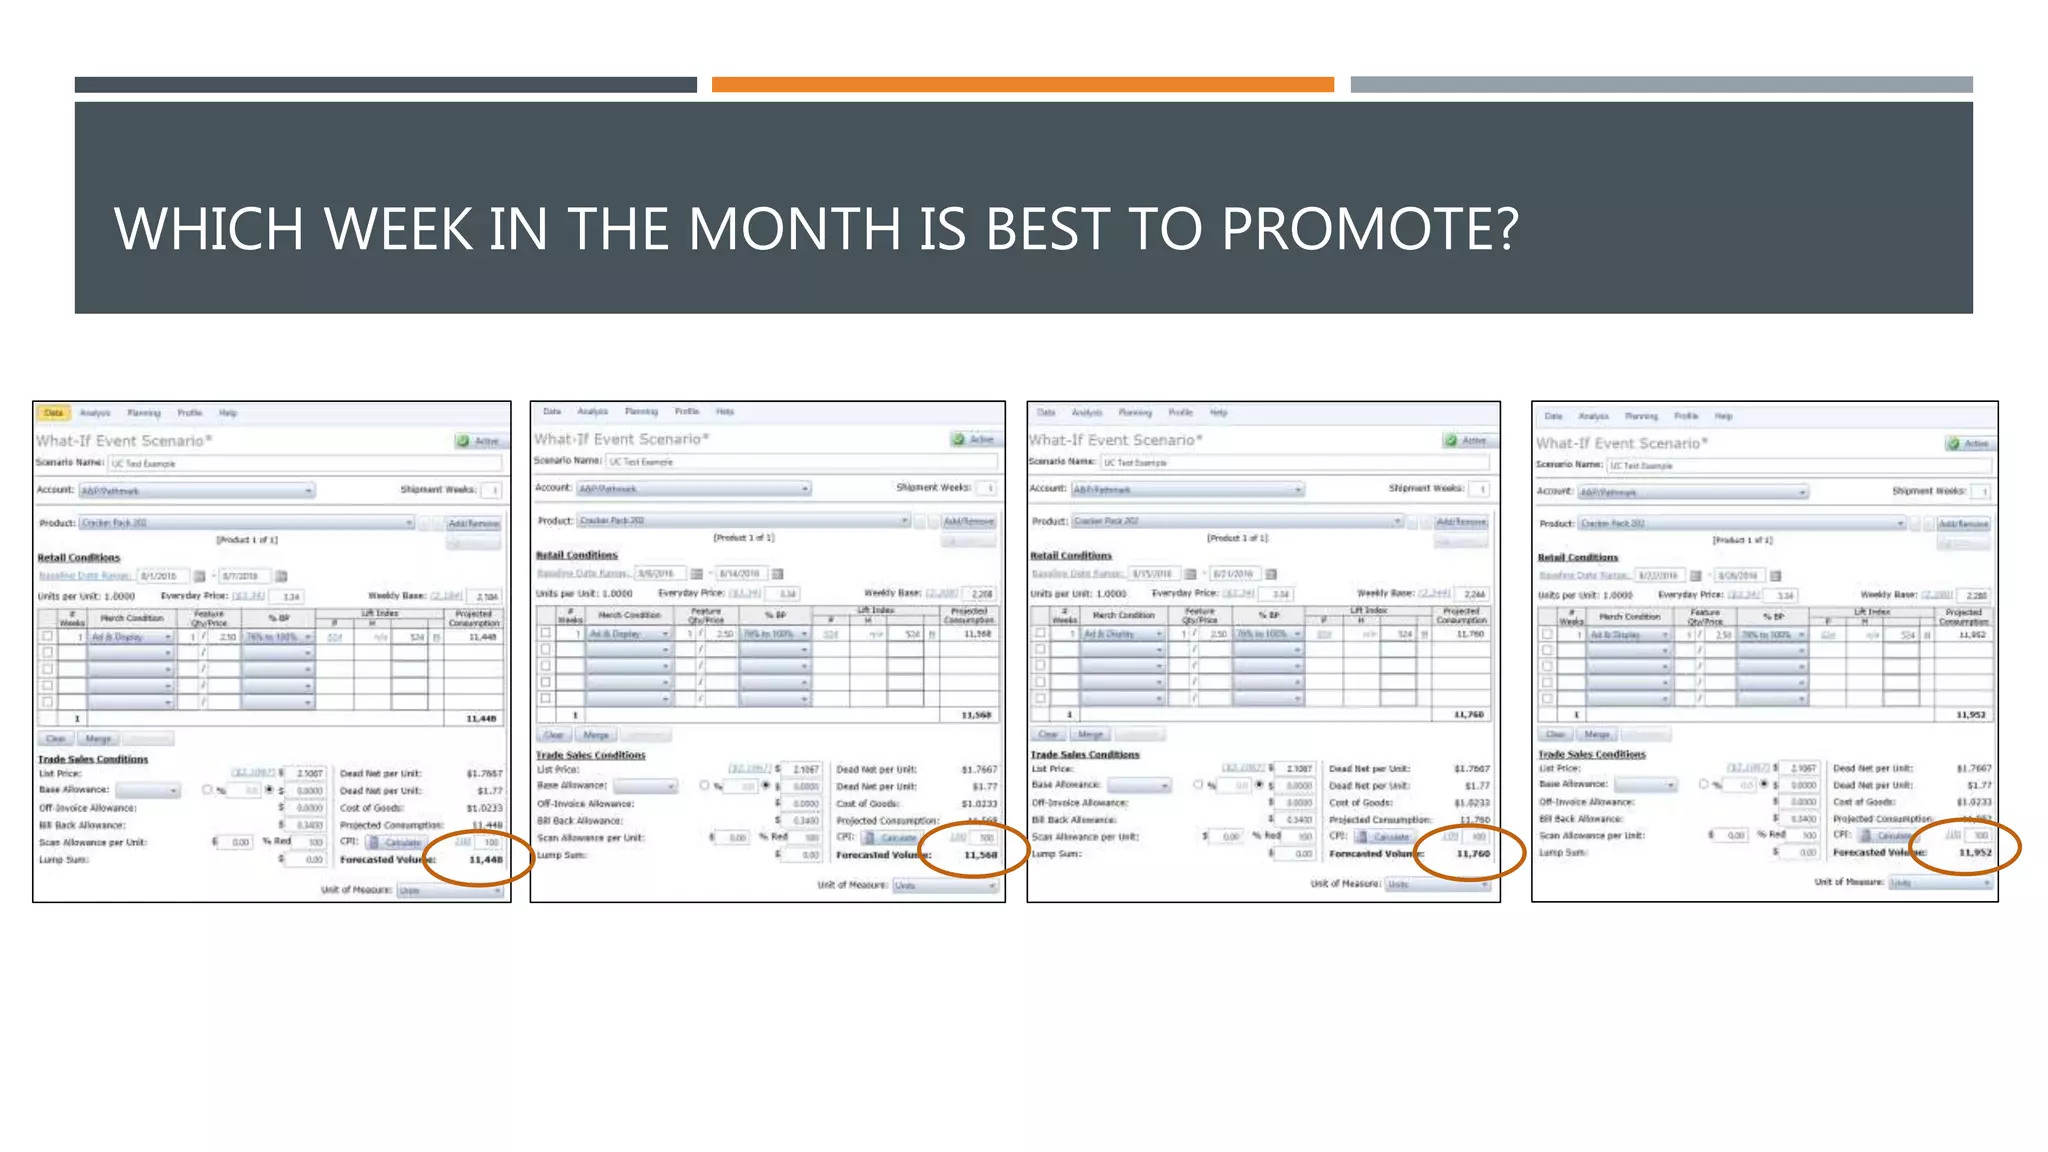
POST-PROMOTION ANALYSIS
AND PROMOTION OPTIMIZATION
SHELLEY FOW
SOLUTION ENGINEER – AFS TPM RETAIL/TPO
• 25+ years experience in consumer packaged goods,
holding positions in brand/product management;
promotional management; and pricing management,
with the last five years of experience on the software
side working with consumer packaged goods
companies on trade promotion management and
optimization/predictive analytics.
• Earned the Certification in Pricing through the
Professional Pricing Society in 2006.
Many companies are tasked with figuring out what they are
getting from their Trade Investment and how to improve it.
We continue to expect old practices
to take us to new places.
Over $200 Billion is spent annually on Trade Investment
representing over 23% of revenue for the average CPG company.
Disparate
Data
Silos
Excel
Spreadsheet
Dependency
Time
Consuming
Processes
Uninformed
Decision
Making
Why? Our business continues to change.
We must change if we want to continue to do business.
Copyright©2015TheNielsenCompany.Confidentialandproprietary.
5
LIVING IN A GROWTH-CHALLENGED ENVIRONMENT
Sources: Nielsen Strategic Planner & Nielsen Convenience Planner, Total U.S. – All Outlets Combined (plus Convenience), 52 W/E 12/25/10 (% change vs. year ago); Nielsen Answers, Total U.S. – All Outlets Combined (plus Convenience), 52
W/E 12/31/11, 12/29/12, 12/28/13, 12/27/14, and YTD 21 W/E 05/23/15 (% change vs. year ago);
US DOLLAR SALES
FLAT OR DECLINING
45% of categories are
representing 40% of total revenue ($’s)
US UNIT SALES
-0.1 -0.2
Copyright©2015TheNielsenCompany.Confidentialandproprietary.
6
TRADITIONAL APPROACHES ARE FALLING SHORT
Source: Nielsen Promotion Benchmark Analysis: 2013 Q1 - 2015 Q4, Nielsen Scantrack: xAOC 2013 vs. 2010
MORE FREQUENT PROMOTIONS,
BUT TRADE EFFICIENCY IS ERODING
ADDING ITEMS TO THE SHELF
ISN’T WORKING
EXISTING ITEMS
($17.4B)
$18.7BNEW ITEMS
$ 1.3BNET GAIN
7
Sales Volume
$
THE RESULT IS INCREASED PRESSURE
AROUND TRADE SPEND
Regular Price
• Own
• Own vs. Competitors
Trade Activity
(Own and
Competitors)
• Features
• Displays
• Price Reductions
$
Seasonality,
Store
Effects,
Others
Quantified Return on Trade
Investment
Harmonization of disparate data silos
(POS, Spend, COGs, Pricing, &
Shipment)
Post-Event Analytics to foster
data-driven decision making
Predictive What-If Scenario
Planning providing both
manufacturer and retailer KPIs
Event and Calendar Optimization
using constraint-based modeling
Trade Promotion Optimization
combines Post-Event Analysis with
Predictive Planning to maximize
the performance and
effectiveness of your trade
strategy.
Integrates with TPM Solution
POST PROMOTIONAL EVENT ANALYSIS – WHAT TO LOOK FOR?
 Base Volume
 Is it stable or has it gone up or down? Why?
 What is regular retail price? Has there been a change in price?
 Promotional Volume/Activities
 Was agreed upon promotional price executed? Do any promotional price thresholds exist?
 Was display activity executed and how well?
 Was feature activity executed and how well?
 Which activity(ies) drove the most volume for the cost associated?
 Are there any marketing activities taking place at same time that could have driven volume?
 Did these promotional activities cause cannibalization to other products in our portfolio?
 Are you promoting in the right accounts?
 What were your competitors doing during your promotional event?
 What have I learned from this analysis for future strategy planning/optimization?
BASE VOLUME – WHAT TO LOOK FOR/CONSIDER
 How are you looking at base volume? Using internal or syndicated data?
 Is it stable or has it gone up or down? Why?
 What is regular retail price? Has there been a change in price?
 When is the last time you analyzed your competition’s base volume and
regular retail price?
It’s starts with Base Volume!
Syndicated baselines models can
overstate baseline volume,
leading understated incremental
Revenue, Profit and ROI’s.
An accurate baseline is crucial to
determine promotional lift and
calculate the ROI and
effectiveness of a promotion.
Syndicated
Baselines
BASE VOLUME VS BASE PRICE
PROMOTIONAL VOLUME/ACTIVITIES – WHAT TO LOOK FOR?
 Was agreed upon promotional price executed? Do any promotional price
thresholds exist?
 Was display activity executed and how well?
 Was feature activity executed and how well?
 Which activity(ies) drove the most volume for the cost associated?
 Are there any marketing activities taking place at same time that could have
driven volume?
 Did these promotional activities cause cannibalization to other products in
our portfolio?
 Are you promoting in the right accounts?
You can’t analyze what you can’t see
TPM Data
with KPI’s
Key
Competitive
Promotions &
Merchandising
Promotion Price
and
Merchandising
Support
Consumer
Promotion
Events &
Impact
Promotional Pricing Strategy - Elasticity
EDLP
Divert trade investment away
from promotions to keep base
price low on an everyday basis
Options
Ability to leverage both base and
promotion, depending on
objectives and retailer’s category
strategy
High-Shallow
Reduce depth of promotional
discounts or increase everyday
price to recapture margin and
drive additional GP
High-Low
Invest in promotion to drive
volume and protect share by
increasing base price to fund
additional promotion
depth/frequency
Decision Framework for Price Changes & Promotional Discounts
Low HighPromotional Price Elasticity/Intensity
Low
High
BasePriceElasticity
Promotion Price Thresholds
Understanding What Trade Spend Drives the Most Volume
31
25
36
82 77 75
60
48
60
125
92
SEGMENT 1 SEGMENT 2 SEGMENT 3
TPR Only
Display
Feature
F&D
Total Weeks 11.9 13.9 11.7
TPR Only 9.1 9.8 10.5
Display & TPR 0.7 1.2 0.8
Feature & TPR 1.8 2.6 0.4
F&D & TPR 0.4 0.4 0.0
Ave. Weekly Base
Units
11,121,500 1,827,274 926,099
Base Support Weeks (L52 Weeks)
Comparison of Brand X at an 15% Promoted Price Discount
Feature outperforms Display in both lift and cost to run.
Are there any marketing activities taking place at same time?
Did promotional activities create cannibalization to your other
products or the competition?
What Accounts Are Most Responsive?
30 24 29 33
23
32 25
35 39 37 33 31 31
23
21
28
33
21
21
24
20
40 45
40
35 28
54
45
57
66
43
53
49
55
79 82
72
66
59
0
20
40
60
80
100
120
AHOLD
ALB/SFYSHAWS
ALB/SFYTOTAL
BIGY
DEMOULAS
FREDMEYER
HANNAFORD
KROGER
MEIJER
PRICECHOPPER
SHOPRITE
WEGMANS
WINCO
TPR Lift Additional Feature Lift
 Promotional Lifts @ 15% Discount – Brand X Segment 1
Total Weeks 21.5 35.1 16.4 32.8 16.2 6.7 3.1 10.2 12.4 11.1 11.0 2.5 10.7
TPR Only 15.6 6.9 12.2 23.0 7.6 5.7 2.3 9.9 12.3 3.7 9.5 0.8 6.6
Ad Only 3.99 14.36 2.77 7.47 4.67 1.00 0.00 0.31 0.00 4.72 1.27 0.00 0.00
Base Support Weeks (L52 Weeks)
Shift promotional funds to highly responsive accounts
WHAT WERE YOUR COMPETITORS DOING DURING YOUR
PROMOTIONAL EVENT?
Promotional Activity Own Product Competitor A Competitor B Competitor C
Total Unit Volume 63,408 12,019 6,577 38,251
Base Unit Volume 19,910 3,342 6,577 12,590
Incremental Unit Volume 43,498 8,677 25,661
Regular Price $3.99 $3.74 $4.99 $3.60
Promoted Price $2.99 $2.99 $2.99
Discount 25% 20% 17%
ACV Dist % 100% 100% 97% 100%
ACV Any Ad % 100% 99% 100%
ACV Any Display % 36% 3% 12%
INSIGHTS INTO THE COMPETITION
FUTURE STRATEGY PLANNING/OPTIMIZATION OF PROMOTIONS
 What is the most effective promoted price point?
 Is the money I am spending for display activity worth the investment and
being executed?
 How much volume is the money I spend on an ad driving?
 Which week is the best week to promote during the month?
WHICH PROMOTED PRICE IS BEST?
WILL A DISPLAY AND/OR AD GIVE ME A GOOD RETURN?
WHICH WEEK IN THE MONTH IS BEST TO PROMOTE?
Taking the steps we just discussed will ensure that
your organization is slowly, but surely working
towards better understanding and optimizing your
trade spend dollars to ensure maximum profitability
and ROI.
THANK YOU!
Q&A

Post Event Analysis with POS Data Discovery

  • 1.
  • 2.
    SHELLEY FOW SOLUTION ENGINEER– AFS TPM RETAIL/TPO • 25+ years experience in consumer packaged goods, holding positions in brand/product management; promotional management; and pricing management, with the last five years of experience on the software side working with consumer packaged goods companies on trade promotion management and optimization/predictive analytics. • Earned the Certification in Pricing through the Professional Pricing Society in 2006.
  • 3.
    Many companies aretasked with figuring out what they are getting from their Trade Investment and how to improve it. We continue to expect old practices to take us to new places. Over $200 Billion is spent annually on Trade Investment representing over 23% of revenue for the average CPG company. Disparate Data Silos Excel Spreadsheet Dependency Time Consuming Processes Uninformed Decision Making
  • 4.
    Why? Our businesscontinues to change. We must change if we want to continue to do business.
  • 5.
    Copyright©2015TheNielsenCompany.Confidentialandproprietary. 5 LIVING IN AGROWTH-CHALLENGED ENVIRONMENT Sources: Nielsen Strategic Planner & Nielsen Convenience Planner, Total U.S. – All Outlets Combined (plus Convenience), 52 W/E 12/25/10 (% change vs. year ago); Nielsen Answers, Total U.S. – All Outlets Combined (plus Convenience), 52 W/E 12/31/11, 12/29/12, 12/28/13, 12/27/14, and YTD 21 W/E 05/23/15 (% change vs. year ago); US DOLLAR SALES FLAT OR DECLINING 45% of categories are representing 40% of total revenue ($’s) US UNIT SALES -0.1 -0.2
  • 6.
    Copyright©2015TheNielsenCompany.Confidentialandproprietary. 6 TRADITIONAL APPROACHES AREFALLING SHORT Source: Nielsen Promotion Benchmark Analysis: 2013 Q1 - 2015 Q4, Nielsen Scantrack: xAOC 2013 vs. 2010 MORE FREQUENT PROMOTIONS, BUT TRADE EFFICIENCY IS ERODING ADDING ITEMS TO THE SHELF ISN’T WORKING EXISTING ITEMS ($17.4B) $18.7BNEW ITEMS $ 1.3BNET GAIN
  • 7.
    7 Sales Volume $ THE RESULTIS INCREASED PRESSURE AROUND TRADE SPEND Regular Price • Own • Own vs. Competitors Trade Activity (Own and Competitors) • Features • Displays • Price Reductions $ Seasonality, Store Effects, Others
  • 8.
    Quantified Return onTrade Investment Harmonization of disparate data silos (POS, Spend, COGs, Pricing, & Shipment) Post-Event Analytics to foster data-driven decision making Predictive What-If Scenario Planning providing both manufacturer and retailer KPIs Event and Calendar Optimization using constraint-based modeling Trade Promotion Optimization combines Post-Event Analysis with Predictive Planning to maximize the performance and effectiveness of your trade strategy. Integrates with TPM Solution
  • 9.
    POST PROMOTIONAL EVENTANALYSIS – WHAT TO LOOK FOR?  Base Volume  Is it stable or has it gone up or down? Why?  What is regular retail price? Has there been a change in price?  Promotional Volume/Activities  Was agreed upon promotional price executed? Do any promotional price thresholds exist?  Was display activity executed and how well?  Was feature activity executed and how well?  Which activity(ies) drove the most volume for the cost associated?  Are there any marketing activities taking place at same time that could have driven volume?  Did these promotional activities cause cannibalization to other products in our portfolio?  Are you promoting in the right accounts?  What were your competitors doing during your promotional event?  What have I learned from this analysis for future strategy planning/optimization?
  • 10.
    BASE VOLUME –WHAT TO LOOK FOR/CONSIDER  How are you looking at base volume? Using internal or syndicated data?  Is it stable or has it gone up or down? Why?  What is regular retail price? Has there been a change in price?  When is the last time you analyzed your competition’s base volume and regular retail price?
  • 11.
    It’s starts withBase Volume! Syndicated baselines models can overstate baseline volume, leading understated incremental Revenue, Profit and ROI’s. An accurate baseline is crucial to determine promotional lift and calculate the ROI and effectiveness of a promotion. Syndicated Baselines
  • 12.
    BASE VOLUME VSBASE PRICE
  • 13.
    PROMOTIONAL VOLUME/ACTIVITIES –WHAT TO LOOK FOR?  Was agreed upon promotional price executed? Do any promotional price thresholds exist?  Was display activity executed and how well?  Was feature activity executed and how well?  Which activity(ies) drove the most volume for the cost associated?  Are there any marketing activities taking place at same time that could have driven volume?  Did these promotional activities cause cannibalization to other products in our portfolio?  Are you promoting in the right accounts?
  • 14.
    You can’t analyzewhat you can’t see TPM Data with KPI’s Key Competitive Promotions & Merchandising Promotion Price and Merchandising Support Consumer Promotion Events & Impact
  • 15.
    Promotional Pricing Strategy- Elasticity EDLP Divert trade investment away from promotions to keep base price low on an everyday basis Options Ability to leverage both base and promotion, depending on objectives and retailer’s category strategy High-Shallow Reduce depth of promotional discounts or increase everyday price to recapture margin and drive additional GP High-Low Invest in promotion to drive volume and protect share by increasing base price to fund additional promotion depth/frequency Decision Framework for Price Changes & Promotional Discounts Low HighPromotional Price Elasticity/Intensity Low High BasePriceElasticity
  • 16.
  • 17.
    Understanding What TradeSpend Drives the Most Volume 31 25 36 82 77 75 60 48 60 125 92 SEGMENT 1 SEGMENT 2 SEGMENT 3 TPR Only Display Feature F&D Total Weeks 11.9 13.9 11.7 TPR Only 9.1 9.8 10.5 Display & TPR 0.7 1.2 0.8 Feature & TPR 1.8 2.6 0.4 F&D & TPR 0.4 0.4 0.0 Ave. Weekly Base Units 11,121,500 1,827,274 926,099 Base Support Weeks (L52 Weeks) Comparison of Brand X at an 15% Promoted Price Discount Feature outperforms Display in both lift and cost to run.
  • 18.
    Are there anymarketing activities taking place at same time?
  • 19.
    Did promotional activitiescreate cannibalization to your other products or the competition?
  • 20.
    What Accounts AreMost Responsive? 30 24 29 33 23 32 25 35 39 37 33 31 31 23 21 28 33 21 21 24 20 40 45 40 35 28 54 45 57 66 43 53 49 55 79 82 72 66 59 0 20 40 60 80 100 120 AHOLD ALB/SFYSHAWS ALB/SFYTOTAL BIGY DEMOULAS FREDMEYER HANNAFORD KROGER MEIJER PRICECHOPPER SHOPRITE WEGMANS WINCO TPR Lift Additional Feature Lift  Promotional Lifts @ 15% Discount – Brand X Segment 1 Total Weeks 21.5 35.1 16.4 32.8 16.2 6.7 3.1 10.2 12.4 11.1 11.0 2.5 10.7 TPR Only 15.6 6.9 12.2 23.0 7.6 5.7 2.3 9.9 12.3 3.7 9.5 0.8 6.6 Ad Only 3.99 14.36 2.77 7.47 4.67 1.00 0.00 0.31 0.00 4.72 1.27 0.00 0.00 Base Support Weeks (L52 Weeks) Shift promotional funds to highly responsive accounts
  • 21.
    WHAT WERE YOURCOMPETITORS DOING DURING YOUR PROMOTIONAL EVENT? Promotional Activity Own Product Competitor A Competitor B Competitor C Total Unit Volume 63,408 12,019 6,577 38,251 Base Unit Volume 19,910 3,342 6,577 12,590 Incremental Unit Volume 43,498 8,677 25,661 Regular Price $3.99 $3.74 $4.99 $3.60 Promoted Price $2.99 $2.99 $2.99 Discount 25% 20% 17% ACV Dist % 100% 100% 97% 100% ACV Any Ad % 100% 99% 100% ACV Any Display % 36% 3% 12%
  • 22.
    INSIGHTS INTO THECOMPETITION
  • 23.
    FUTURE STRATEGY PLANNING/OPTIMIZATIONOF PROMOTIONS  What is the most effective promoted price point?  Is the money I am spending for display activity worth the investment and being executed?  How much volume is the money I spend on an ad driving?  Which week is the best week to promote during the month?
  • 24.
  • 25.
    WILL A DISPLAYAND/OR AD GIVE ME A GOOD RETURN?
  • 26.
    WHICH WEEK INTHE MONTH IS BEST TO PROMOTE?
  • 27.
    Taking the stepswe just discussed will ensure that your organization is slowly, but surely working towards better understanding and optimizing your trade spend dollars to ensure maximum profitability and ROI.
  • 28.

Editor's Notes

  • #6 We’re living in a growth challenged environment; CPG sales are flat with almost half of the categories across the store declining. Growth is coming from price – industry is taking price overall – how long is that sustainable? How long are consumers going to stand for increased prices relative to other options that are out there? Especially amongst branded products?
  • #7 Two traditional drivers of growth, Innovation and Promotion are proving ineffective. Innovation: while new items have generated nearly $19B in sales, the items they’re replacing on-shelf have eroded nearly all of those sales gains. Net result – industry can talk about growth from innovation but can’t just look at it in isolation potential drivers – innovation might not be unique, differentiated or fit consumer needs Maybe just be line extensions that show up as innovation Assortment on how they are executing on shelf Promotion: promotion dollars continue to increase while the effectiveness of those promotions continues to decline. This is not sustainable.
  • #8 Lack of upside growth has put increased on pressure to optimize cost areas particularly trade given the size of the spend and the need to drive incremental sales