Download as PDF, PPTX


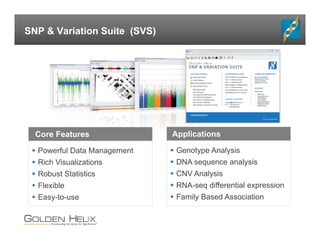
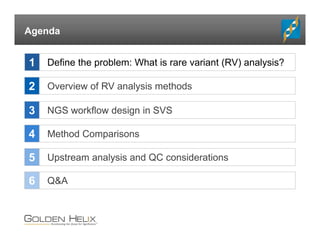
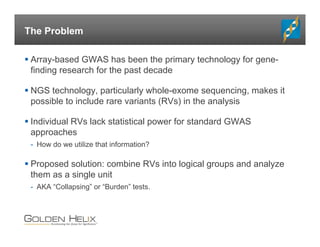
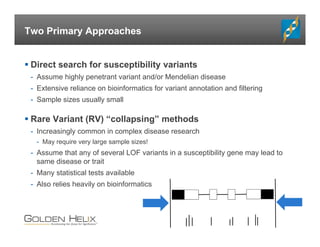


The document presents an overview of population-based DNA variant analysis using Golden Helix SVS, highlighting tools for analyzing rare variants (RVs) and methods like 'collapsing' or 'burden' tests that combine RVs for statistical significance. It discusses various statistical methods for RV analysis, including burden tests and kernel tests, as well as bioinformatics approaches for variant annotation and filtering. Additionally, it emphasizes the flexibility of the SVS platform in designing workflows to explore genomic data for disease-associated variants.


![Cells and Organs of immune system [Autosaved].pptx](https://cdn.slidesharecdn.com/ss_thumbnails/cellsandorgansofimmunesystemautosaved-260123152717-ea0cb261-thumbnail.jpg?width=640&height=640&fit=bounds)


