Downloaded 323 times
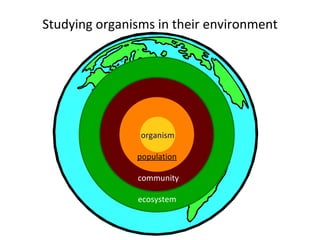

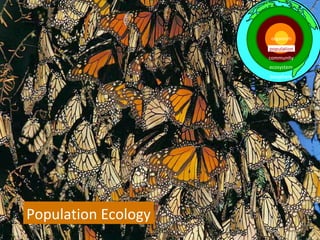
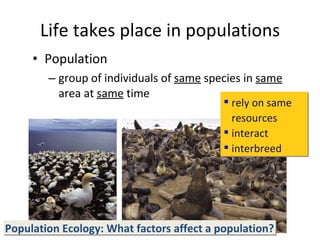
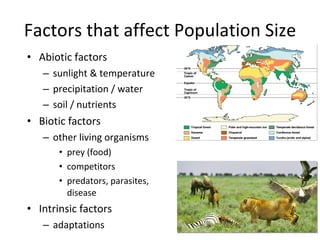
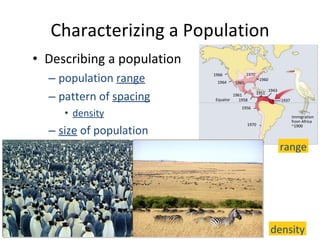
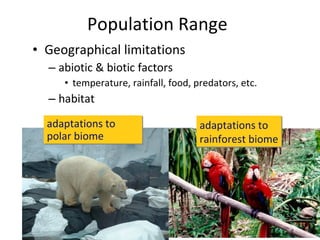
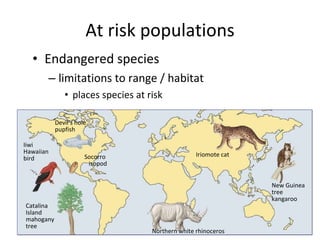
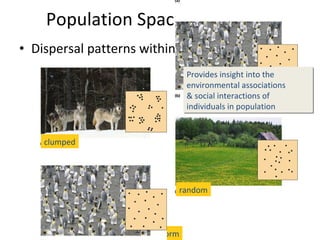
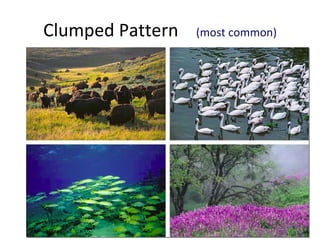
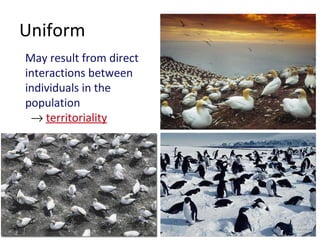
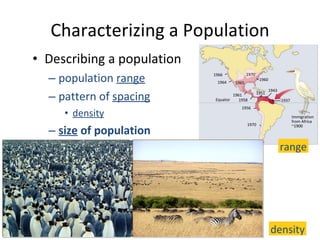
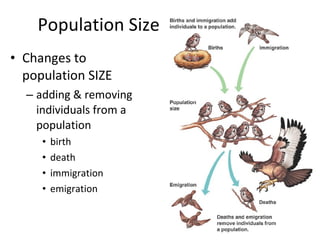
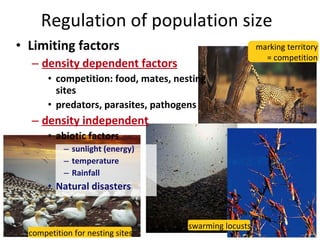
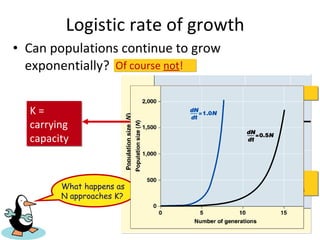
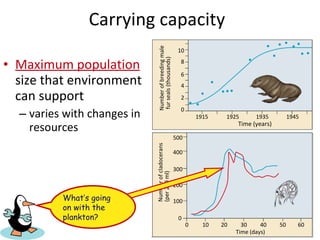
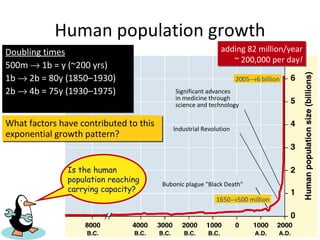


This document discusses various factors that affect population size, including abiotic factors like temperature and biotic factors like predators. It describes different population characteristics such as range, density, growth rates, and survivorship curves. The main factors influencing population growth are discussed, such as carrying capacity, exponential versus logistic growth models, and density-dependent limiting factors that regulate population size.


