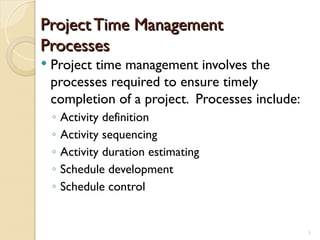
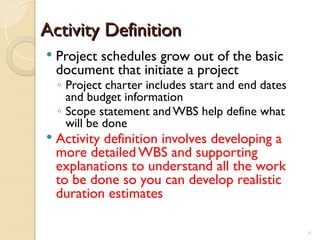
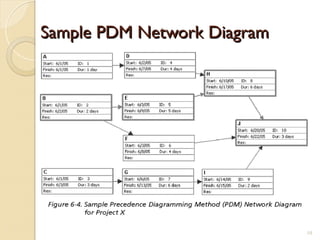
Chapter 3:
Chapter 3:
Project Time Management
Importance of Project Schedules
 Managers often cite delivering projects on
time as one of their biggest challenges
 Average time overrun from 1995 CHAOS
report was 222%; improved to 163% in 2001
study
 Time has the least amount of flexibility; it
passes no matter what
 Schedule issues are the main reason for
conflicts on projects, especially during the
second half of projects
2
Project Time Management
Processes
Processes
 Project time management involves the
processes required to ensure timely
completion of a project. Processes include:
◦ Activity definition
◦ Activity sequencing
◦ Activity duration estimating
◦ Schedule development
◦ Schedule control
3
Activity Definition
Activity Definition
 Project schedules grow out of the basic
document that initiate a project
◦ Project charter includes start and end dates
and budget information
◦ Scope statement and WBS help define what
will be done
 Activity definition involves developing a
more detailed WBS and supporting
explanations to understand all the work
to be done so you can develop realistic
duration estimates
4
Activity Sequencing
Activity Sequencing
 Involves reviewing activities and
determining dependencies
◦ Mandatory dependencies: inherent in the
nature of the work; hard logic
◦ Discretionary dependencies: defined by the
project team; soft logic
◦ External dependencies: involve relationships
between project and non-project activities
 You must determine dependencies in
order to use critical path analysis
5
Project Network Diagrams
 Project network diagrams are the
preferred technique for showing activity
sequencing
 A project network diagram is a schematic
display of the logical relationships among,
or sequencing of, project activities
6
Figure 6-2. Sample Activity-on-Arrow (AOA)
Network Diagram for Project X
7
Arrow Diagramming Method
(ADM)
(ADM)
 Also called activity-on-arrow (AOA)
project network diagrams
 Activities are represented by arrows
 Nodes or circles are the starting and
ending points of activities
 Can only show finish-to-start
dependencies
8
Process for Creating AOA Diagrams
1. Find all of the activities that start at node 1. Draw their finish
nodes and draw arrows between node 1 and those finish
nodes. Put the activity letter or name and duration estimate
on the associated arrow
2. Continuing drawing the network diagram, working from left to
right. Look for bursts and merges. Bursts occur when a single
node is followed by two or more activities. A merge occurs
when two or more nodes precede a single node
3. Continue drawing the project network diagram until all
activities are included on the diagram that have dependencies
4.As a rule of thumb, all arrowheads should face toward the
right, and no arrows should cross on an AOA network
diagram
9
Sample PDM Network Diagram
10
Activity Duration Estimating
 After defining activities and determining
their sequence, the next step in time
management is duration estimating
 Duration includes the actual amount of time
worked on an activity plus elapsed time
 Effort is the number of workdays or work
hours required to complete a task. Effort
does not equal duration
 People doing the work should help create
estimates, and an expert should review
them
11
Schedule Development
 Schedule development uses results of
the other time management processes
to determine the start and end date of
the project and its activities
 Ultimate goal is to create a realistic
project schedule that provides a basis
for monitoring project progress for the
time dimension of the project
 Important tools and techniques include
Gantt charts, PERT analysis, critical path
analysis, and critical chain scheduling
12
Gantt Charts
Gantt Charts
 Gantt charts provide a standard format
for displaying project schedule
information by listing project activities
and their corresponding start and finish
dates in a calendar format
 Symbols include:
◦ A black diamond: milestones or significant
events on a project with zero duration
◦ Thick black bars: summary tasks
◦ Lighter horizontal bars: tasks
◦ Arrows: dependencies between tasks
13
Figure 6-5. Gantt Chart for Project X
14
Gantt Chart for Software Launch Project
15
Milestones
Milestones
 Milestones are significant events on a
project that normally have zero duration
 You can follow the SMART criteria in
developing milestones that are:
◦ Specific
◦ Measurable
◦ Assignable
◦ Realistic
◦ Time-framed
16
Sample Tracking Gantt Chart
17
Critical Path Method (CPM)
 CPM is a project network analysis technique
used to predict total project duration
 A critical path for a project is the series of
activities that determines the earliest time by
which the project can be completed
 The critical path is the longest path through
the network diagram and has the least
amount of slack or float
18
Finding the Critical Path
 First develop a good project network
diagram
 Add the durations for all activities on
each path through the project network
diagram
 The longest path is the critical path
19
Simple Example of Determining the
Critical Path
Critical Path
 Consider the following project network
diagram. Assume all times are in days.
2 3
4
5
A=2 B=5
C=2
D=7
1 6
F=2
E=1
start finish
a. How many paths are on this network diagram?
b. How long is each path?
c. Which is the critical path?
d. What is the shortest amount of time needed to
complete this project?
20
Figure 6-8. Determining the Critical Path for
Project X
Project X
21
Calculating Early and Late Start and
Finish Dates
Finish Dates
22
Project 2002 Schedule TableView
Showing Free and Total Slack
23
Controlling Changes to the Project
Schedule
Schedule
 Perform reality checks on schedules
 Allow for contingencies
 Don’t plan for everyone to work at 100%
capacity all the time
 Hold progress meetings with
stakeholders and be clear and honest in
communicating schedule issues
24
Working with People Issues
 Strong leadership helps projects succeed
more than good PERT charts
 Project managers should use
◦ empowerment
◦ incentives
◦ discipline
◦ negotiation
25

chapter03------project tme managment.ppt

  • 1.
    Chapter 3: Chapter 3: ProjectTime Management Project Time Management
  • 2.
    Importance of ProjectSchedules Importance of Project Schedules  Managers often cite delivering projects on time as one of their biggest challenges  Average time overrun from 1995 CHAOS report was 222%; improved to 163% in 2001 study  Time has the least amount of flexibility; it passes no matter what  Schedule issues are the main reason for conflicts on projects, especially during the second half of projects 2
  • 3.
    Project Time Management ProjectTime Management Processes Processes  Project time management involves the processes required to ensure timely completion of a project. Processes include: ◦ Activity definition ◦ Activity sequencing ◦ Activity duration estimating ◦ Schedule development ◦ Schedule control 3
  • 4.
    Activity Definition Activity Definition Project schedules grow out of the basic document that initiate a project ◦ Project charter includes start and end dates and budget information ◦ Scope statement and WBS help define what will be done  Activity definition involves developing a more detailed WBS and supporting explanations to understand all the work to be done so you can develop realistic duration estimates 4
  • 5.
    Activity Sequencing Activity Sequencing Involves reviewing activities and determining dependencies ◦ Mandatory dependencies: inherent in the nature of the work; hard logic ◦ Discretionary dependencies: defined by the project team; soft logic ◦ External dependencies: involve relationships between project and non-project activities  You must determine dependencies in order to use critical path analysis 5
  • 6.
    Project Network Diagrams ProjectNetwork Diagrams  Project network diagrams are the preferred technique for showing activity sequencing  A project network diagram is a schematic display of the logical relationships among, or sequencing of, project activities 6
  • 7.
    Figure 6-2. SampleActivity-on-Arrow (AOA) Figure 6-2. Sample Activity-on-Arrow (AOA) Network Diagram for Project X Network Diagram for Project X 7
  • 8.
    Arrow Diagramming Method ArrowDiagramming Method (ADM) (ADM)  Also called activity-on-arrow (AOA) project network diagrams  Activities are represented by arrows  Nodes or circles are the starting and ending points of activities  Can only show finish-to-start dependencies 8
  • 9.
    Process for CreatingAOA Diagrams Process for Creating AOA Diagrams 1. Find all of the activities that start at node 1. Draw their finish nodes and draw arrows between node 1 and those finish nodes. Put the activity letter or name and duration estimate on the associated arrow 2. Continuing drawing the network diagram, working from left to right. Look for bursts and merges. Bursts occur when a single node is followed by two or more activities. A merge occurs when two or more nodes precede a single node 3. Continue drawing the project network diagram until all activities are included on the diagram that have dependencies 4.As a rule of thumb, all arrowheads should face toward the right, and no arrows should cross on an AOA network diagram 9
  • 10.
    Sample PDM NetworkDiagram Sample PDM Network Diagram 10
  • 11.
    Activity Duration Estimating ActivityDuration Estimating  After defining activities and determining their sequence, the next step in time management is duration estimating  Duration includes the actual amount of time worked on an activity plus elapsed time  Effort is the number of workdays or work hours required to complete a task. Effort does not equal duration  People doing the work should help create estimates, and an expert should review them 11
  • 12.
    Schedule Development Schedule Development Schedule development uses results of the other time management processes to determine the start and end date of the project and its activities  Ultimate goal is to create a realistic project schedule that provides a basis for monitoring project progress for the time dimension of the project  Important tools and techniques include Gantt charts, PERT analysis, critical path analysis, and critical chain scheduling 12
  • 13.
    Gantt Charts Gantt Charts Gantt charts provide a standard format for displaying project schedule information by listing project activities and their corresponding start and finish dates in a calendar format  Symbols include: ◦ A black diamond: milestones or significant events on a project with zero duration ◦ Thick black bars: summary tasks ◦ Lighter horizontal bars: tasks ◦ Arrows: dependencies between tasks 13
  • 14.
    Figure 6-5. GanttChart for Project X Figure 6-5. Gantt Chart for Project X 14
  • 15.
    Gantt Chart forSoftware Launch Project Gantt Chart for Software Launch Project 15
  • 16.
    Milestones Milestones  Milestones aresignificant events on a project that normally have zero duration  You can follow the SMART criteria in developing milestones that are: ◦ Specific ◦ Measurable ◦ Assignable ◦ Realistic ◦ Time-framed 16
  • 17.
    Sample Tracking GanttChart Sample Tracking Gantt Chart 17
  • 18.
    Critical Path Method(CPM) Critical Path Method (CPM)  CPM is a project network analysis technique used to predict total project duration  A critical path for a project is the series of activities that determines the earliest time by which the project can be completed  The critical path is the longest path through the network diagram and has the least amount of slack or float 18
  • 19.
    Finding the CriticalPath Finding the Critical Path  First develop a good project network diagram  Add the durations for all activities on each path through the project network diagram  The longest path is the critical path 19
  • 20.
    Simple Example ofDetermining the Simple Example of Determining the Critical Path Critical Path  Consider the following project network diagram. Assume all times are in days. 2 3 4 5 A=2 B=5 C=2 D=7 1 6 F=2 E=1 start finish a. How many paths are on this network diagram? b. How long is each path? c. Which is the critical path? d. What is the shortest amount of time needed to complete this project? 20
  • 21.
    Figure 6-8. Determiningthe Critical Path for Figure 6-8. Determining the Critical Path for Project X Project X 21
  • 22.
    Calculating Early andLate Start and Calculating Early and Late Start and Finish Dates Finish Dates 22
  • 23.
    Project 2002 ScheduleTableView Project 2002 Schedule TableView Showing Free and Total Slack Showing Free and Total Slack 23
  • 24.
    Controlling Changes tothe Project Controlling Changes to the Project Schedule Schedule  Perform reality checks on schedules  Allow for contingencies  Don’t plan for everyone to work at 100% capacity all the time  Hold progress meetings with stakeholders and be clear and honest in communicating schedule issues 24
  • 25.
    Working with PeopleIssues Working with People Issues  Strong leadership helps projects succeed more than good PERT charts  Project managers should use ◦ empowerment ◦ incentives ◦ discipline ◦ negotiation 25