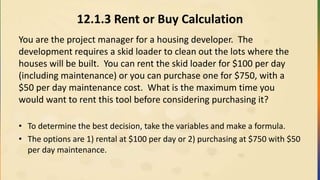
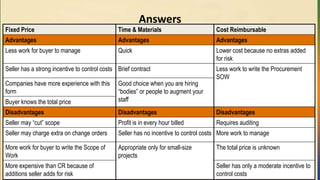
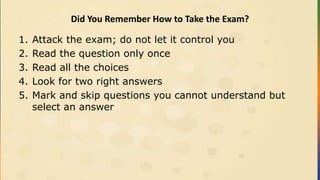
You are the project manager for a new
software development project. Your project is behind
schedule and over budget. Which of the following
actions should you take FIRST?
Introductions
• Who areyou?
• What is the largest project you have managed?
• What Project Management Methodologies & Tools have worked
with?
– PMBOK® Guide, Agile, Six Sigma, Prince2 or tools MS Project,
Primavera
• What benefits do you anticipate from taking this class?
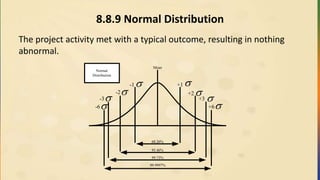
2
3.
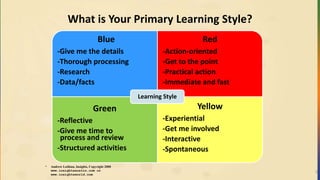
What is YourPrimary Learning Style?
3
* Andrew Lothian, Insights, Copyright 2000
www.insightsaustin.com or
www.insightsworld.com
Blue
-Give me the details
-Thorough processing
-Research
-Data/facts
Red
-Action-oriented
-Get to the point
-Practical action
-Immediate and fast
Green
-Reflective
-Give me time to
process and review
-Structured activities
Yellow
-Experiential
-Get me involved
-Interactive
-Spontaneous
Learning Style
4.
Learning Objectives
• Understandthe 47 processes, 10 knowledge areas and terminology
within the PMBOK® Guide, 5th edition
• Practice simulated exam questions
The terminology described herein is the generally accepted standard in
the United States and many other countries as outlined in the Project
Management Institute’s Guide to the Project Management Body of
Knowledge®, Fifth Edition, (PMBOK® Guide)
4
Ground Rules
We agreeto:
• Respect others by:
– Actively listen to others
– Turning off electronic devices
– Putting cell phones on silent mode
– Promoting positive feedback
– Watching your timing
– Using “parking lot” to stay focused
• Create an “Pass the Exam” Plan
6
7.
Course Outline
• Welcome
•Exam Registration and
Environment
• Framework
• Integration
• Scope
• Time
• Cost
• Quality
• Human Resource
• Communication
• Risk
• Procurement
• Stakeholder
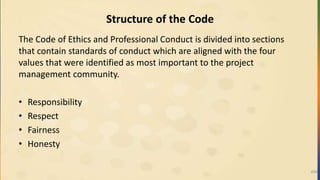
• Professional and Social
Responsibility
• Exam Tips
7
What is PMI®?
• Founded in 1969
• Current Project Management Standard
– A guide to the Project Management Body of Knowledge (PMBOK)
version 5.0
Certifications =
• Certified Associate in Project Management (CAPM)®
• Project Management Professional (PMP)®
9
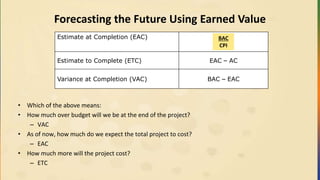
10.
Individual Exercise
What areyour reasons for wanting to obtain a PMI® Credential?
Are You a PMP® Candidate?
The PMP® is perfect if you have demonstrated experience and
competence in leading project teams.
Are You a CAPM® Candidate?
The CAPM® is a good entry-level certification if you’re new to project
management, or still figuring out your career path.
11.
Reasons for Earninga PMI® Credential
• Serves as an unbiased endorsement of your PM knowledge and
experience on a global level
• Can lead to career opportunities & advancement
• Recognition of your knowledge, skills and abilities
• Reflects achievement
• Prepares you for greater job responsibilities
• Builds self-confidence
• Allows for greater recognition from peers
• Enhances the profession
11
12.
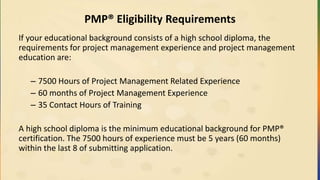
PMP® Eligibility Requirements
Ifyour educational background consists of a high school diploma, the
requirements for project management experience and project management
education are:
– 7500 Hours of Project Management Related Experience
– 60 months of Project Management Experience
– 35 Contact Hours of Training
A high school diploma is the minimum educational background for PMP®
certification. The 7500 hours of experience must be 5 years (60 months)
within the last 8 of submitting application.
13.
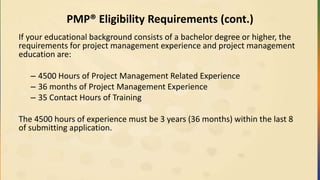
PMP® Eligibility Requirements(cont.)
If your educational background consists of a bachelor degree or higher, the
requirements for project management experience and project management
education are:
– 4500 Hours of Project Management Related Experience
– 36 months of Project Management Experience
– 35 Contact Hours of Training
The 4500 hours of experience must be 3 years (36 months) within the last 8
of submitting application.
14.
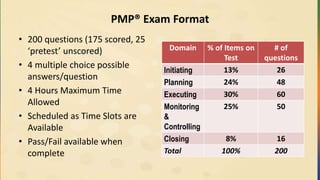
PMP® Exam Format
•200 questions (175 scored, 25
‘pretest’ unscored)
• 4 multiple choice possible
answers/question
• 4 Hours Maximum Time
Allowed
• Scheduled as Time Slots are
Available
• Pass/Fail available when
complete
Domain % of Items on
Test
# of
questions
Initiating 13% 26
Planning 24% 48
Executing 30% 60
Monitoring
&
Controlling
25% 50
Closing 8% 16
Total 100% 200
15.
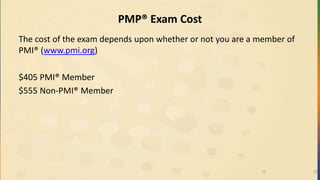
PMP® Exam Cost
Thecost of the exam depends upon whether or not you are a member of
PMI® (www.pmi.org)
$405 PMI® Member
$555 Non-PMI® Member
1515
16.
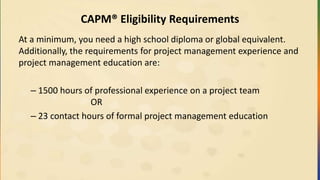
CAPM® Eligibility Requirements
Ata minimum, you need a high school diploma or global equivalent.
Additionally, the requirements for project management experience and
project management education are:
– 1500 hours of professional experience on a project team
OR
– 23 contact hours of formal project management education
17.
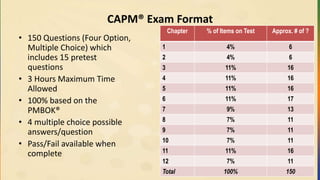
CAPM® Exam Format
•150 Questions (Four Option,
Multiple Choice) which
includes 15 pretest
questions
• 3 Hours Maximum Time
Allowed
• 100% based on the
PMBOK®
• 4 multiple choice possible
answers/question
• Pass/Fail available when
complete
Chapter % of Items on Test Approx. # of ?
1 4% 6
2 4% 6
3 11% 16
4 11% 16
5 11% 16
6 11% 17
7 9% 13
8 7% 11
9 7% 11
10 7% 11
11 11% 16
12 7% 11
Total 100% 150
18.
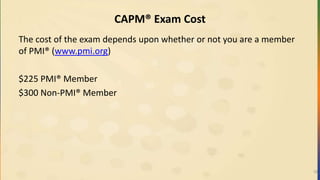
CAPM® Exam Cost
Thecost of the exam depends upon whether or not you are a member
of PMI® (www.pmi.org)
$225 PMI® Member
$300 Non-PMI® Member
18
19.
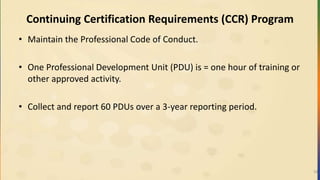
Continuing Certification Requirements(CCR) Program
• Maintain the Professional Code of Conduct.
• One Professional Development Unit (PDU) is = one hour of training or
other approved activity.
• Collect and report 60 PDUs over a 3-year reporting period.
19
20.
Preparing for ExamDay
Studying and
Scheduling
• Schedule your exam for a time when you are most alert. Try not to
schedule your exam to follow a day's work.
• A good night's sleep the night before the exam and eating well a few
days before hand will help greatly.
• Cramming the day before is not a bad idea, as it can help you detect
any final subject areas that need last minute study.
• The tables, charts, and other items that we suggest you memorize are
"musts" for success. Know them cold and be able to recreate them on
your scratch paper in the test room.
Practicing
• Practice tests help you become familiar with the environment as well as the question layout
and timing.
• When taking practice tests, focus on the speed at which you complete the questions. On
average, you have 72 seconds per question. While there are no additional points for completing
more quickly than anyone else, being practiced enough to set a good pace can give you an
advantage, especially when you hit "the wall" on the exam. Your mind will be accustomed to
processing questions at a pace that is above normal.
• Take the exam tutorial. It can help give you a better understanding of all your options in the
environment.
21.
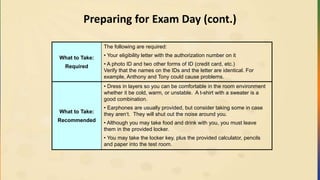
Preparing for ExamDay (cont.)
What to Take:
Required
The following are required:
• Your eligibility letter with the authorization number on it
• A photo ID and two other forms of ID (credit card, etc.)
Verify that the names on the IDs and the letter are identical. For
example, Anthony and Tony could cause problems.
What to Take:
Recommended
• Dress in layers so you can be comfortable in the room environment
whether it be cold, warm, or unstable. A t-shirt with a sweater is a
good combination.
• Earphones are usually provided, but consider taking some in case
they aren‘t. They will shut out the noise around you.
• Although you may take food and drink with you, you must leave
them in the provided locker.
• You may take the locker key, plus the provided calculator, pencils
and paper into the test room.
22.
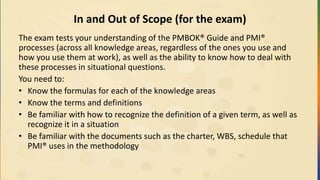
In and Outof Scope (for the exam)
The exam tests your understanding of the PMBOK® Guide and PMI®
processes (across all knowledge areas, regardless of the ones you use and
how you use them at work), as well as the ability to know how to deal with
these processes in situational questions.
You need to:
• Know the formulas for each of the knowledge areas
• Know the terms and definitions
• Be familiar with how to recognize the definition of a given term, as well as
recognize it in a situation
• Be familiar with the documents such as the charter, WBS, schedule that
PMI® uses in the methodology
23.
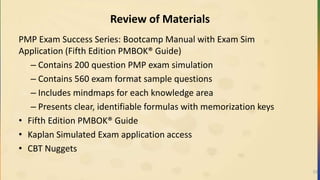
Review of Materials
PMPExam Success Series: Bootcamp Manual with Exam Sim
Application (Fifth Edition PMBOK® Guide)
– Contains 200 question PMP exam simulation
– Contains 560 exam format sample questions
– Includes mindmaps for each knowledge area
– Presents clear, identifiable formulas with memorization keys
• Fifth Edition PMBOK® Guide
• Kaplan Simulated Exam application access
• CBT Nuggets
23
24.
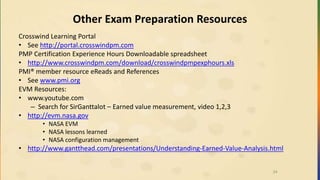
Other Exam PreparationResources
Crosswind Learning Portal
• See http://portal.crosswindpm.com
PMP Certification Experience Hours Downloadable spreadsheet
• http://www.crosswindpm.com/download/crosswindpmpexphours.xls
PMI® member resource eReads and References
• See www.pmi.org
EVM Resources:
• www.youtube.com
– Search for SirGanttalot – Earned value measurement, video 1,2,3
• http://evm.nasa.gov
• NASA EVM
• NASA lessons learned
• NASA configuration management
• http://www.gantthead.com/presentations/Understanding-Earned-Value-Analysis.html
24
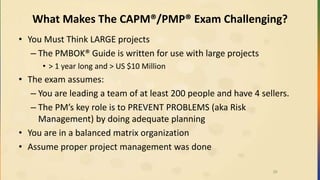
What Makes TheCAPM®/PMP® Exam Challenging?
• You Must Think LARGE projects
– The PMBOK® Guide is written for use with large projects
• > 1 year long and > US $10 Million
• The exam assumes:
– You are leading a team of at least 200 people and have 4 sellers.
– The PM’s key role is to PREVENT PROBLEMS (aka Risk
Management) by doing adequate planning
• You are in a balanced matrix organization
• Assume proper project management was done
26
27.
Team Exercise
Instructions:
• Turnto page 17 of the Bootcamp Manual and review the “PMI
Theory Pills”
• Put a star next to the top two that you do not understand or know.
28.
Brain Dump List
•A brain dump is important information that you write down as you
begin your PMP® examination. We recommend that you write down
your brain dump during the tutorial of the exam. This tutorial
happens in the first fifteen minutes before your four hours actually
start. Ensure that you can do this cold in fifteen minutes or less
before you take the test.
• Every brain dump is personal and relates to key items people feel
they need to have listed in the brain dump.
** Refer to the QUICK REFERENCE GUIDE inserted in your Bootcamp
Manual for items to put on your Brain Dump list **
29.
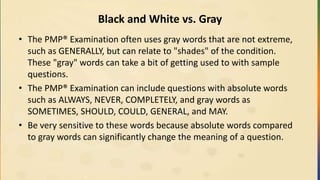
Black and Whitevs. Gray
• The PMP® Examination often uses gray words that are not extreme,
such as GENERALLY, but can relate to "shades" of the condition.
These "gray" words can take a bit of getting used to with sample
questions.
• The PMP® Examination can include questions with absolute words
such as ALWAYS, NEVER, COMPLETELY, and gray words as
SOMETIMES, SHOULD, COULD, GENERAL, and MAY.
• Be very sensitive to these words because absolute words compared
to gray words can significantly change the meaning of a question.
30.
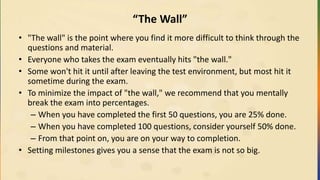
“The Wall”
• "Thewall" is the point where you find it more difficult to think through the
questions and material.
• Everyone who takes the exam eventually hits "the wall."
• Some won't hit it until after leaving the test environment, but most hit it
sometime during the exam.
• To minimize the impact of "the wall," we recommend that you mentally
break the exam into percentages.
– When you have completed the first 50 questions, you are 25% done.
– When you have completed 100 questions, consider yourself 50% done.
– From that point on, you are on your way to completion.
• Setting milestones gives you a sense that the exam is not so big.
31.
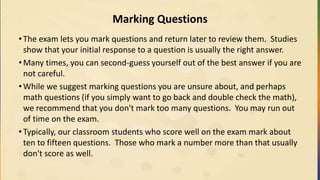
Marking Questions
• Theexam lets you mark questions and return later to review them. Studies
show that your initial response to a question is usually the right answer.
• Many times, you can second-guess yourself out of the best answer if you are
not careful.
• While we suggest marking questions you are unsure about, and perhaps
math questions (if you simply want to go back and double check the math),
we recommend that you don't mark too many questions. You may run out
of time on the exam.
• Typically, our classroom students who score well on the exam mark about
ten to fifteen questions. Those who mark a number more than that usually
don't score as well.
32.
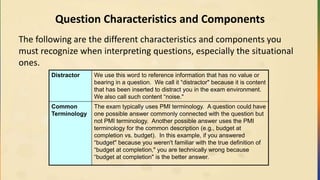
Question Characteristics andComponents
The following are the different characteristics and components you
must recognize when interpreting questions, especially the situational
ones.
Distractor We use this word to reference information that has no value or
bearing in a question. We call it “distractor" because it is content
that has been inserted to distract you in the exam environment.
We also call such content “noise."
Common
Terminology
The exam typically uses PMI terminology. A question could have
one possible answer commonly connected with the question but
not PMI terminology. Another possible answer uses the PMI
terminology for the common description (e.g., budget at
completion vs. budget). In this example, if you answered
“budget" because you weren't familiar with the true definition of
“budget at completion," you are technically wrong because
“budget at completion" is the better answer.
33.
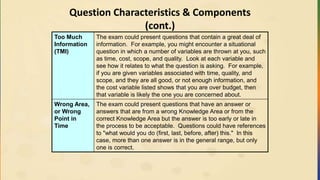
Question Characteristics &Components
(cont.)
Too Much
Information
(TMI)
The exam could present questions that contain a great deal of
information. For example, you might encounter a situational
question in which a number of variables are thrown at you, such
as time, cost, scope, and quality. Look at each variable and
see how it relates to what the question is asking. For example,
if you are given variables associated with time, quality, and
scope, and they are all good, or not enough information, and
the cost variable listed shows that you are over budget, then
that variable is likely the one you are concerned about.
Wrong Area,
or Wrong
Point in
Time
The exam could present questions that have an answer or
answers that are from a wrong Knowledge Area or from the
correct Knowledge Area but the answer is too early or late in
the process to be acceptable. Questions could have references
to "what would you do (first, last, before, after) this." In this
case, more than one answer is in the general range, but only
one is correct.
34.
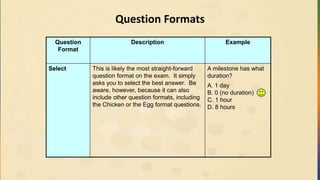
Question Formats
Question
Format
Description Example
SelectThis is likely the most straight-forward
question format on the exam. It simply
asks you to select the best answer. Be
aware, however, because it can also
include other question formats, including
the Chicken or the Egg format questions.
A milestone has what
duration?
A. 1 day
B. 0 (no duration)
C. 1 hour
D. 8 hours
35.
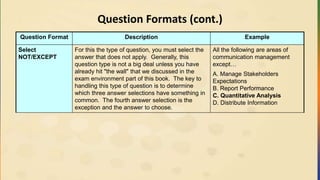
Question Formats (cont.)
QuestionFormat Description Example
Select
NOT/EXCEPT
For this the type of question, you must select the
answer that does not apply. Generally, this
question type is not a big deal unless you have
already hit "the wall" that we discussed in the
exam environment part of this book. The key to
handling this type of question is to determine
which three answer selections have something in
common. The fourth answer selection is the
exception and the answer to choose.
All the following are areas of
communication management
except…
A. Manage Stakeholders
Expectations
B. Report Performance
C. Quantitative Analysis
D. Distribute Information
36.
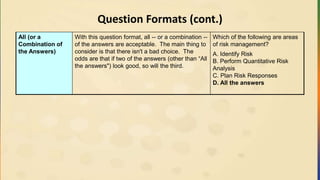
Question Formats (cont.)
All(or a
Combination of
the Answers)
With this question format, all -- or a combination --
of the answers are acceptable. The main thing to
consider is that there isn't a bad choice. The
odds are that if two of the answers (other than “All
the answers") look good, so will the third.
Which of the following are areas
of risk management?
A. Identify Risk
B. Perform Quantitative Risk
Analysis
C. Plan Risk Responses
D. All the answers
37.
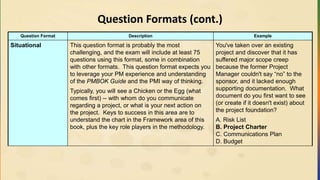
Question Formats (cont.)
QuestionFormat Description Example
Situational This question format is probably the most
challenging, and the exam will include at least 75
questions using this format, some in combination
with other formats. This question format expects you
to leverage your PM experience and understanding
of the PMBOK Guide and the PMI way of thinking.
Typically, you will see a Chicken or the Egg (what
comes first) -- with whom do you communicate
regarding a project, or what is your next action on
the project. Keys to success in this area are to
understand the chart in the Framework area of this
book, plus the key role players in the methodology.
You've taken over an existing
project and discover that it has
suffered major scope creep
because the former Project
Manager couldn't say “no” to the
sponsor, and it lacked enough
supporting documentation. What
document do you first want to see
(or create if it doesn't exist) about
the project foundation?
A. Risk List
B. Project Charter
C. Communications Plan
D. Budget
38.
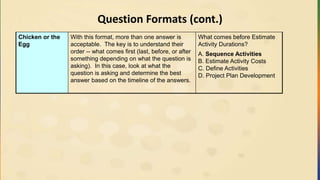
Question Formats (cont.)
Chickenor the
Egg
With this format, more than one answer is
acceptable. The key is to understand their
order -- what comes first (last, before, or after
something depending on what the question is
asking). In this case, look at what the
question is asking and determine the best
answer based on the timeline of the answers.
What comes before Estimate
Activity Durations?
A. Sequence Activities
B. Estimate Activity Costs
C. Define Activities
D. Project Plan Development
39.
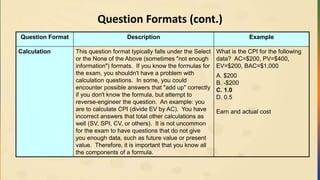
Question Formats (cont.)
QuestionFormat Description Example
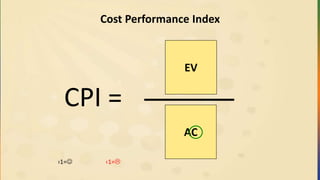
Calculation This question format typically falls under the Select
or the None of the Above (sometimes "not enough
information") formats. If you know the formulas for
the exam, you shouldn't have a problem with
calculation questions. In some, you could
encounter possible answers that "add up" correctly
if you don't know the formula, but attempt to
reverse-engineer the question. An example: you
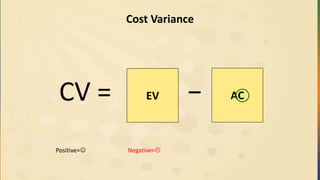
are to calculate CPI (divide EV by AC). You have
incorrect answers that total other calculations as
well (SV, SPI, CV, or others). It is not uncommon
for the exam to have questions that do not give
you enough data, such as future value or present
value. Therefore, it is important that you know all
the components of a formula.
What is the CPI for the following
data? AC=$200, PV=$400,
EV=$200, BAC=$1,000
A. $200
B. -$200
C. 1.0
D. 0.5
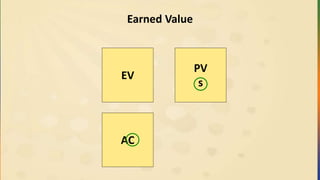
Earn and actual cost
40.
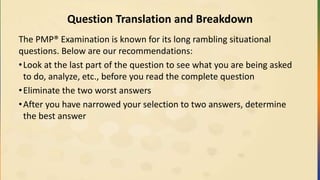
Question Translation andBreakdown
The PMP® Examination is known for its long rambling situational
questions. Below are our recommendations:
•Look at the last part of the question to see what you are being asked
to do, analyze, etc., before you read the complete question
•Eliminate the two worst answers
•After you have narrowed your selection to two answers, determine
the best answer
41.
Sample Question #1
Youare a Project Manager on an environmental excavating project. As
you monitor progress, you determine that the activities are taking
longer than estimated on the schedule because of holidays you hadn't
planned for in the schedule. What is the best solution to fix this
problem?
42.
Sample Question #1– Translation & Answer
You are a Project Manager. Your project is behind schedule because you
didn't factor holidays into the schedule. What is the best solution to fix
this problem?
Answer:
Implement a schedule change control and re-baseline the schedule
with the holidays factored in.
43.
Sample Question #1– Breaking down of Question
You are a Project Manager on an environmental excavating project. As you
monitor progress, you determine that the activities are taking longer than
estimated on the schedule because of holidays you hadn't planned for in the
schedule. What is the best solution to fix this problem?
• The first sentence establishes that you are the Project Manager. Unless
something specific about the type of project comes up, that should be
sufficient (environmental excavating wasn't covered in my version of the
PMBOK® Guide!).
• The second statement has two items of value in it. The first is that
activities are taking longer than estimated, and the cause is from not
planning in holidays into your schedule. The final sentence simply asks the
best way to fix this problem.
44.
Sample Question #2
Youhave taken over a project from another Project Manager who
wasn't having success according to the sponsor. The project is a new
type of work at your company. The cost is $50,000 over budget, and
the former Project Manager did not view the schedule as a useful tool.
What should you focus on first?
45.
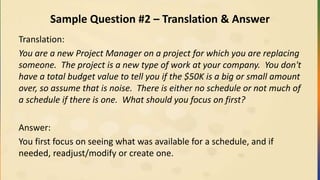
Sample Question #2– Translation & Answer
Translation:
You are a new Project Manager on a project for which you are replacing
someone. The project is a new type of work at your company. You don't
have a total budget value to tell you if the $50K is a big or small amount
over, so assume that is noise. There is either no schedule or not much of
a schedule if there is one. What should you focus on first?
Answer:
You first focus on seeing what was available for a schedule, and if
needed, readjust/modify or create one.
46.
Sample Question #3
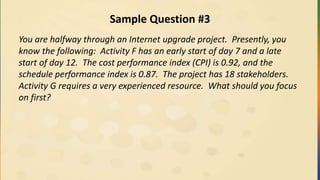
Youare halfway through an Internet upgrade project. Presently, you
know the following: Activity F has an early start of day 7 and a late
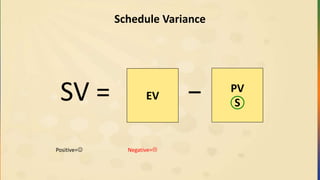
start of day 12. The cost performance index (CPI) is 0.92, and the
schedule performance index is 0.87. The project has 18 stakeholders.
Activity G requires a very experienced resource. What should you focus
on first?
47.
Sample Question #3– Translation & Answer
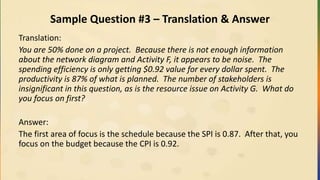
Translation:
You are 50% done on a project. Because there is not enough information
about the network diagram and Activity F, it appears to be noise. The
spending efficiency is only getting $0.92 value for every dollar spent. The
productivity is 87% of what is planned. The number of stakeholders is
insignificant in this question, as is the resource issue on Activity G. What do
you focus on first?
Answer:
The first area of focus is the schedule because the SPI is 0.87. After that, you
focus on the budget because the CPI is 0.92.
48.
Sample Question #4
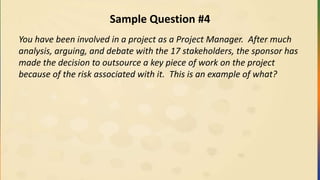
Youhave been involved in a project as a Project Manager. After much
analysis, arguing, and debate with the 17 stakeholders, the sponsor has
made the decision to outsource a key piece of work on the project
because of the risk associated with it. This is an example of what?
49.
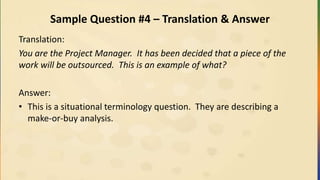
Sample Question #4– Translation & Answer
Translation:
You are the Project Manager. It has been decided that a piece of the
work will be outsourced. This is an example of what?
Answer:
• This is a situational terminology question. They are describing a
make-or-buy analysis.
50.
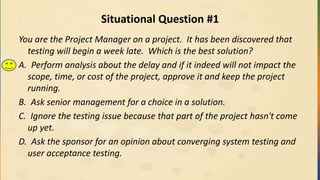
Situational Question #1
Youare the Project Manager on a project. It has been discovered that
testing will begin a week late. Which is the best solution?
A. Perform analysis about the delay and if it indeed will not impact the
scope, time, or cost of the project, approve it and keep the project
running.
B. Ask senior management for a choice in a solution.
C. Ignore the testing issue because that part of the project hasn't come
up yet.
D. Ask the sponsor for an opinion about converging system testing and
user acceptance testing.
51.
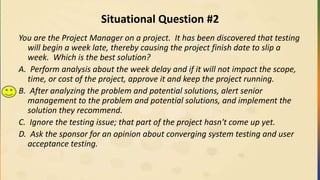
Situational Question #2
Youare the Project Manager on a project. It has been discovered that testing
will begin a week late, thereby causing the project finish date to slip a
week. Which is the best solution?
A. Perform analysis about the week delay and if it will not impact the scope,
time, or cost of the project, approve it and keep the project running.
B. After analyzing the problem and potential solutions, alert senior
management to the problem and potential solutions, and implement the
solution they recommend.
C. Ignore the testing issue; that part of the project hasn't come up yet.
D. Ask the sponsor for an opinion about converging system testing and user
acceptance testing.
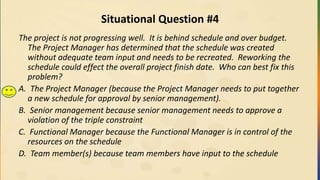
52.
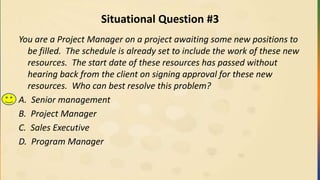
Situational Question #3
Youare a Project Manager on a project awaiting some new positions to
be filled. The schedule is already set to include the work of these new
resources. The start date of these resources has passed without
hearing back from the client on signing approval for these new
resources. Who can best resolve this problem?
A. Senior management
B. Project Manager
C. Sales Executive
D. Program Manager
53.
Situational Question #4
Theproject is not progressing well. It is behind schedule and over budget.
The Project Manager has determined that the schedule was created
without adequate team input and needs to be recreated. Reworking the
schedule could effect the overall project finish date. Who can best fix this
problem?
A. The Project Manager (because the Project Manager needs to put together
a new schedule for approval by senior management).
B. Senior management because senior management needs to approve a
violation of the triple constraint
C. Functional Manager because the Functional Manager is in control of the
resources on the schedule
D. Team member(s) because team members have input to the schedule
54.
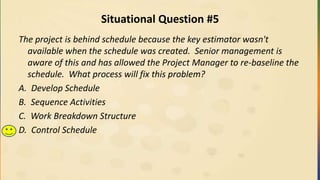
Situational Question #5
Theproject is behind schedule because the key estimator wasn't
available when the schedule was created. Senior management is
aware of this and has allowed the Project Manager to re-baseline the
schedule. What process will fix this problem?
A. Develop Schedule
B. Sequence Activities
C. Work Breakdown Structure
D. Control Schedule
55.
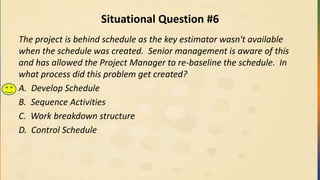
Situational Question #6
Theproject is behind schedule as the key estimator wasn't available
when the schedule was created. Senior management is aware of this
and has allowed the Project Manager to re-baseline the schedule. In
what process did this problem get created?
A. Develop Schedule
B. Sequence Activities
C. Work breakdown structure
D. Control Schedule
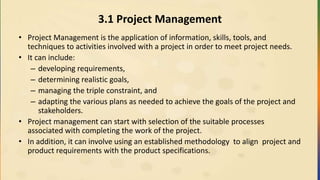
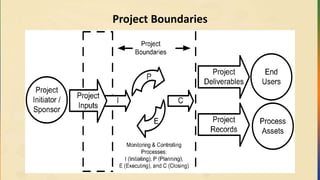
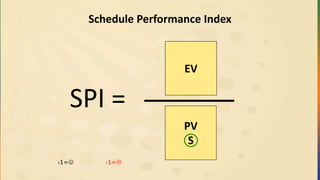
3.1 Project Management
•Project Management is the application of information, skills, tools, and
techniques to activities involved with a project in order to meet project needs.
• It can include:
– developing requirements,
– determining realistic goals,
– managing the triple constraint, and
– adapting the various plans as needed to achieve the goals of the project and
stakeholders.
• Project management can start with selection of the suitable processes
associated with completing the work of the project.
• In addition, it can involve using an established methodology to align project and
product requirements with the product specifications.
58.
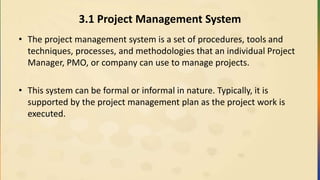
3.1 Project ManagementSystem
• The project management system is a set of procedures, tools and
techniques, processes, and methodologies that an individual Project
Manager, PMO, or company can use to manage projects.
• This system can be formal or informal in nature. Typically, it is
supported by the project management plan as the project work is
executed.
59.
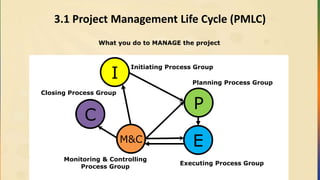
3.1 Project ManagementLife Cycle (PMLC)
What you do to MANAGE the project
Planning Process Group
Executing Process Group
Monitoring & Controlling
Process Group
Initiating Process Group
Closing Process Group
I
P
EM&C
C
60.
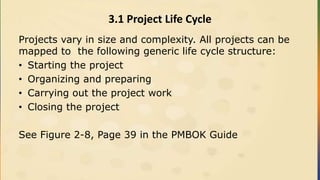
3.1 Project LifeCycle
Projects vary in size and complexity. All projects can be
mapped to the following generic life cycle structure:
• Starting the project
• Organizing and preparing
• Carrying out the project work
• Closing the project
See Figure 2-8, Page 39 in the PMBOK Guide
61.
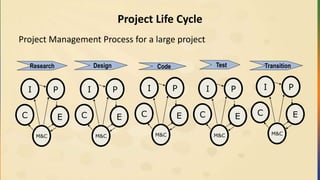
Project Life Cycle
ProjectManagement Process for a large project
Research Design TestCode Transition
I P
E
M&C
C
I P
E
M&C
C
I P
E
M&C
C
I P
E
M&C
C
I P
E
M&C
C
62.
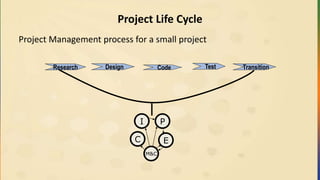
Project Life Cycle
ProjectManagement process for a small project
Research Design TestCode Transition
I P
E
M&C
C
63.
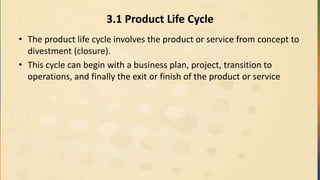
3.1 Product LifeCycle
• The product life cycle involves the product or service from concept to
divestment (closure).
• This cycle can begin with a business plan, project, transition to
operations, and finally the exit or finish of the product or service
64.
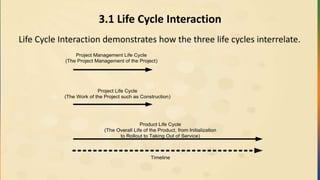
3.1 Life CycleInteraction
Life Cycle Interaction demonstrates how the three life cycles interrelate.
Project Management Life Cycle
(The Project Management of the Project)
Project Life Cycle
(The Work of the Project such as Construction)
Product Life Cycle
(The Overall Life of the Product, from Initialization
to Rollout to Taking Out of Service)
Timeline
65.
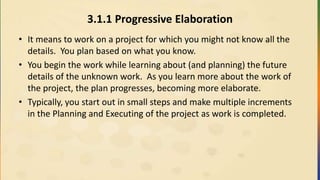
3.1.1 Progressive Elaboration
•It means to work on a project for which you might not know all the
details. You plan based on what you know.
• You begin the work while learning about (and planning) the future
details of the unknown work. As you learn more about the work of
the project, the plan progresses, becoming more elaborate.
• Typically, you start out in small steps and make multiple increments
in the Planning and Executing of the project as work is completed.
66.
3.1.2 Project
A Project:
•Has a specific purpose
• Creates specific results
• Has definite start and finish dates
• Is temporary
• Could be progressively elaborated as more is learned about the
project details
• could occur as a result of a business opportunity or market need,
which could have a limited time window.
67.
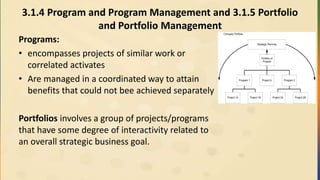
3.1.4 Program andProgram Management and 3.1.5 Portfolio
and Portfolio Management
Programs:
• encompasses projects of similar work or
correlated activates
• Are managed in a coordinated way to attain
benefits that could not bee achieved separately
Portfolios involves a group of projects/programs
that have some degree of interactivity related to
an overall strategic business goal.
Portfolio of
Projects
Project 2A Project 2B
Program 2Project AProgram 1
Project 1A Project 1B
Company Portfolio
Strategic Planning
68.
3.1.6 Strategic Planning
•Strategic planning is a practice by which a company looks into the future
for products or services it must have, typically three to five years in the
future.
• Projects are the tools that the company will use to implement these
strategic goals, because the operations of the company typically
encompass the day-to-day (repeatable) activities.
• Thus, when the strategic goals are complete, they roll into the operations
of the company.
• Projects can be created as a result of market demand, legal needs,
technology updates, and customer or organizational needs.
• PMI has a tool and methodology approach called OPM3 (Organizational
Project Management Maturity Model) for aligning a company’s goals and
strategic planning to project management.
69.
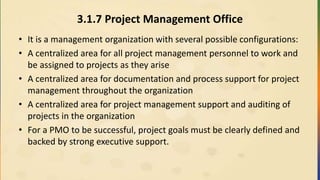
3.1.7 Project ManagementOffice
• It is a management organization with several possible configurations:
• A centralized area for all project management personnel to work and
be assigned to projects as they arise
• A centralized area for documentation and process support for project
management throughout the organization
• A centralized area for project management support and auditing of
projects in the organization
• For a PMO to be successful, project goals must be clearly defined and
backed by strong executive support.
70.
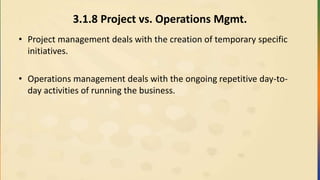
3.1.8 Project vs.Operations Mgmt.
• Project management deals with the creation of temporary specific
initiatives.
• Operations management deals with the ongoing repetitive day-to-
day activities of running the business.
71.
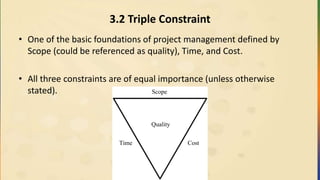
3.2 Triple Constraint
•One of the basic foundations of project management defined by
Scope (could be referenced as quality), Time, and Cost.
• All three constraints are of equal importance (unless otherwise
stated).
Quality
Scope
Time Cost
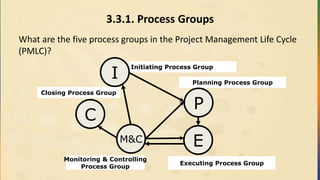
3.3.1. Process Groups
Whatare the five process groups in the Project Management Life Cycle
(PMLC)?
Planning Process Group
Executing Process Group
Monitoring & Controlling
Process Group
Initiating Process Group
Closing Process Group
I
P
EM&C
C
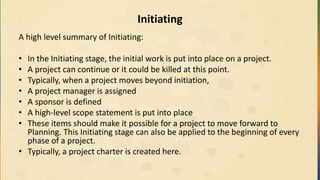
Initiating
A high levelsummary of Initiating:
• In the Initiating stage, the initial work is put into place on a project.
• A project can continue or it could be killed at this point.
• Typically, when a project moves beyond initiation,
• A project manager is assigned
• A sponsor is defined
• A high-level scope statement is put into place
• These items should make it possible for a project to move forward to
Planning. This Initiating stage can also be applied to the beginning of every
phase of a project.
• Typically, a project charter is created here.
77.
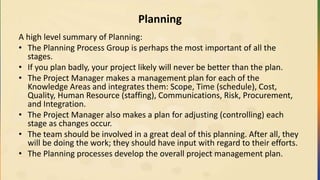
Planning
A high levelsummary of Planning:
• The Planning Process Group is perhaps the most important of all the
stages.
• If you plan badly, your project likely will never be better than the plan.
• The Project Manager makes a management plan for each of the
Knowledge Areas and integrates them: Scope, Time (schedule), Cost,
Quality, Human Resource (staffing), Communications, Risk, Procurement,
and Integration.
• The Project Manager also makes a plan for adjusting (controlling) each
stage as changes occur.
• The team should be involved in a great deal of this planning. After all, they
will be doing the work; they should have input with regard to their efforts.
• The Planning processes develop the overall project management plan.
78.
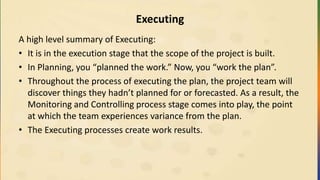
Executing
A high levelsummary of Executing:
• It is in the execution stage that the scope of the project is built.
• In Planning, you “planned the work.” Now, you “work the plan”.
• Throughout the process of executing the plan, the project team will
discover things they hadn’t planned for or forecasted. As a result, the
Monitoring and Controlling process stage comes into play, the point
at which the team experiences variance from the plan.
• The Executing processes create work results.
79.
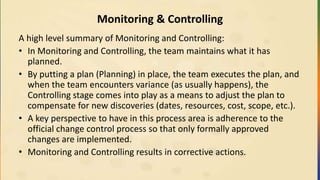
Monitoring & Controlling
Ahigh level summary of Monitoring and Controlling:
• In Monitoring and Controlling, the team maintains what it has
planned.
• By putting a plan (Planning) in place, the team executes the plan, and
when the team encounters variance (as usually happens), the
Controlling stage comes into play as a means to adjust the plan to
compensate for new discoveries (dates, resources, cost, scope, etc.).
• A key perspective to have in this process area is adherence to the
official change control process so that only formally approved
changes are implemented.
• Monitoring and Controlling results in corrective actions.
80.
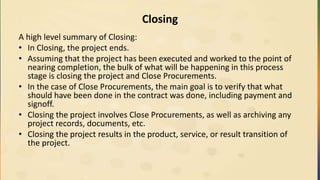
Closing
A high levelsummary of Closing:
• In Closing, the project ends.
• Assuming that the project has been executed and worked to the point of
nearing completion, the bulk of what will be happening in this process
stage is closing the project and Close Procurements.
• In the case of Close Procurements, the main goal is to verify that what
should have been done in the contract was done, including payment and
signoff.
• Closing the project involves Close Procurements, as well as archiving any
project records, documents, etc.
• Closing the project results in the product, service, or result transition of
the project.
81.
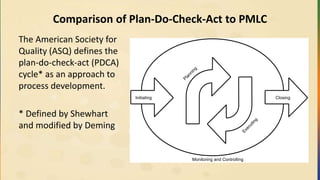
Comparison of Plan-Do-Check-Actto PMLC
The American Society for
Quality (ASQ) defines the
plan-do-check-act (PDCA)
cycle* as an approach to
process development.
* Defined by Shewhart
and modified by Deming
Monitoring and Controlling
Initiating Closing
Planning
Executing
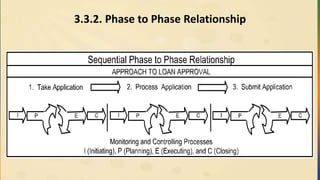
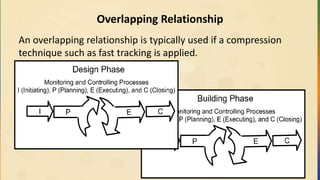
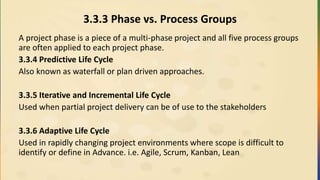
3.3.3 Phase vs.Process Groups
A project phase is a piece of a multi-phase project and all five process groups
are often applied to each project phase.
3.3.4 Predictive Life Cycle
Also known as waterfall or plan driven approaches.
3.3.5 Iterative and Incremental Life Cycle
Used when partial project delivery can be of use to the stakeholders
3.3.6 Adaptive Life Cycle
Used in rapidly changing project environments where scope is difficult to
identify or define in Advance. i.e. Agile, Scrum, Kanban, Lean
85.
3.3.7 Phase Gate
•A review process undertaken to determine if a project is likely to
succeed
• At the end of a program or project phase, an authorized group
reviews the work of the phase and either approves to continue the
project or makes the decision to stop future work on the initiative
• Projects that are not likely to succeed are “killed” early
• Can also be called “kill point”
86.
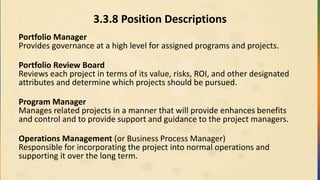
3.3.8 Position Descriptions
PortfolioManager
Provides governance at a high level for assigned programs and projects.
Portfolio Review Board
Reviews each project in terms of its value, risks, ROI, and other designated
attributes and determine which projects should be pursued.
Program Manager
Manages related projects in a manner that will provide enhances benefits
and control and to provide support and guidance to the project managers.
Operations Management (or Business Process Manager)
Responsible for incorporating the project into normal operations and
supporting it over the long term.
87.
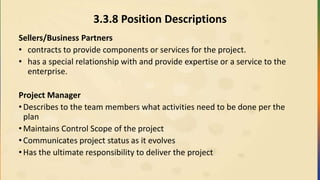
3.3.8 Position Descriptions
Sellers/BusinessPartners
• contracts to provide components or services for the project.
• has a special relationship with and provide expertise or a service to the
enterprise.
Project Manager
• Describes to the team members what activities need to be done per the
plan
• Maintains Control Scope of the project
• Communicates project status as it evolves
• Has the ultimate responsibility to deliver the project
88.
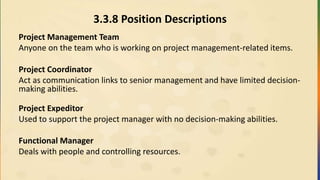
3.3.8 Position Descriptions
ProjectManagement Team
Anyone on the team who is working on project management-related items.
Project Coordinator
Act as communication links to senior management and have limited decision-
making abilities.
Project Expeditor
Used to support the project manager with no decision-making abilities.
Functional Manager
Deals with people and controlling resources.
89.
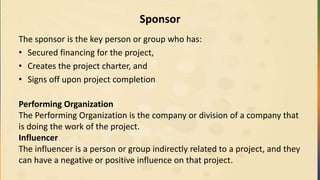
Sponsor
The sponsor isthe key person or group who has:
• Secured financing for the project,
• Creates the project charter, and
• Signs off upon project completion
Performing Organization
The Performing Organization is the company or division of a company that
is doing the work of the project.
Influencer
The influencer is a person or group indirectly related to a project, and they
can have a negative or positive influence on that project.
90.
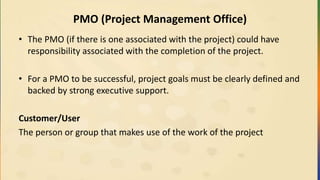
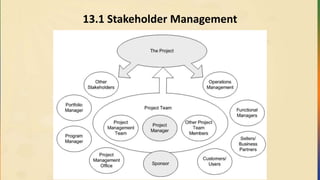
PMO (Project ManagementOffice)
• The PMO (if there is one associated with the project) could have
responsibility associated with the completion of the project.
• For a PMO to be successful, project goals must be clearly defined and
backed by strong executive support.
Customer/User
The person or group that makes use of the work of the project
Stakeholders
Anyone actively involvedin, or anyone that can be impacted (negatively
or positively) by the project.
Project Team Members
Responsible for doing the work that goes toward meeting the scope of
the project.
Stakeholder Management
•Provide appropriate input and contribution as the project evolves.
•Stakeholder sign off and formal acceptance during closure.
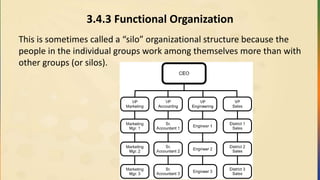
3.4.3 Functional Organization
Thisis sometimes called a “silo” organizational structure because the
people in the individual groups work among themselves more than with
other groups (or silos).
95.
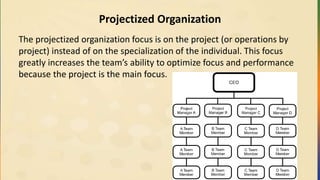
Projectized Organization
The projectizedorganization focus is on the project (or operations by
project) instead of on the specialization of the individual. This focus
greatly increases the team’s ability to optimize focus and performance
because the project is the main focus.
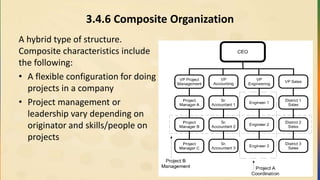
3.4.6 Composite Organization
Ahybrid type of structure.
Composite characteristics include
the following:
• A flexible configuration for doing
projects in a company
• Project management or
leadership vary depending on
originator and skills/people on
projects
98.
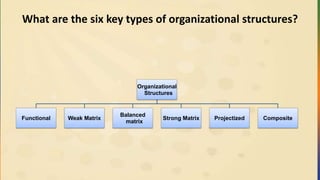
What are thesix key types of organizational structures?
Organizational
Structures
Functional Weak Matrix
Balanced
matrix
Strong Matrix Projectized Composite
99.
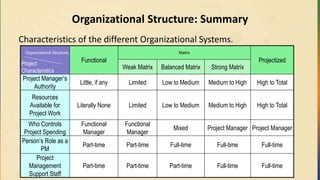
Organizational Structure: Summary
Characteristicsof the different Organizational Systems.
Organizational Structure
Functional
Matrix
ProjectizedProject
Characteristics
Weak Matrix Balanced Matrix Strong Matrix
Project Manager’s
Authority
Little, if any Limited Low to Medium Medium to High High to Total
Resources
Available for
Project Work
Literally None Limited Low to Medium Medium to High High to Total
Who Controls
Project Spending
Functional
Manager
Functional
Manager
Mixed Project Manager Project Manager
Person’s Role as a
PM
Part-time Part-time Full-time Full-time Full-time
Project
Management
Support Staff
Part-time Part-time Part-time Full-time Full-time
100.
Exercises
• As ateam, Do Framework Terminology Matching Exercise – page 53-
54
• Individually, Do Framework Practice Test – Do only 10 questions
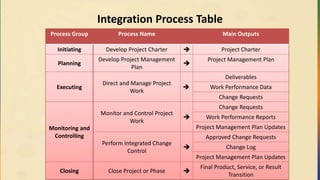
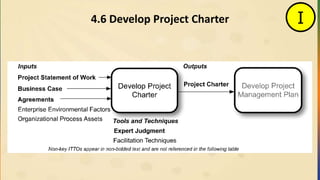
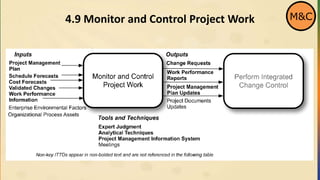
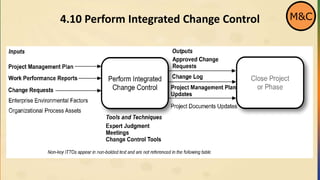
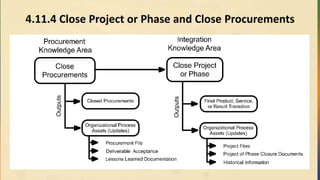
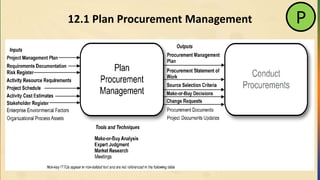
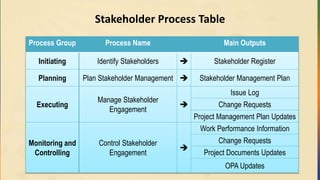
Integration Process Table
ProcessGroup Process Name Main Outputs
Initiating Develop Project Charter Project Charter
Planning
Develop Project Management
Plan
Project Management Plan
Executing
Direct and Manage Project
Work
Deliverables
Work Performance Data
Change Requests
Monitoring and
Controlling
Monitor and Control Project
Work
Change Requests
Work Performance Reports
Project Management Plan Updates
Perform Integrated Change
Control
Approved Change Requests
Change Log
Project Management Plan Updates
Closing Close Project or Phase
Final Product, Service, or Result
Transition
103.
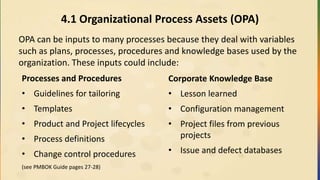
4.1 Organizational ProcessAssets (OPA)
OPA can be inputs to many processes because they deal with variables
such as plans, processes, procedures and knowledge bases used by the
organization. These inputs could include:
Processes and Procedures
• Guidelines for tailoring
• Templates
• Product and Project lifecycles
• Process definitions
• Change control procedures
(see PMBOK Guide pages 27-28)
Corporate Knowledge Base
• Lesson learned
• Configuration management
• Project files from previous
projects
• Issue and defect databases
104.
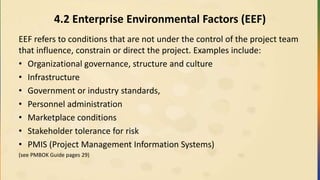
4.2 Enterprise EnvironmentalFactors (EEF)
EEF refers to conditions that are not under the control of the project team
that influence, constrain or direct the project. Examples include:
• Organizational governance, structure and culture
• Infrastructure
• Government or industry standards,
• Personnel administration
• Marketplace conditions
• Stakeholder tolerance for risk
• PMIS (Project Management Information Systems)
(see PMBOK Guide pages 29)
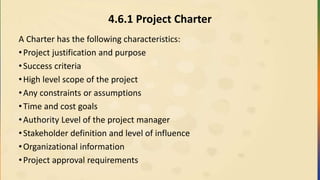
4.6.1 Project Charter
ACharter has the following characteristics:
•Project justification and purpose
•Success criteria
•High level scope of the project
•Any constraints or assumptions
•Time and cost goals
•Authority Level of the project manager
•Stakeholder definition and level of influence
•Organizational information
•Project approval requirements
107.
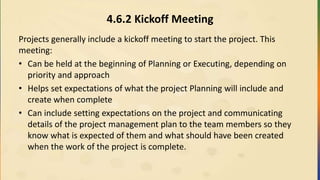
4.6.2 Kickoff Meeting
Projectsgenerally include a kickoff meeting to start the project. This
meeting:
• Can be held at the beginning of Planning or Executing, depending on
priority and approach
• Helps set expectations of what the project Planning will include and
create when complete
• Can include setting expectations on the project and communicating
details of the project management plan to the team members so they
know what is expected of them and what should have been created
when the work of the project is complete.
108.
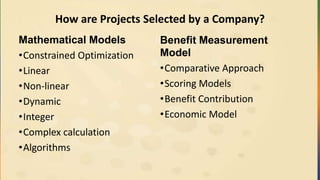
How are ProjectsSelected by a Company?
Mathematical Models
•Constrained Optimization
•Linear
•Non-linear
•Dynamic
•Integer
•Complex calculation
•Algorithms
Benefit Measurement
Model
•Comparative Approach
•Scoring Models
•Benefit Contribution
•Economic Model
109.
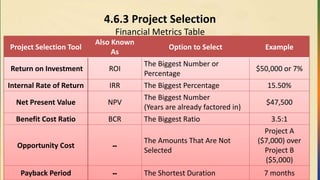
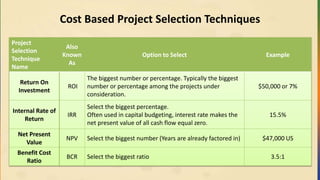
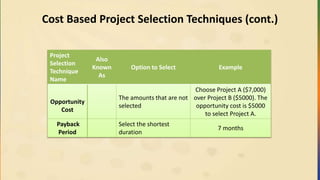
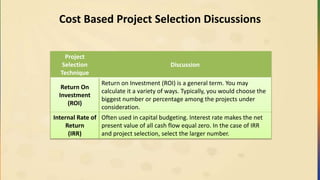
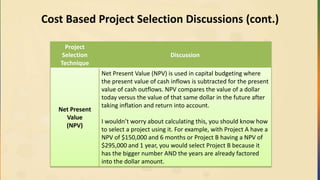
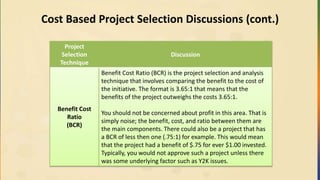
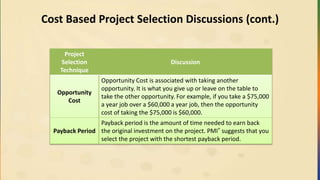
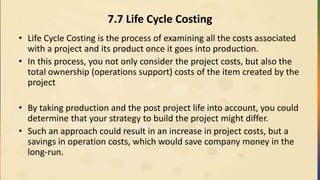
4.6.3 Project Selection
FinancialMetrics Table
Project Selection Tool
Also Known
As
Option to Select Example
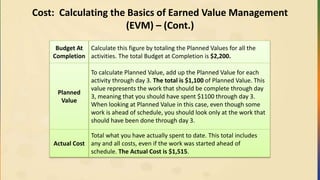
Return on Investment ROI
The Biggest Number or
Percentage
$50,000 or 7%
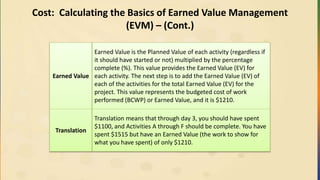
Internal Rate of Return IRR The Biggest Percentage 15.50%
Net Present Value NPV
The Biggest Number
(Years are already factored in)
$47,500
Benefit Cost Ratio BCR The Biggest Ratio 3.5:1
Opportunity Cost --
The Amounts That Are Not
Selected
Project A
($7,000) over
Project B
($5,000)
Payback Period -- The Shortest Duration 7 months
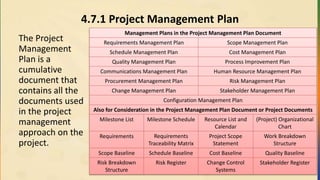
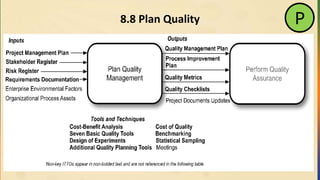
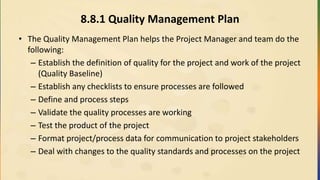
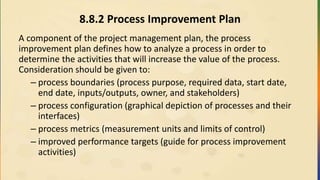
4.7.1 Project ManagementPlan
The Project
Management
Plan is a
cumulative
document that
contains all the
documents used
in the project
management
approach on the
project.
Management Plans in the Project Management Plan Document
Requirements Management Plan Scope Management Plan
Schedule Management Plan Cost Management Plan
Quality Management Plan Process Improvement Plan
Communications Management Plan Human Resource Management Plan
Procurement Management Plan Risk Management Plan
Change Management Plan Stakeholder Management Plan
Configuration Management Plan
Also for Consideration in the Project Management Plan Document or Project Documents
Milestone List Milestone Schedule Resource List and
Calendar
(Project) Organizational
Chart
Requirements Requirements
Traceability Matrix
Project Scope
Statement
Work Breakdown
Structure
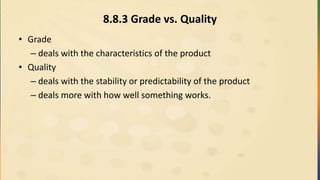
Scope Baseline Schedule Baseline Cost Baseline Quality Baseline
Risk Breakdown
Structure
Risk Register Change Control
Systems
Stakeholder Register
112.
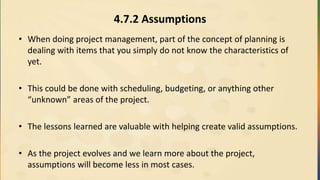
4.7.2 Assumptions
• Whendoing project management, part of the concept of planning is
dealing with items that you simply do not know the characteristics of
yet.
• This could be done with scheduling, budgeting, or anything other
“unknown” areas of the project.
• The lessons learned are valuable with helping create valid assumptions.
• As the project evolves and we learn more about the project,
assumptions will become less in most cases.
113.
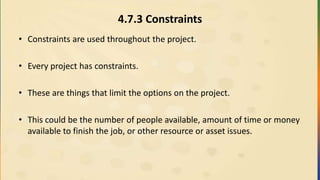
4.7.3 Constraints
• Constraintsare used throughout the project.
• Every project has constraints.
• These are things that limit the options on the project.
• This could be the number of people available, amount of time or money
available to finish the job, or other resource or asset issues.
114.
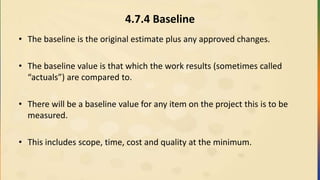
4.7.4 Baseline
• Thebaseline is the original estimate plus any approved changes.
• The baseline value is that which the work results (sometimes called
“actuals”) are compared to.
• There will be a baseline value for any item on the project this is to be
measured.
• This includes scope, time, cost and quality at the minimum.
115.
4.7.5 Project ManagementInformation System (PMIS)
• The Project Management Information System is used for
communication and Distribute Information on the project.
• It is not necessarily a high tech system, but whatever is used for
communication on the project.
• Normally, it is a mixture of technology and non-technology tools used
by various people on the project.
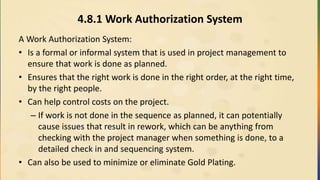
4.8.1 Work AuthorizationSystem
A Work Authorization System:
• Is a formal or informal system that is used in project management to
ensure that work is done as planned.
• Ensures that the right work is done in the right order, at the right time,
by the right people.
• Can help control costs on the project.
– If work is not done in the sequence as planned, it can potentially
cause issues that result in rework, which can be anything from
checking with the project manager when something is done, to a
detailed check in and sequencing system.
• Can also be used to minimize or eliminate Gold Plating.
118.
4.8.2 The ProjectManager’s Role in Integration
• Project Managers start with planning because they are responsible for
pulling together all the various people for the planning and completion
of the project plan as all the documents are integrated into the project
plan.
• Project Managers are also responsible for project integration while
various project pieces come together for plan completion.
• Project Managers must be sensitive to the project’s needs, especially at
key interface points on the project.
4.10.1 Requested ChangesVs. Approved Changes
• In situational questions, a requested change typically isn’t considered as
approved unless stated so. It’s important to explain the impact of
requested changes to the authorized requestor or sponsor and let that
person make the call on approving the changes based on the impact.
Unless it’s a situation like that, a requested change is simply a wish list,
not likely to impact the outcome of the situation.
• Approved changes are those that have been through the Change
Control System and approved; they are now part of the project with
any impact changes potentially had now affecting the project.
122.
4.10.2 Change ControlSystem
• A Change Control System is a documented, formal process that
manages the change of project documentation. It is also used to assess
the impact and consequences of requested changes on the project. A
change is requested, analyzed for impact and consequences, and
typically either approved or rejected.
• An overall change control system can address a variety of areas on the
project. If the Change Control System is for a specific knowledge area
such as scope or cost, it typically addresses only that area, and usually
no others.
123.
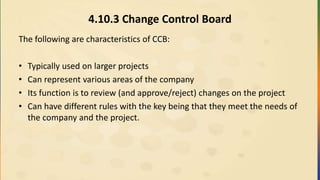
4.10.3 Change ControlBoard
The following are characteristics of CCB:
• Typically used on larger projects
• Can represent various areas of the company
• Its function is to review (and approve/reject) changes on the project
• Can have different rules with the key being that they meet the needs of
the company and the project.
124.
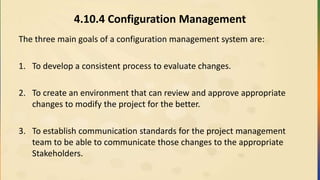
4.10.4 Configuration Management
Thethree main goals of a configuration management system are:
1. To develop a consistent process to evaluate changes.
2. To create an environment that can review and approve appropriate
changes to modify the project for the better.
3. To establish communication standards for the project management
team to be able to communicate those changes to the appropriate
Stakeholders.
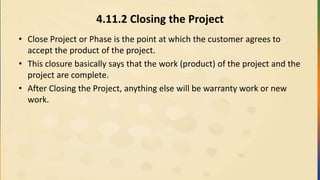
4.11.2 Closing theProject
• Close Project or Phase is the point at which the customer agrees to
accept the product of the project.
• This closure basically says that the work (product) of the project and the
project are complete.
• After Closing the Project, anything else will be warranty work or new
work.
127.
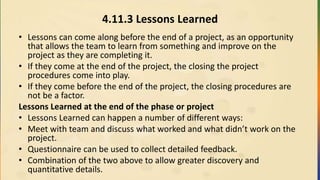
4.11.3 Lessons Learned
•Lessons can come along before the end of a project, as an opportunity
that allows the team to learn from something and improve on the
project as they are completing it.
• If they come at the end of the project, the closing the project
procedures come into play.
• If they come before the end of the project, the closing procedures are
not be a factor.
Lessons Learned at the end of the phase or project
• Lessons Learned can happen a number of different ways:
• Meet with team and discuss what worked and what didn’t work on the
project.
• Questionnaire can be used to collect detailed feedback.
• Combination of the two above to allow greater discovery and
quantitative details.
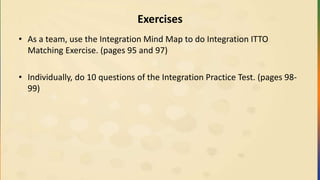
Exercises
• As ateam, use the Integration Mind Map to do Integration ITTO
Matching Exercise. (pages 95 and 97)
• Individually, do 10 questions of the Integration Practice Test. (pages 98-
99)
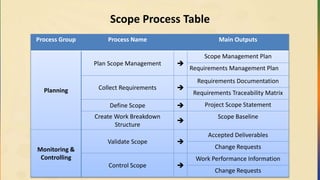
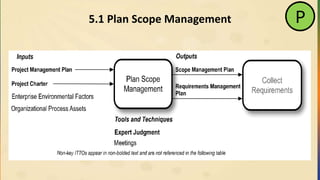
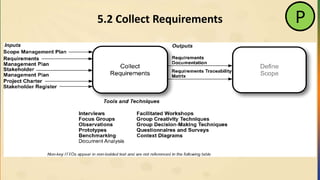
5.1.1 Scope ManagementPlan
It may include the methods that will be used to:
•Create a scope statement
•Create a WBS
•Validate project deliverables
•Address scope change requests
134.
5.1.2 Requirements ManagementPlan
The requirements management plan helps the Project Manager and team
analyze, document, and manage the project requirements.
• The plan may include:
– Direction for planning, tracking, and reporting requirement activities
– Direction for configuration management activities notably how to
initiate changes to the product, service, or result, how to analyze the
impact of the changes, and change approval authorization
– Direction for prioritizing requirements
– Direction for determining product metrics and usage rational
– Direction for the traceability matrix, specifically the requirement
attributes to be included in the matrix and the other project document
to which the requirements will be traced
Team Exercise
Directions:
• Reviewthe definitions of each of the each of the Key Tools and
Techniques in the Crosswind PM book (pages 120-121)
• Create a creative team mnemonic to help you remember the tools
and techniques.
• The team with the most creative mnemonic wins!
137.
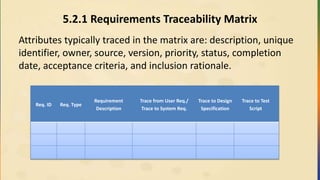
5.2.1 Requirements TraceabilityMatrix
Attributes typically traced in the matrix are: description, unique
identifier, owner, source, version, priority, status, completion
date, acceptance criteria, and inclusion rationale.
Req. ID Req. Type
Requirement
Description
Trace from User Req./
Trace to System Req.
Trace to Design
Specification
Trace to Test
Script
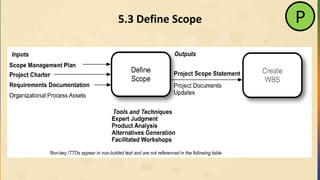
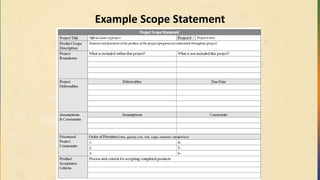
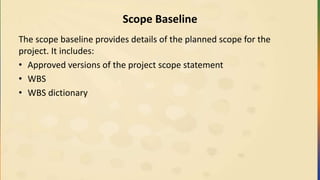
Scope Baseline
The scopebaseline provides details of the planned scope for the
project. It includes:
• Approved versions of the project scope statement
• WBS
• WBS dictionary
142.
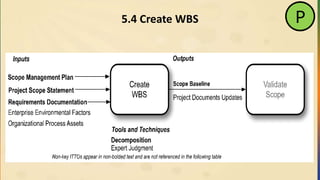
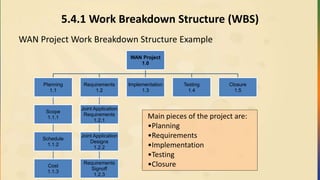
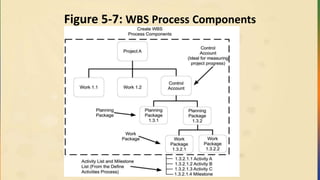
5.4.1 Work BreakdownStructure (WBS)
WAN Project Work Breakdown Structure Example
WAN Project
1.0
Planning
1.1
Scope
1.1.1
Schedule
1.1.2
Cost
1.1.3
Requirements
1.2
Joint Application
Requirements
1.2.1
Joint Application
Designs
1.2.2
Requirements
Signoff
1.2.3
Implementation
1.3
Testing
1.4
Closure
1.5
Main pieces of the project are:
•Planning
•Requirements
•Implementation
•Testing
•Closure
5.4.2 100% Rule
The100% Rule states that 100% of the work of a project (or program)
needs to be represented in the creation of the WBS.
• For example, if there are testing activities or meetings and
administrative work associated with a project, the 100% rule would
require that all testing and administrative work be included in the
WBS. If not, the estimates related to time, money, staff, etc. will be
off track by at least the amount of work that is missing in the WBS.
145.
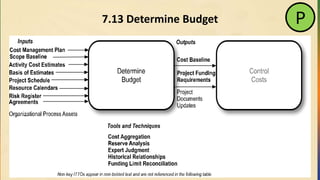
5.4.3 WBS Numbering
Workbreakdown structure numbering lets project team members
know where work fits in the project. Look inside the PMBOK Guide and
notice the WBS numbering system.
For example, 7.0 is the Cost chapter. 7.1 Plan Cost Management, 7.2
Estimate Costs, and 7.3 Determine Budget are elements of the Cost
chapter. In addition, each element has sub-elements that are
numbered. 7.1.1, 7.1.2, and 7.1.3 are sub-elements of 7.1. Ultimately,
all of these pieces detail the cost of the project.
146.
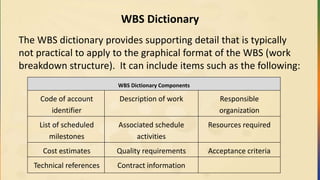
WBS Dictionary
The WBSdictionary provides supporting detail that is typically
not practical to apply to the graphical format of the WBS (work
breakdown structure). It can include items such as the following:
WBS Dictionary Components
Code of account
identifier
Description of work Responsible
organization
List of scheduled
milestones
Associated schedule
activities
Resources required
Cost estimates Quality requirements Acceptance criteria
Technical references Contract information
147.
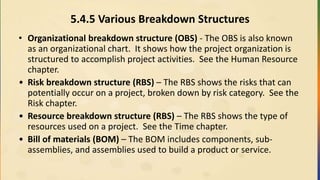
5.4.5 Various BreakdownStructures
• Organizational breakdown structure (OBS) - The OBS is also known
as an organizational chart. It shows how the project organization is
structured to accomplish project activities. See the Human Resource
chapter.
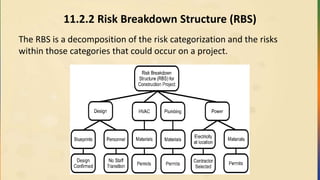
• Risk breakdown structure (RBS) – The RBS shows the risks that can
potentially occur on a project, broken down by risk category. See the
Risk chapter.
• Resource breakdown structure (RBS) – The RBS shows the type of
resources used on a project. See the Time chapter.
• Bill of materials (BOM) – The BOM includes components, sub-
assemblies, and assemblies used to build a product or service.
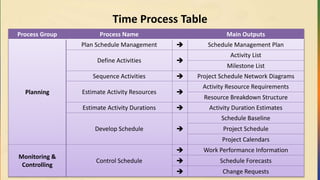
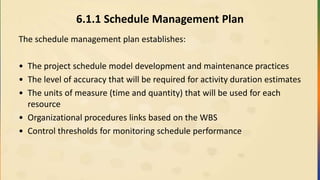
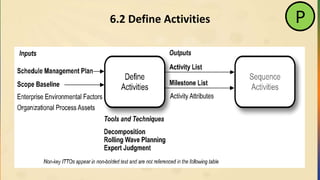
6.1.1 Schedule ManagementPlan
The schedule management plan establishes:
• The project schedule model development and maintenance practices
• The level of accuracy that will be required for activity duration estimates
• The units of measure (time and quantity) that will be used for each
resource
• Organizational procedures links based on the WBS
• Control thresholds for monitoring schedule performance
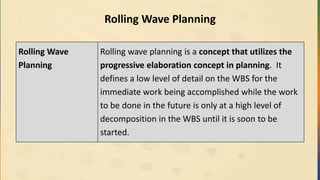
Rolling Wave Planning
RollingWave
Planning
Rolling wave planning is a concept that utilizes the
progressive elaboration concept in planning. It
defines a low level of detail on the WBS for the
immediate work being accomplished while the work
to be done in the future is only at a high level of
decomposition in the WBS until it is soon to be
started.
157.
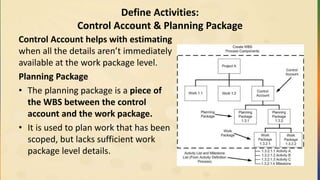
Define Activities:
Control Account& Planning Package
Control Account helps with estimating
when all the details aren’t immediately
available at the work package level.
Planning Package
• The planning package is a piece of
the WBS between the control
account and the work package.
• It is used to plan work that has been
scoped, but lacks sufficient work
package level details.
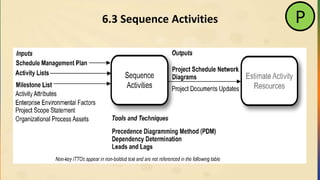
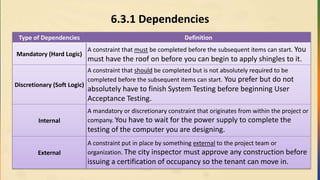
6.3.1 Dependencies
Type ofDependencies Definition
Mandatory (Hard Logic)
A constraint that must be completed before the subsequent items can start. You
must have the roof on before you can begin to apply shingles to it.
Discretionary (Soft Logic)
A constraint that should be completed but is not absolutely required to be
completed before the subsequent items can start. You prefer but do not
absolutely have to finish System Testing before beginning User
Acceptance Testing.
Internal
A mandatory or discretionary constraint that originates from within the project or
company. You have to wait for the power supply to complete the
testing of the computer you are designing.
External
A constraint put in place by something external to the project team or
organization. The city inspector must approve any construction before
issuing a certification of occupancy so the tenant can move in.
160.
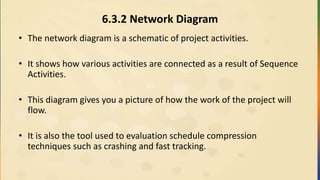
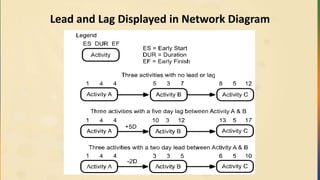
6.3.2 Network Diagram
•The network diagram is a schematic of project activities.
• It shows how various activities are connected as a result of Sequence
Activities.
• This diagram gives you a picture of how the work of the project will
flow.
• It is also the tool used to evaluation schedule compression
techniques such as crashing and fast tracking.
161.
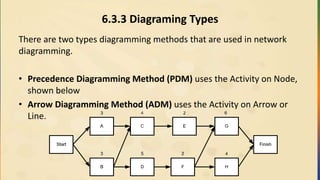
6.3.3 Diagraming Types
Thereare two types diagramming methods that are used in network
diagramming.
• Precedence Diagramming Method (PDM) uses the Activity on Node,
shown below
• Arrow Diagramming Method (ADM) uses the Activity on Arrow or
Line.
162.
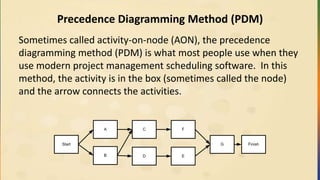
Precedence Diagramming Method(PDM)
Sometimes called activity-on-node (AON), the precedence
diagramming method (PDM) is what most people use when they
use modern project management scheduling software. In this
method, the activity is in the box (sometimes called the node)
and the arrow connects the activities.
B D
Start
CA
E
F
G Finish
163.
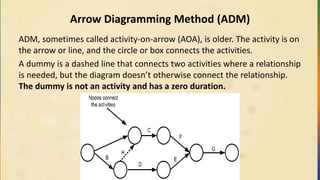
Arrow Diagramming Method(ADM)
ADM, sometimes called activity-on-arrow (AOA), is older. The activity is on
the arrow or line, and the circle or box connects the activities.
A dummy is a dashed line that connects two activities where a relationship
is needed, but the diagram doesn’t otherwise connect the relationship.
The dummy is not an activity and has a zero duration.
164.
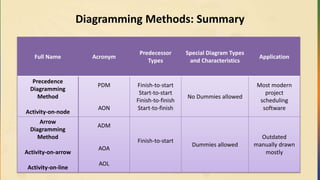
Diagramming Methods: Summary
FullName Acronym
Predecessor
Types
Special Diagram Types
and Characteristics
Application
Precedence
Diagramming
Method
Activity-on-node
PDM
AON
Finish-to-start
Start-to-start
Finish-to-finish
Start-to-finish
No Dummies allowed
Most modern
project
scheduling
software
Arrow
Diagramming
Method
Activity-on-arrow
Activity-on-line
ADM
AOA
AOL
Finish-to-start
Dummies allowed
Outdated
manually drawn
mostly
165.
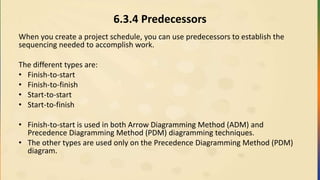
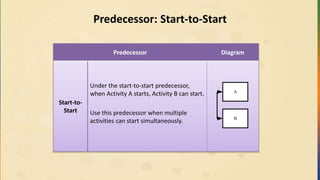
6.3.4 Predecessors
When youcreate a project schedule, you can use predecessors to establish the
sequencing needed to accomplish work.
The different types are:
• Finish-to-start
• Finish-to-finish
• Start-to-start
• Start-to-finish
• Finish-to-start is used in both Arrow Diagramming Method (ADM) and
Precedence Diagramming Method (PDM) diagramming techniques.
• The other types are used only on the Precedence Diagramming Method (PDM)
diagram.
166.
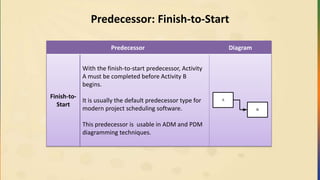
Predecessor: Finish-to-Start
Predecessor Diagram
Finish-to-
Start
Withthe finish-to-start predecessor, Activity
A must be completed before Activity B
begins.
It is usually the default predecessor type for
modern project scheduling software.
This predecessor is usable in ADM and PDM
diagramming techniques.
A
B
167.
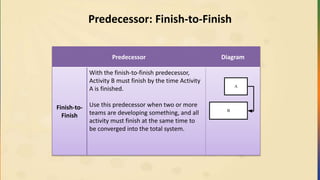
Predecessor: Finish-to-Finish
Predecessor Diagram
Finish-to-
Finish
Withthe finish-to-finish predecessor,
Activity B must finish by the time Activity
A is finished.
Use this predecessor when two or more
teams are developing something, and all
activity must finish at the same time to
be converged into the total system.
A
B
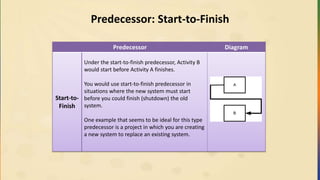
Predecessor: Start-to-Finish
Predecessor Diagram
Start-to-
Finish
Underthe start-to-finish predecessor, Activity B
would start before Activity A finishes.
You would use start-to-finish predecessor in
situations where the new system must start
before you could finish (shutdown) the old
system.
One example that seems to be ideal for this type
predecessor is a project in which you are creating
a new system to replace an existing system.
170.
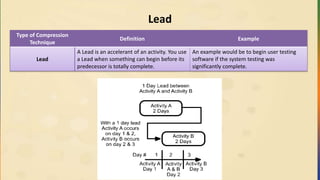
Lead
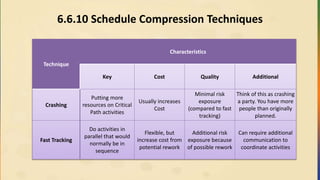
Type of Compression
Technique
DefinitionExample
Lead
A Lead is an accelerant of an activity. You use
a Lead when something can begin before its
predecessor is totally complete.
An example would be to begin user testing
software if the system testing was
significantly complete.
171.
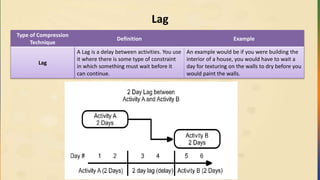
Lag
Type of Compression
Technique
DefinitionExample
Lag
A Lag is a delay between activities. You use
it where there is some type of constraint
in which something must wait before it
can continue.
An example would be if you were building the
interior of a house, you would have to wait a
day for texturing on the walls to dry before you
would paint the walls.
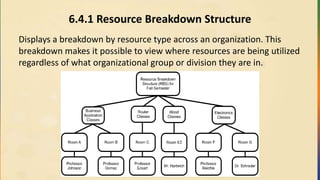
6.4.1 Resource BreakdownStructure
Displays a breakdown by resource type across an organization. This
breakdown makes it possible to view where resources are being utilized
regardless of what organizational group or division they are in.
175.
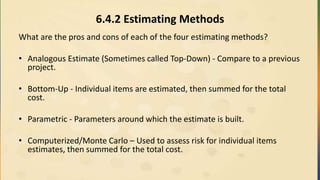
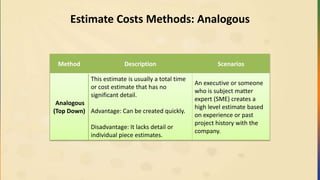
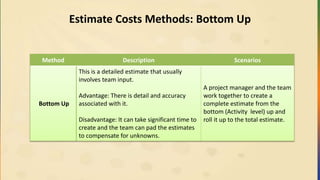
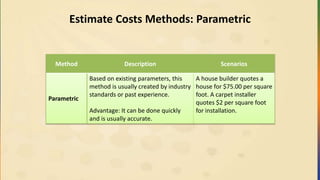
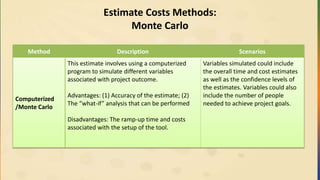
6.4.2 Estimating Methods
Whatare the pros and cons of each of the four estimating methods?
• Analogous Estimate (Sometimes called Top-Down) - Compare to a previous
project.
• Bottom-Up - Individual items are estimated, then summed for the total
cost.
• Parametric - Parameters around which the estimate is built.
• Computerized/Monte Carlo – Used to assess risk for individual items
estimates, then summed for the total cost.
176.
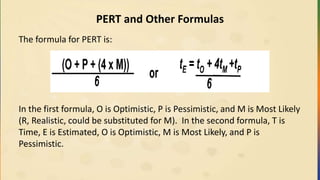
PERT and OtherFormulas
The formula for PERT is:
In the first formula, O is Optimistic, P is Pessimistic, and M is Most Likely
(R, Realistic, could be substituted for M). In the second formula, T is
Time, E is Estimated, O is Optimistic, M is Most Likely, and P is
Pessimistic.
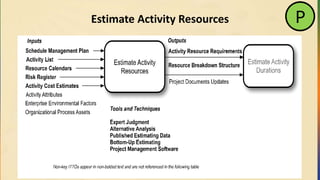
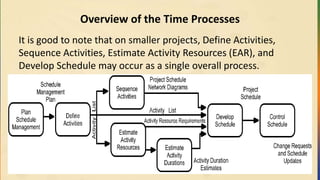
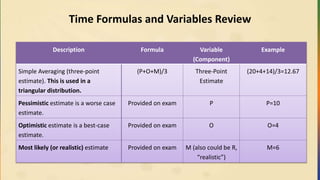
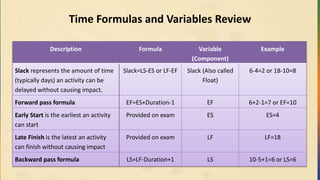
Overview of theTime Processes
It is good to note that on smaller projects, Define Activities,
Sequence Activities, Estimate Activity Resources (EAR), and
Develop Schedule may occur as a single overall process.
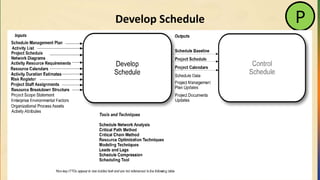
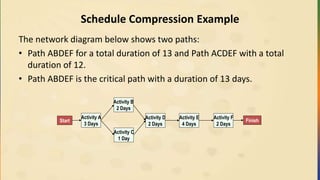
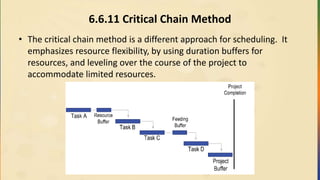
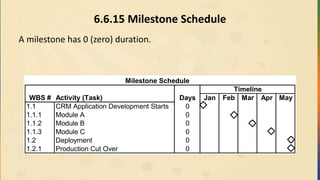
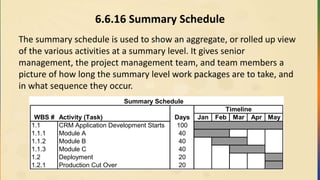
6.6.1 Schedule Examples
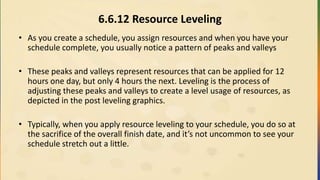
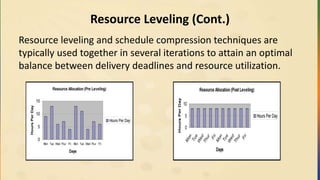
•There are a variety of schedule formats. The most common formats are
activity lists, bar charts, and network diagrams.
• Activity lists contain all required schedule activities for the project, an
identifier for each activity, and a rather detailed scope of work description
for each activity.
• Bar charts are an easy to read representation of schedule activities (bars)
and denote the start date, end date, and duration of each activity.
• Network diagrams are visual representations of network logic and
scheduling. Typically, the diagrams contain date information for critical
path activities and are formatted as activity-on-node or logic bar chart.
181.
6.6.2 Schedule Baseline
Aschedule baseline is a specific version of the project schedule that is
selected and approved by the project management team as the
baseline and includes baseline start and finish dates.
182.
6.6.3 Critical PathMethod (CPM)
CPM Pointers:
Used with scheduling environments where a:
– Forward Pass is used to establish the earliest the activities can start (ES)
and finish (EF)
– Backward Pass is used to establish the latest the activities can start (LS)
and finish (LF)
• Allows the calculation of the critical path and the amount of slack on each
activity
• Any activity on the critical path typically has zero slack
• A negative slack is possible if the project is behind schedule
• Activities on the critical path are the ones the Project Manager should put
more focus on
183.
6.6.4 Slack (AlsoKnown as Float)
Slack is the amount of time that an activity can slip or be delayed
without delaying the finish date of the project .
If an activity has no slack, it is on the critical path Negative or positive
float can also exist. This float is a scenario in which the
project’s actual finish date extends past a targeted finish date,
or the project’s actual finish date comes before the targeted
finish date.
184.
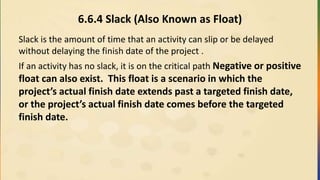
Slack (Also Knownas Float) – (Cont.)
If a project is scheduled to be done by the end of May and it
finishes two weeks early, there are two weeks of positive float.
In the same example, if it were to run two weeks over (without
approval of a new date), the project has two weeks of negative
float.
Slack Type Description
Free Slack
The amount of time that an activity can be delayed without delaying the successor activity. This is calculated
by subtracting EF+1 of the current activity from the ES of the successor activity.
Total Slack
It is the latest an activity can start without delaying the project finish date or violating a schedule constraint.
Total Slack (Float) does not get added together for the path, but float is shared across the path.
Project
Slack
The amount of time something can be delayed without delaying the published finish date. Note that it could
be different from what the project is privately anticipating.
185.
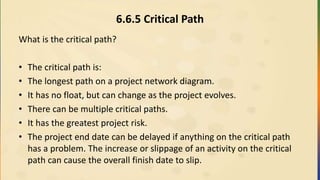
6.6.5 Critical Path
Whatis the critical path?
• The critical path is:
• The longest path on a project network diagram.
• It has no float, but can change as the project evolves.
• There can be multiple critical paths.
• It has the greatest project risk.
• The project end date can be delayed if anything on the critical path
has a problem. The increase or slippage of an activity on the critical
path can cause the overall finish date to slip.
186.
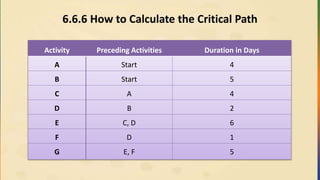
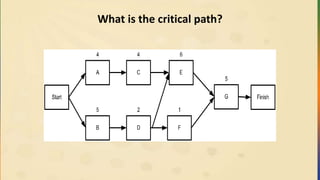
6.6.6 How toCalculate the Critical Path
Activity Preceding Activities Duration in Days
A Start 4
B Start 5
C A 4
D B 2
E C, D 6
F D 1
G E, F 5
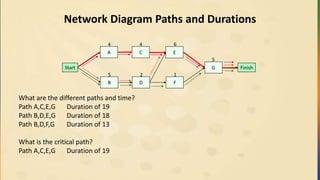
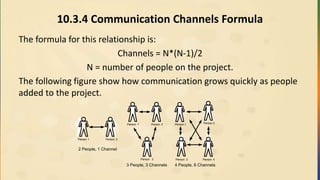
Network Diagram Pathsand Durations
What are the different paths and time?
Path A,C,E,G Duration of 19
Path B,D,E,G Duration of 18
Path B,D,F,G Duration of 13
What is the critical path?
Path A,C,E,G Duration of 19
Start
A
B
C
D
E
F
G Finish
4
5
4
2 1
6
5
189.
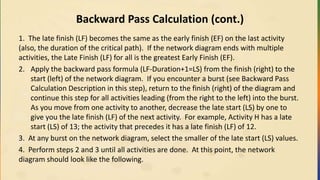
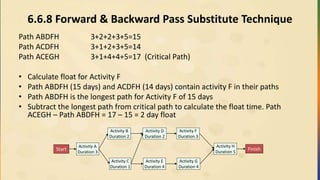
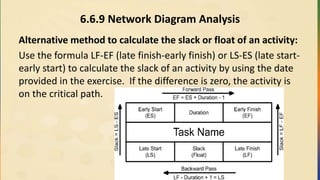
6.6.7 Forward andBackward Pass Calculation
A Forward and Backward Pass Calculation is a standard calculation
which:
• Is used to determine the Critical Path of the Network Diagram.
• Shows how much Slack (or Float) there is for an activity, which is the
amount of time an activity can slip before delaying the next activity.
• Shows how much total Slack there is, which is how much time an
activity can slip before it delays the project finish date.
190.
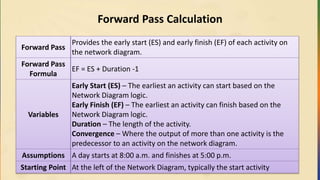
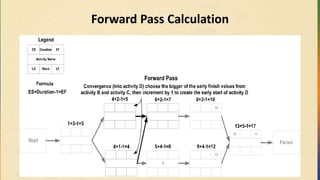
Forward Pass Calculation
ForwardPass
Provides the early start (ES) and early finish (EF) of each activity on
the network diagram.
Forward Pass
Formula
EF = ES + Duration -1
Variables
Early Start (ES) – The earliest an activity can start based on the
Network Diagram logic.
Early Finish (EF) – The earliest an activity can finish based on the
Network Diagram logic.
Duration – The length of the activity.
Convergence – Where the output of more than one activity is the
predecessor to an activity on the network diagram.
Assumptions A day starts at 8:00 a.m. and finishes at 5:00 p.m.
Starting Point At the left of the Network Diagram, typically the start activity
191.
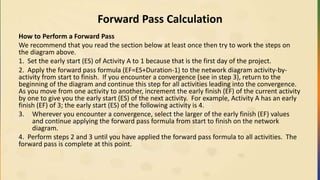
Forward Pass Calculation
Howto Perform a Forward Pass
We recommend that you read the section below at least once then try to work the steps on
the diagram above.
1. Set the early start (ES) of Activity A to 1 because that is the first day of the project.
2. Apply the forward pass formula (EF=ES+Duration-1) to the network diagram activity-by-
activity from start to finish. If you encounter a convergence (see in step 3), return to the
beginning of the diagram and continue this step for all activities leading into the convergence.
As you move from one activity to another, increment the early finish (EF) of the current activity
by one to give you the early start (ES) of the next activity. For example, Activity A has an early
finish (EF) of 3; the early start (ES) of the following activity is 4.
3. Wherever you encounter a convergence, select the larger of the early finish (EF) values
and continue applying the forward pass formula from start to finish on the network
diagram.
4. Perform steps 2 and 3 until you have applied the forward pass formula to all activities. The
forward pass is complete at this point.
Forward Pass Calculation
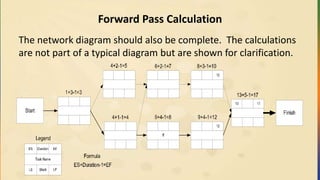
Thenetwork diagram should also be complete. The calculations
are not part of a typical diagram but are shown for clarification.
194.
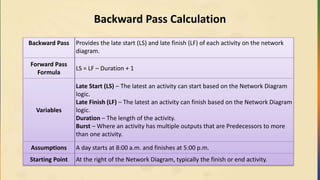
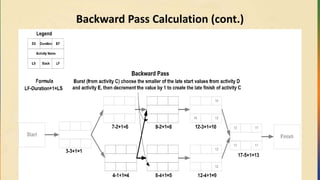
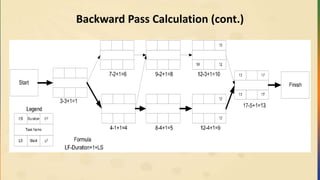
Backward Pass Calculation
BackwardPass Provides the late start (LS) and late finish (LF) of each activity on the network
diagram.
Forward Pass
Formula
LS = LF – Duration + 1
Variables
Late Start (LS) – The latest an activity can start based on the Network Diagram
logic.
Late Finish (LF) – The latest an activity can finish based on the Network Diagram
logic.
Duration – The length of the activity.
Burst – Where an activity has multiple outputs that are Predecessors to more
than one activity.
Assumptions A day starts at 8:00 a.m. and finishes at 5:00 p.m.
Starting Point At the right of the Network Diagram, typically the finish or end activity.
195.
Backward Pass Calculation(cont.)
1. The late finish (LF) becomes the same as the early finish (EF) on the last activity
(also, the duration of the critical path). If the network diagram ends with multiple
activities, the Late Finish (LF) for all is the greatest Early Finish (EF).
2. Apply the backward pass formula (LF-Duration+1=LS) from the finish (right) to the
start (left) of the network diagram. If you encounter a burst (see Backward Pass
Calculation Description in this step), return to the finish (right) of the diagram and
continue this step for all activities leading (from the right to the left) into the burst.
As you move from one activity to another, decrease the late start (LS) by one to
give you the late finish (LF) of the next activity. For example, Activity H has a late
start (LS) of 13; the activity that precedes it has a late finish (LF) of 12.
3. At any burst on the network diagram, select the smaller of the late start (LS) values.
4. Perform steps 2 and 3 until all activities are done. At this point, the network
diagram should look like the following.
6.6.8 Forward &Backward Pass Substitute Technique
Path ABDFH 3+2+2+3+5=15
Path ACDFH 3+1+2+3+5=14
Path ACEGH 3+1+4+4+5=17 (Critical Path)
• Calculate float for Activity F
• Path ABDFH (15 days) and ACDFH (14 days) contain activity F in their paths
• Path ABDFH is the longest path for Activity F of 15 days
• Subtract the longest path from critical path to calculate the float time. Path
ACEGH – Path ABDFH = 17 – 15 = 2 day float
Start
Activity B
Duration 2
Activity C
Duration 1
Activity D
Duration 2
Activity E
Duration 4
Activity F
Duration 3
Activity G
Duration 4
Activity H
Duration 5
Finish
Activity A
Duration 3
199.
6.6.9 Network DiagramAnalysis
Alternative method to calculate the slack or float of an activity:
Use the formula LF-EF (late finish-early finish) or LS-ES (late start-
early start) to calculate the slack of an activity by using the date
provided in the exercise. If the difference is zero, the activity is
on the critical path.
200.
6.6.10 Schedule CompressionTechniques
Technique
Characteristics
Key Cost Quality Additional
Crashing
Putting more
resources on Critical
Path activities
Usually increases
Cost
Minimal risk
exposure
(compared to fast
tracking)
Think of this as crashing
a party. You have more
people than originally
planned.
Fast Tracking
Do activities in
parallel that would
normally be in
sequence
Flexible, but
increase cost from
potential rework
Additional risk
exposure because
of possible rework
Can require additional
communication to
coordinate activities
201.
Schedule Compression Example
Thenetwork diagram below shows two paths:
• Path ABDEF for a total duration of 13 and Path ACDEF with a total
duration of 12.
• Path ABDEF is the critical path with a duration of 13 days.
Start
Activity B
2 Days
Activity C
1 Day
Activity D
2 Days
Activity E
4 Days
Activity F
2 Days
Finish
Activity A
3 Days
202.
Schedule Compression Example
Ifyou need to compress the overall duration of the Network Diagram and wanted
to use the fast tracking technique, you could re-sequence the diagram as shown
below.
• Path ABEF has a total duration of 11.
• Path ABDF has a total duration of 8.
• Path ACDF has a total duration of 8.
• Path ABEF is the new critical path because it is the longest of the three paths.
• Fast tracking has reduced the critical path from 13 to 11 days.
Start
Activity B
2 Days
Activity C
1 Days
Activity D
2 Days
Activity E
4 Days Activity F
2 Days
FinishActivity A
3 Days
203.
6.6.11 Critical ChainMethod
• The critical chain method is a different approach for scheduling. It
emphasizes resource flexibility, by using duration buffers for
resources, and leveling over the course of the project to
accommodate limited resources.
204.
6.6.12 Resource Leveling
•As you create a schedule, you assign resources and when you have your
schedule complete, you usually notice a pattern of peaks and valleys
• These peaks and valleys represent resources that can be applied for 12
hours one day, but only 4 hours the next. Leveling is the process of
adjusting these peaks and valleys to create a level usage of resources, as
depicted in the post leveling graphics.
• Typically, when you apply resource leveling to your schedule, you do so at
the sacrifice of the overall finish date, and it’s not uncommon to see your
schedule stretch out a little.
205.
Resource Leveling (Cont.)
Resourceleveling and schedule compression techniques are
typically used together in several iterations to attain an optimal
balance between delivery deadlines and resource utilization.
206.
6.6.14 Logic BarChart
Detailed Schedule with Logical (line) Relationships
WBS # Activity (Task) Days Jan Feb Mar Apr May
1.1 CRM Application Development Starts 0
1.1.1 Module A 40
1.1.1.1 Requirements A 20
1.1.1.2 Code A 20
1.1.1.3 Test A 20
1.1.2 Module B 40
1.1.2.1 Requirements B 20
1.1.2.2 Code B 20
1.1.2.3 Test B 20
1.1.3 Module C 40
1.1.3.1 Requirements C 20
1.1.3.2 Code C 20
1.1.3.3 Test C 20
1.2 Deployment 20
1.2.1 Production Cut Over 20
Timeline
207.
6.6.15 Milestone Schedule
Amilestone has 0 (zero) duration.
Milestone Schedule
WBS # Activity (Task) Days Jan Feb Mar Apr May
1.1 CRM Application Development Starts 0
1.1.1 Module A 0
1.1.2 Module B 0
1.1.3 Module C 0
1.2 Deployment 0
1.2.1 Production Cut Over 0
Timeline
208.
6.6.16 Summary Schedule
Thesummary schedule is used to show an aggregate, or rolled up view
of the various activities at a summary level. It gives senior
management, the project management team, and team members a
picture of how long the summary level work packages are to take, and
in what sequence they occur.
Summary Schedule
WBS # Activity (Task) Days Jan Feb Mar Apr May
1.1 CRM Application Development Starts 100
1.1.1 Module A 40
1.1.2 Module B 40
1.1.3 Module C 40
1.2 Deployment 20
1.2.1 Production Cut Over 20
Timeline
Time Formulas andVariables Review
Description Formula Variable
(Component)
Example
Standard deviation is the
measurement of variation within a
distribution
(P-O)/6 Standard
Deviation
(20-4)/6=2.67
The variance is a measure of how
spread out a distribution is.
((P-O)/6)2
Variance ((20-4)/6)2
=7.11
Weighted Averaging (PERT)
represents an estimation technique
used to calculate duration
estimates. This is used in a beta
distribution.
(P+O+(4 x M))/6
Or
tE = (tO + 4tM + tP)/6
PERT (20+4+(4 x
14))/6=13.33
211.
Time Formulas andVariables Review
Description Formula Variable
(Component)
Example
Simple Averaging (three-point
estimate). This is used in a
triangular distribution.
(P+O+M)/3 Three-Point
Estimate
(20+4+14)/3=12.67
Pessimistic estimate is a worse case
estimate.
Provided on exam P P=10
Optimistic estimate is a best-case
estimate.
Provided on exam O O=4
Most likely (or realistic) estimate Provided on exam M (also could be R,
“realistic”)
M=6
212.
Time Formulas andVariables Review
Description Formula Variable
(Component)
Example
Slack represents the amount of time
(typically days) an activity can be
delayed without causing impact.
Slack=LS-ES or LF-EF Slack (Also called
Float)
6-4=2 or 18-10=8
Forward pass formula EF=ES+Duration-1 EF 6+2-1=7 or EF=10
Early Start is the earliest an activity
can start
Provided on exam ES ES=4
Late Finish is the latest an activity
can finish without causing impact
Provided on exam LF LF=18
Backward pass formula LS=LF-Duration+1 LS 10-5+1=6 or LS=6
213.
Exercises
• Do 6.11.1Time Network Diagramming Exercise – Project A (page 197)
• Individually, Do Time Practice Test, 10 Questions.
Cost Process Table
ProcessGroup Process Name Main Outputs
Planning
Plan Cost Management Cost Management Plan
Estimate Costs
Activity Cost Estimates
Basis of Estimates
Determine Budget
Cost Baseline
Project Funding Requirements
Monitoring and
Controlling
Control Costs
Work Performance Information
Cost Forecasts
Change Requests
Project Management Plan Updates
216.
Cost Calculation Rules
•The earned value part of this section is not small compared to that in the
PMBOK® Guide. Along with providing various memorization tools in this
section, we present the information in such a way that the material helps
eliminate any confusion arising from other products that try to explain
earned value.
• A quick Algebra review can always help. The calculation rules for formulas
are as follows:
• Rule 1: First, perform any calculations inside parentheses.
Rule 2: Next, perform all multiplications and divisions, working from left to
right.
Rule 3: Finally, perform all additions and subtractions, working from left to
right.
217.
7.1 Type ofCosts
There are four types of Cost on a project:
Type of Cost Description
Direct Cost
Direct cost is directly attributable to the project and spent only
on the project work.
Indirect Cost
Indirect cost is cost that is needed for a project but not
restricted to it; it could be used by other projects as well. It is
likely there are other groups or activities benefiting from such
items, and your project pays its part as well.
Fixed Cost
Fixed cost is cost that is consistent on a project regardless of
how many are used.
Variable Cost
Variable cost is one that fluctuates with what is produced. The
more of something you produce, the more of this type of cost
you incur.
218.
Cost Based ProjectSelection Techniques
Project
Selection
Technique
Name
Also
Known
As
Option to Select Example
Return On
Investment
ROI
The biggest number or percentage. Typically the biggest
number or percentage among the projects under
consideration.
$50,000 or 7%
Internal Rate of
Return
IRR
Select the biggest percentage.
Often used in capital budgeting, interest rate makes the
net present value of all cash flow equal zero.
15.5%
Net Present
Value
NPV Select the biggest number (Years are already factored in) $47,000 US
Benefit Cost
Ratio
BCR Select the biggest ratio 3.5:1
219.
Cost Based ProjectSelection Techniques (cont.)
Project
Selection
Technique
Name
Also
Known
As
Option to Select Example
Opportunity
Cost
The amounts that are not
selected
Choose Project A ($7,000)
over Project B ($5000). The
opportunity cost is $5000
to select Project A.
Payback
Period
Select the shortest
duration
7 months
220.
Cost Based ProjectSelection Discussions
Project
Selection
Technique
Discussion
Return On
Investment
(ROI)
Return on Investment (ROI) is a general term. You may
calculate it a variety of ways. Typically, you would choose the
biggest number or percentage among the projects under
consideration.
Internal Rate of
Return
(IRR)
Often used in capital budgeting. Interest rate makes the net
present value of all cash flow equal zero. In the case of IRR
and project selection, select the larger number.
221.
Cost Based ProjectSelection Discussions (cont.)
Project
Selection
Technique
Discussion
Net Present
Value
(NPV)
Net Present Value (NPV) is used in capital budgeting where
the present value of cash inflows is subtracted for the present
value of cash outflows. NPV compares the value of a dollar
today versus the value of that same dollar in the future after
taking inflation and return into account.
I wouldn’t worry about calculating this, you should know how
to select a project using it. For example, with Project A have a
NPV of $150,000 and 6 months or Project B having a NPV of
$295,000 and 1 year, you would select Project B because it
has the bigger number AND the years are already factored
into the dollar amount.
222.
Cost Based ProjectSelection Discussions (cont.)
Project
Selection
Technique
Discussion
Benefit Cost
Ratio
(BCR)
Benefit Cost Ratio (BCR) is the project selection and analysis
technique that involves comparing the benefit to the cost of
the initiative. The format is 3.65:1 that means that the
benefits of the project outweighs the costs 3.65:1.
You should not be concerned about profit in this area. That is
simply noise; the benefit, cost, and ratio between them are
the main components. There could also be a project that has
a BCR of less then one (.75:1) for example. This would mean
that the project had a benefit of $.75 for ever $1.00 invested.
Typically, you would not approve such a project unless there
was some underlying factor such as Y2K issues.
223.
Cost Based ProjectSelection Discussions (cont.)
Project
Selection
Technique
Discussion
Opportunity
Cost
Opportunity Cost is associated with taking another
opportunity. It is what you give up or leave on the table to
take the other opportunity. For example, if you take a $75,000
a year job over a $60,000 a year job, then the opportunity
cost of taking the $75,000 is $60,000.
Payback Period
Payback period is the amount of time needed to earn back
the original investment on the project. PMI® suggests that you
select the project with the shortest payback period.
224.
7.3 Future Value(FV)
• Future value is the value of something such as cash or an
investment at a specific point in the future. For example, if you
had $1,000 now and could get 8% interest over three years,
what is the future value?
• The formula is shown below with PV = present value, r =
interest rate, n = number of periods, and FV = future value.
225.
7.4 Present Value
Presentvalue is the value of something today that you need to create a
certain amount of investment in the future. For example: if you wanted to
have $2,500 in three years, what amount of money do you need today to
produce this amount if the money was earning 8%?
where:
FV = Future Value
PV = Present Value
r = Interest Rate
n = Number of Periods
226.
7.5 Sunk Costs
•Sunk Costs are costs that have already been spent on a project.
• Do not consider these costs when making future project decisions.
• Here’s an example: If a project has a budget of $175,000 and has
already spent $200,000, the $200,000 wouldn’t be considered when
deciding whether to continue on the project or not.
227.
Expected Present Value:What is Expected Present Value?
• Expected Present Value (EPV) is a present value analysis that takes
into consideration the risk of the opportunity being considered. This
calculation involves considering and weighting many potential
outcomes.
• For example: a 40% chance of making $10,000 and a 60% chance of
making $2,000 would create an expected cash flow of $5,200.
• Although there are various ways EPV could be calculated, a common
way would be to multiply dollar amount by likelihood and add the
outcomes similar to expected monetary value (in Risk section).
228.
7.6 Depreciation
• Depreciationis the process of devaluing an asset in the tax system.
Capital assets are those that are purchased and depreciated over
time.
• Over a period of time (Schedule), the worth of an asset decreases
until it has no value or a predefined value at the end of its
depreciation schedule. Generally, calculating depreciation is a
complicated process involving tables, formulas, and more.
229.
7.6.1 Standard Depreciation
•Standard Depreciation is performed with basic division. There are 3 things
to know about something before you can depreciate it.
– What is the start value or purchase price?
– What is the scrap value?
– What is the depreciation time frame?
• For an example, a $5,000 video editing system has a 5-year depreciation
schedule with a scrap value of $0. How much will it depreciate per year?
$5,000 / 5 years = $1,000 / year
230.
7.6.2 Accelerated Depreciation
•Accelerated Depreciation is a little more complex and generally
requires tables of data to calculate.
• For the exam, you must know that there are two main types used:
– Sum of the year’s digit
– Double declining balance (DDB)
• Accelerated depreciation does what its name implies. It depreciates
faster than standard depreciation.
231.
7.7 Life CycleCosting
• Life Cycle Costing is the process of examining all the costs associated
with a project and its product once it goes into production.
• In this process, you not only consider the project costs, but also the
total ownership (operations support) costs of the item created by the
project
• By taking production and the post project life into account, you could
determine that your strategy to build the project might differ.
• Such an approach could result in an increase in project costs, but a
savings in operation costs, which would save company money in the
long-run.
232.
7.7 Life CycleCosting (Total Cost of Ownership)
• Example: A vendor wants to charge your company $50,000 to create
a prototype, then charge $2,000 per item for production
• The $50,000 might be higher than you would like.
• You find another vendor that has a lower upfront cost, but charges
$4,000/item for production.
25 Devices 30 Devices
Vendor A 25*($2,000) + $50,000 = $100,000 30*($2,000) + $50,000 = $110,000
Vendor B 25*($4,000) = $100,000 30*($4,000) = $120,000
233.
7.8 Fixed FormulaProgress Reporting (Earned Value Rules)
A technique that creates a consistent status report for project activities. Instead of having a “gut feel” of percent
completion from each person on a project, this type of reporting is essentially binary. The project planning process
defines the split of percentages
• (e.g., 25% / 75%, 50% / 50%.). This is typically used for activities that are two reporting periods or less.
This process works as follows:
• When an activity starts, it receives the initial percentage (e.g., 25%.) It receives the remaining percentage (e.g.,
75%) only when the activity is complete, thereby reporting 100% complete to the activity.
7.9 Weighted Milestone
• The weighted milestone approach is utilized for activities that typically are longer than two reporting periods.
• In this case, the work is divided into multiple milestones with a measurable output for each section of work.
Plan Cost Management(Planning)
Key Inputs Project
Management
Plan
The project management plan is used to establish the scope baseline, the schedule
baseline, and other items related to the management and tracking of project costs.
Project Charter The project charter is the basis for the elaboration of the budget. It establishes cost-
related approval requirements.
Key Tools &
Techniques
Expert
Judgment
Expert judgment is used to establish the information that is considered when
estimating project costs.
Analytical
Techniques
Analytical techniques are used to create a cost management plan that aligns with the
needs of the project and organization. Selection of these techniques impacts project
risk.
Key Outputs Cost
Management
Plan
The cost management plan defines the methods that will be used to prepare,
configure, track, and control project costs. It also details the methods that will be
used to estimate costs and to establish the budget, the performance baseline, and
cost controls.
Estimate Costs Methods:Analogous
Method Description Scenarios
Analogous
(Top Down)
This estimate is usually a total time
or cost estimate that has no
significant detail.
Advantage: Can be created quickly.
Disadvantage: It lacks detail or
individual piece estimates.
An executive or someone
who is subject matter
expert (SME) creates a
high level estimate based
on experience or past
project history with the
company.
238.
Estimate Costs Methods:Bottom Up
Method Description Scenarios
Bottom Up
This is a detailed estimate that usually
involves team input.
Advantage: There is detail and accuracy
associated with it.
Disadvantage: It can take significant time to
create and the team can pad the estimates
to compensate for unknowns.
A project manager and the team
work together to create a
complete estimate from the
bottom (Activity level) up and
roll it up to the total estimate.
239.
Estimate Costs Methods:Parametric
Method Description Scenarios
Parametric
Based on existing parameters, this
method is usually created by industry
standards or past experience.
Advantage: It can be done quickly
and is usually accurate.
A house builder quotes a
house for $75.00 per square
foot. A carpet installer
quotes $2 per square foot
for installation.
240.
Estimate Costs Methods:
MonteCarlo
Method Description Scenarios
Computerized
/Monte Carlo
This estimate involves using a computerized
program to simulate different variables
associated with project outcome.
Advantages: (1) Accuracy of the estimate; (2)
The “what-if” analysis that can be performed
Disadvantages: The ramp-up time and costs
associated with the setup of the tool.
Variables simulated could include
the overall time and cost estimates
as well as the confidence levels of
the estimates. Variables could also
include the number of people
needed to achieve project goals.
241.
7.12 Cost Range
RoughOrder of Magnitude
Estimate – 25% to + 75%
Definitive
(or Control)
Estimate
-5% to +10%
242.
Cost Range Estimates
Thetable that follows shows the estimate names, the process areas in
which they occur, and the range of estimates. While the table is from a
prior PMBOK Guide, you should know the information it contains. A
memory tool for the estimate names and process groups are "Oh Boy
Dave It’s Pepperoni Pizza."
Estimate Name Process Area Range
Order of Magnitude Initiating -25% to +75%
Budget Planning -10% to +25%
Definitive Planning -5% to +10%
Exercise: Earned Value
Youhave a project to build a new fence. The fence is four sided as
shown:
Each side is to take one day and is budgeted for US $1,000 per side.
The sides are planned to be completed one after the other. Today is
the end of Day 3.
Activity Day 1 Day 2 Day 3 Day 4 Status at end of Day 3
Side 1 S----------F Complete, spent $1,000
Side 2 S------------PF ----F Complete, spent $1,200
Side 3 PS----S-----PF 50% done, spent $600
Side 4 PS---------PF Not yet started
KEY: S=Actual Start, F=Actual Finish, PS=Planned Start, and PF=Planned Finish
What Is: Calculation Answer Interpretation of the Answer
EV
AC
PV
246.
Exercise: Earned Value
What
Is:
CalculationAnswer Interpretation of the Answer
PV 1,000 plus 1,000 plus 1,000 3,000 We should have done $3,000 worth of
work
EV Complete, complete, half done or
1,000 plus 1,000 plus 500
2,500 We have actually completed $2,500 worth
of work
AC 1,000 plus 1,200 plus 600 2,800 We actually spent $2,800
BAC 1,000 plus 1,000 plus 1,000 plus 1,000 4,000 Our project budget is $4,000
CV 2,500 minus 2,800 -300 We are over budget by $300
CPI 2,500 divided by 2,800 0.893 We are only getting 89 cents out of every
dollar we put into the project
SV 2,500 minus 3,000 -500 We are behind schedule.
SPI 2,500 divided by 3,000 0.833 We are only progressing at 83% of the rate
planned.
Forecasting the FutureUsing Earned Value
• Which of the above means:
• How much over budget will we be at the end of the project?
– VAC
• As of now, how much do we expect the total project to cost?
– EAC
• How much more will the project cost?
– ETC
Estimate at Completion (EAC)
Estimate to Complete (ETC) EAC – AC
Variance at Completion (VAC) BAC – EAC
BAC
CPI
253.
7.14.1 Earned ValueManagement
Earned Value Management is a technique for measuring the progress of
a project by looking at its scope, schedule, and cost in an integrated
manner.
Determining Earned Value
Component Definition Calculation/Amount
Budget at Completion
(BAC) aka Cost
Performance Baseline
The amount you expect the
project to cost
Total the costs of each project
activity without regard to
completion status: $100,000
Planned Value (PV)
aka Budgeted Cost of
Work Scheduled
(BCWS)
The value of the work that
should have been completed
at a specific point in time,
excluding any work started
ahead of schedule
Total the value of each project
activity scheduled for
completion at a specific point in
time:
$60,000
254.
Earned Value Variables(cont.)
Actual Cost (AC)
aka Actual Cost of
Work Performed
(ACWP)
The cost of the work that
has been completed at a
specific point in time,
including any work started
ahead of schedule
Total all the project
costs at a specific
point in time:
$80,000
Earned Value (EV)
aka Budgeted Cost
of Work Performed
(BCWP)
A measurement of the
progress of a project and
the basis for cost analysis,
including any work started
ahead of schedule
BAC multiplied by
percentage complete
(40%):
$40,000
255.
Earned Value PerformanceIndex Variables
Index/Variance Formula Result Interpretation
Schedule Performance Index
(SPI)
EV / PV = SPI
$40,000 / $60,000 = .67
Be able to calculate EV or PV
if given SPI and EV or PV.
For example:
PV x SPI = EV or
EV/SPI = PV
An efficiency indicator that denotes the
amount of work done at a single point
in time
An SPI of .67 means that 67% of the
work was scheduled to be done has
been done.
256.
Earned Value PerformanceIndex Variables
Index/Variance Formula Result Interpretation
Schedule Variance (SV) EV-PV = SV
$40,000 - $60,000 =
-$20,000
Be able to calculate EV or PV
if given SV and EV or PV.
For example:
PV + SV = EV or
EV – SV = PV
A variance indicator that denotes the
difference between the value of the work
completed and the value of the work that
should have been completed
If the result is 0, the project is on track.
If the result is greater than 0, the project
is under budget.
If the result is less than 0, the project is
over budget.
In this case, the result is less than 0;
therefore the project is over budget by
$20,000.
257.
Earned Value PerformanceIndex Variables
Index/Variance Formula/Result Result Interpretation
Cost Performance Index
(CPI)
EV / AC = CPI
$40,000 / $80,000 = .5
Be able to calculate EV or AC
if given CPI and EV or AC.
For example:
AC x CPI = EV or
EV/CPI = AC
An efficiency indicator that denotes the
return on each dollar spent at a single
point in time.
A CPI of .5 means that the project is
getting 50 cents of work done for every
dollar spent.
258.
Earned Value PerformanceIndex Variables
Index/Variance Formula/Result Result Interpretation
Cost Variance (CV) EV-AC = CV
$40,000 - $80,000 =
-$40,000
Be able to calculate EV or AC if
given CV and EV or AC.
For example:
AC + CV = EV or
EV – CV = AC
A variance indicator that denotes the
difference between the value of the
work completed and cost of the work
completed
If the result is 0, the project is on track.
If the result is greater than 0, the
project is under budget.
If the result is less than 0, the project is
over budget.
In this case, the result is less than 0;
therefore the project is over budget by
$40,000.
259.
Earned Value Analysis
(ACWP)
AC
$80,000
(BCWP)
EV
$40,000
(BCWS)
PV
$60,000
CPI= EV / AC = .50
CV = EV - AC = (-$40,000)
SPI = EV / PV = .67
SV = EV - PV = (-$20,000)
Cost Schedule
Unacceptable, as the project
has done $40,000 of work
(EV), but spent $80,000
(AC) to get that work done
Unacceptable, as the project has
done $40,000 of work (EV), but
should have done $60,000 of the
work at this point in time
How much work is
done (EV),
compared to what
was paid for it (AC)
How much work is
done (EV), compared
to how much work
should be done (PV)
260.
7.14.2 Forecasts
Forecasts DescriptionFormula
Estimate At
Completion (EAC)
The estimate at completion (EAC) represents the
current projected final costs based on the current
spending efficiency (CPI).
If you have a CPI greater than one (>1), the number
will be less than the BAC, meaning that the project
will likely finish under budget.
If you have a CPI of less than one (<1), the number
will be greater than the BAC, meaning that the
project will finish over budget.
If the CPI equals 1, the project will finish on budget.
EAC: $200,000 (This is on pace to come in over the
BAC of $100,000 in our example on the previous
pages.)
EAC = BAC / CPI
Or $100,000/.5
=$200,000
261.
Forecasts
Forecasts Description Formula
EstimateTo Complete (ETC)
The estimate to complete (ETC represents the
amount needed to finish the project based on
the current spending efficiency of the project.)
This figure is the EAC without the actual cost
to date.
ETC: $120,000 (It is on pace to exceed the BAC
amount when factoring in what has already
been spent in our example in the previous
pages.)
ETC = EAC – AC
Or $200,000
$80,000=
$120,000
262.
Forecasts
Forecasts Description Formula
ToComplete
Performance Index
(TCPI)
An efficiency indicator that denotes the efficiency
needed from the remaining resources to meet the cost
goals of the project and finish the project on budget.
(BAC - EV) / (BAC - AC) or
($100k - $40k) / ($100k -
$80k)
=3.0
263.
Forecasts
Forecasts Description Formula
VarianceAt
Completion (VAC)
The variance at completion (VAC) is the difference
between the budget at completion (BAC) and the
estimate at completion (EAC). This difference tells how
much over or under budget the project finished. Using
the sample data above, we see the following values
with EAC, ETC, and VAC.
VAC: -$100,000 (This figure is the projected over budget
amount, based on the current spending efficiency of the
project in our example on the previous pages.)
VAC = BAC –EAC
Or $100,000-$200,000
= -$100,000
264.
Earned Value ForecastTable
The following Earned Value Forecast
Table shows the three formulas above
set up as tic-tac-toe table. You can map
out where the variables go in the table
and see that EAC makes a diagonal line.
Use this table as a quick reference for
the PMI certification exam.
__
__EAC
VAC
ETC
CPI
EAC
AC
BAC
BAC
EAC
__
__
__
__
__
__
Earned Value Forecast Table
265.
7.14.3 S Curve
$(Dollars)
Time
Point of Time for
Performance
Measurement
EV (BCWP)
AC (ACWP)
PV (BCWS)
Legend
S Curve For Project Performance
Measurement with Earned Value
The classis S Curve in the
figure below shows the
interaction between work,
cost, and time over the life
of the project.
266.
S-Curve – DirectRelationship between Cost, Time, and
Percentage Complete
Example: a labor-only twelve month long project that was started on
January 1st. It employs ten contractors that have agreed to the same
rate of pay throughout the contract and to work 40 hours every week
from January 1st until the end of the project. In this case, there is a
direct relationship between cost, time, and percentage completed.
$ (Dollars)
Point of Time for
Performance
Measurement
267.
S-Curve – LargePercentage of Upfront Spending
Example: a technical project that has large upfront spending associated
with the work.
$ (Dollars)
Time
Point of Time for
Performance
Measurement
268.
S-Curve – LargePercentage of Spending at End of Project
Example: a manufacturing project that begins in design, so the bulk of
the project costs are toward the end.
$ (Dollars)
Time
Point of Time for
Performance
Measurement
269.
Cost: Calculating theBasics of Earned Value
Management (EVM)
The earned value management triangle is ideal to memorize
because it deals with the calculation of (cost or schedule)
variances or performance indices. To read it, start with EV and
follow the arrows. For example EV divided (÷) by PV equals SPI or
EV minus AC equals CV.
Earned Value Management Table
270.
Cost: Calculating theBasics of Earned Value
Management (EVM) – (Cont.)
Here are some keys to memorizing the earned value management
table.
Performance Indices (CPI, SPI) Variances (CV, SV)
Listed first (vertically) Listed last (vertically)
Calculated by division Calculated by subtraction
If less than one (<1), project is
behind schedule or over budget
If negative, project is behind
schedule or over budget
If greater than one (>1), project is
ahead of schedule or under budget
If positive, project is ahead of
schedule or under budget
271.
Cost: Calculating theBasics of Earned Value
Management (EVM) – (Cont.)
Calculations Steps
Planned Value
(PV or BCWP)
Determine the date or "complete through" level.
Add the planned values of activities that should have
occurred as of the date or "complete through" level.
Do not add the planned value of activities that have
started, that are ahead of schedule. Ex: Today is
June 6th, and there are two activities that should not
start until June 8th but have already started.
If an activity should be partially complete at the point
you are measuring, the percent (%) complete will
have to be provided or assumed. Ex: A four-day
activity is generally considered to be 50% done two
days into the work.
272.
Cost: Calculating theBasics of Earned Value Management
(EVM) – (Cont.)
Calculations Steps
Actual Cost
(AC or ACWP)
Add all "actual costs."
Regardless of status of activity (1% to 100%) even if it
was started ahead of schedule
Any and all costs related to the project
273.
Cost: Calculating theBasics of Earned Value
Management (EVM) – (Cont.)
Calculations Steps
Earned Value
(EV or BCWP)
1. List the planned value (PV) of all the following types of activities:
• The activities that should have started and haven't started yet
• The activities that should have started and have actually started
• The activities that shouldn't have started and have (ahead of schedule)
2. Determine the % complete of each activity listed in step 1.
3. Multiply planned value (PV) by the % complete for each activity, giving the
earned value of an individual activity.
4. Add all the earned value measurements (calculated in step 3) from each activity
to get the total earned value for the project or situation.
274.
Cost: Calculating theBasics of Earned Value
Management (EVM) – (Cont.)
Activity
Name
Day
Actual Cost ($)
(AC)
Earned Value ($)
(EV)
%
Complete
Planned Value ($)
(PV)
Activity A Day 1 $300 $300 100% $300
Activity B Day 2 $200 $150 100% $150
Activity C Day 2 $150 $100 100% $100
Activity D Day 3 $225 $200 100% $200
Activity E Day 3 $100 $100 100% $100
Activity F Day 3 $300 $150 60% $250
Activity G Day 4 $140 $130 65% $ 200
Activity H Day 4 $100 $80 20% $400
Activity I Day 5 $0 $0 0% $300
Activity J Day 5 $0 $0 0% $200
(The bolded line between Activities F and G represents the measuring point for the analysis.)
† PV x % complete
*These activities started ahead of schedule, and the progress must be included.
275.
Cost: Calculating theBasics of Earned Value Management
(EVM) – (Cont.)
Budget At
Completion
Calculate this figure by totaling the Planned Values for all the
activities. The total Budget at Completion is $2,200.
Planned
Value
To calculate Planned Value, add up the Planned Value for each
activity through day 3. The total is $1,100 of Planned Value. This
value represents the work that should be complete through day
3, meaning that you should have spent $1100 through day 3.
When looking at Planned Value in this case, even though some
work is ahead of schedule, you should look only at the work that
should have been done through day 3.
Actual Cost
Total what you have actually spent to date. This total includes
any and all costs, even if the work was started ahead of
schedule. The Actual Cost is $1,515.
276.
Cost: Calculating theBasics of Earned Value Management
(EVM) – (Cont.)
Earned Value
Earned Value is the Planned Value of each activity (regardless if
it should have started or not) multiplied by the percentage
complete (%). This value provides the Earned Value (EV) for
each activity. The next step is to add the Earned Value (EV) of
each of the activities for the total Earned Value (EV) for the
project. This value represents the budgeted cost of work
performed (BCWP) or Earned Value, and it is $1210.
Translation
Translation means that through day 3, you should have spent
$1100, and Activities A through F should be complete. You have
spent $1515 but have an Earned Value (the work to show for
what you have spent) of only $1210.
277.
Cost: Calculating theBasics of Earned Value Management
(EVM) – (Cont.)
Using the Earned Value Management table we saw that the project has the
following metrics:
CPI: $1,210 / $1,515 = 0.8 CV: $1,210 – $1,515 = -$305
SPI: $1,210 / $1,100 = 1.1 SV: $1,210 – $1,100 = $110
• The CPI shows that the project is getting 80-cent value for every dollar spent
with a CV that shows that it is presently $305 over budget.
• The SPI shows that the project is progressing at 110% of that rate planned and
has accomplished $110 more in work than was scheduled.
• The project is ahead of schedule but over budget.
278.
Exercises
As a team,answer 7.18.4 Earned Value Exercise, pages 262-263. When
complete, compare your answers with other teams.
Individually, do the Cost Practice Test, 10 questions. When complete,
review your answers.
Quality Management ProcessInteraction
A memory tool is PAC (Plan Quality Management, Perform Quality
Assurance, Control Quality).
281.
Quality Process Table& Figure
Process Group Process Name Main Outputs
Planning Plan Quality Management
Quality Management Plan
Process Improvement Plan
Quality Metrics
Quality Checklists
Executing Perform Quality Assurance
Change Requests
Project Management Plan Updates
Monitoring and
Controlling
Control Quality
Quality Control Measurements
Validated Changes
Verified Deliverables
Work Performance Information
Change Requests
Project Management Plan Updates
282.
8.1 Definition ofQuality
Quality is the degree to which a set of inherent characteristic fulfill requirements.
• The goal of the quality processes is to align them with the International
Organization for Standardization (ISO).
They should generally align with:
• Concepts created by Deming, Juran, and Crosby
• TQM (Total Quality Management)
• Six Sigma
• FMEA (Failure Mode and Effect Analysis)
• VOC (Voice of the Customer)
• Continuous Improvement
• COQ (Cost of Quality)
283.
8.2 Project Managementand Quality Management
Project management and quality management should complement
each other as they work together. They both focus on items such as:
• Customer satisfaction
• Management responsibility
• Continuous improvement
• Prevention over inspection
284.
8.3 Total QualityManagement (TQM)
W. Edwards Deming’s 14 principles of management were generally
viewed as the basis for which Total Quality Management was
founded.
The following are the basic principles:
• Be proactive, not reactive
• Utilize leadership and accountability
• Measure and strive for constant improvement
285.
Quality Philosophies
8.4 Zerodefects is a concept created by Philip Crosby. Its basic foundation is
to do something right initially and you shouldn’t have to repeat it.
8.5 Fitness for Use
The Fitness for Use concept was created by Joseph Juran. It implies that the
needs of the customers and Stakeholders are defined and then attempted to
satisfy.
8.6 Continuous Improvement (Kaizen)
Continuous improvement takes a proactive stance to development, one that
makes improvements throughout a process.
286.
8.7 Gold Plating
•Gold Plating is the practice of providing more than what the
customer requested. Per PMI®, this practice is unacceptable and
professionally irresponsible. The project manager and team should
provide only that which was approved.
• Give your customers exactly what they ask for and what they approve
in the charter, no more or no less.
8.8.1 Quality ManagementPlan
• The Quality Management Plan helps the Project Manager and team do the
following:
– Establish the definition of quality for the project and work of the project
(Quality Baseline)
– Establish any checklists to ensure processes are followed
– Define and process steps
– Validate the quality processes are working
– Test the product of the project
– Format project/process data for communication to project stakeholders
– Deal with changes to the quality standards and processes on the project
289.
8.8.2 Process ImprovementPlan
A component of the project management plan, the process
improvement plan defines how to analyze a process in order to
determine the activities that will increase the value of the process.
Consideration should be given to:
– process boundaries (process purpose, required data, start date,
end date, inputs/outputs, owner, and stakeholders)
– process configuration (graphical depiction of processes and their
interfaces)
– process metrics (measurement units and limits of control)
– improved performance targets (guide for process improvement
activities)
290.
8.8.3 Grade vs.Quality
• Grade
– deals with the characteristics of the product
• Quality
– deals with the stability or predictability of the product
– deals more with how well something works.
291.
8.8.4 Accuracy vs.Precision
• Accuracy
– deals with the values being measured aligning with the target
value.
• Precision
– deals with consistency of the output. If the test is acceptable or
not, the outcome being consistent is the desire if focusing on
precision.
292.
8.8.5 Prevention vs.Inspection
• Prevention
– deals with eliminating defects and potential defects from the
process. This is the proactive approach to quality.
• Inspection
– deals with fixing errors or defects as they come up in the process
of creating the product or whatever is being tested or evaluated.
293.
8.8.6 Cost ofQuality
Cost Item Conformance
(Prevention)
Nonconformance
(Inspection)
Proactive analysis of process improvement X
Company training relating to quality and
continuous improvement
X
Lower inventory needed X
Reduced warranty support X
Excessive inventory X
Throwing away defective products X
Warranty support X
Reacting to problems after they occur X
294.
Quality Terms
8.8.7 Designof Experiments (DOE)
A statistical process used to determine the factors that can influence
variables associated with a process or product.
8.8.8 Just-in-Time (JIT)
An inventory management process that lets a company have little or no
excess inventory in stock other than what they need to build existing
orders.
295.
8.8.9 Normal Distribution
Theproject activity met with a typical outcome, resulting in nothing
abnormal.
Normal
Distribution
Mean
+1
-3
-2 +2
-1
+3
68.26%
99.73%
95.46%
-6 +6
99.9997%
296.
8.8.10 Sigma
• Sigmais also known as the standard deviation.
• The formula of the standard deviation is: (P-O)/6
• P=Pessimistic and O=Optimistic.
Example:
• Building 100 widgets, with a 1 Sigma quality standard, you have success as long as 68.26% or more of
whatever you build works.
• 31.74% (100%-68.26%) or less of what you build can be tolerated to fail, potentially leading to high
costs of rework or scrap.
• By increasing the quality standard to 2 Sigma (95.46%), you increase the quantity of expected
passing product to 95.46 units out of 100, or no more that 4.54 units would fail.
• This decreases the cost of rework and waste, but there will likely have to spend on quality training
and other proactive activities to achieve this standard.
297.
8.8.11 Probabilities
A probabilityis the likelihood that something will happen.
It can be expressed:
• in a percentage (1%, 75%, 100%) or
• in a more conventional number format (0.01, 0.75, 1.0). This decimal
translates to a percentage.
For the exam, it is key for you to understand that the sum of all
probabilities equals 100% or 1.0.
298.
8.8.12 Proprietary QualityManagement Methodologies
• CMMI
• 6 Sigma
• Lean 6 Sigma
• Quality Function Deployment
8.8.13 6 Sigma
• 6 Sigma is a modern quality philosophy made popular by Motorola and other companies in
the late 80s.
• It involves setting very high standards of 6 Sigma for products or processes that the
company produces.
• In essence, this philosophy states that approximately 99.9997% of everything a company
creates or the processes it executes are error-free.
299.
8.8.14 ISO 9000
•The International Standards Organization (ISO) standard is associated with companies that
wish to document their processes and adhere to those processes.
• While quality improvement is not always a given with this standard, the repeatability
associated with it typically shows a positive benefit.
• This standard can also be used to ensure that partners a company works with have defined
repeatable processes.
ISO comes down to the following three steps:
• Document what you do
• Do what you document
• Document any variance (from the normal processes)
300.
8.8.15 Quality Responsibility
Describethe different roles and responsibilities:
Role Level of Responsibility Example
Team member
or worker
They are responsible for the quality of
their own work.
The electrician is accountable to
ensure that work on the job is
satisfactory.
Project Manager
They are responsible for the quality
standards on the project.
The Project Manager is
responsible for the quality on
the networking project.
Senior/
Executive
Management
They are responsible for the quality
standards at the company.
The CEO and Senior
Management are responsible
for quality at the company.
301.
8.8.16 Quality FunctionTable
Quality Function Plan Quality
Quality
Assurance
Quality
Control
Flowcharts
Fishbone/Ishikawa/Cause
and Effect Diagram
Benchmarking
Design of Experiments
Inspection
Checklists
Control Charts
Pareto Diagrams
Statistical Sampling
Quality Terms: Testing
•Quality control involves testing the process output.
There are many items to consider when testing:
• Focus on determining if testing will occur with the population or a sample
and what the sample criteria will be.
• During testing, define the attributes and variables that are important.
• Gain an understanding of the concept of Statistical Independence and
Mutual Exclusivity.
305.
Quality Terms: Populationvs. Sample
• In population testing every item created is tested (Ex: every airplane
built).
• In sample testing you determine how much of something must be
tested to ensure that defects are caught.
• Sample testing would typically be done if you didn’t need to test
everything, or if testing was too costly or too destructive.
306.
Quality Terms: Variablevs. Attribute
A variable is the characteristic that the Quality Control process is going
to measure such as capacity or height.
An attribute is the specific measurement being recorded such as square
feet, inches, or meters.
Remember:
– that an attribute is a unit of measurement.
– you have to define the variable before you can define the
attribute.
307.
Quality Term: Attribute
Anattribute is the specific measurement being recorded.
• For example, square feet, inches, or meters.
• To remember the difference between a variable and an attribute,
remember that an attribute is a unit of measurement.
• It’s also good to know that you have to define the variable before you
can define the attribute.
308.
Quality Terms: StatisticalIndependence vs. Mutual Exclusivity
Statistical Independence is a state in which the outcomes of processes are
separate from one another.
• For example, buying a lottery ticket last week doesn’t increase your odds
of winning the lottery this week.
Under mutual exclusivity, one choice will not include any other choices.
• For example, shipping a product air overnight does not overlap with
shipping the same product ground saver. They are separate options.
309.
Quality Terms: MutualExclusivity
• Under mutual exclusivity, one choice will not include any other
choices.
• For example, shipping a product air overnight does not overlap with
shipping the same product ground saver. They are separate options.
310.
Quality Terms: Heuristic
•Heuristic is a rule of thumb and can apply to a variety of Knowledge
Areas.
• It serves as a general rule to use when a rule specific to the situation
might be too time-consuming or costly to generate for what is
needed.
311.
8.11.1 Flowchart
New Student
Registrationof
Student in CMS
Student
Information
Explain
Registration
Process
E-mail
Confirmation of
Registration
Add Data to CMS
Email Confirmation
of Shipping
Products Ship Products
Yes
No
312.
8.11.2 Pareto Diagram
Thegeneral rule with a Pareto diagram is the 80/20 rule, meaning that
80% of the problems come from 20% of the issues.
Toner/InkEmpty
PaperJam
CableBroken
DriverIssue
Other
30
20
10
0
100
80
60
40
20
0
Number of
Defects
Percentage of
Defects
Printer Problems
313.
8.11.3 Control Chart
RunChart Diagram Sample shows a control chart and a number of
different pieces of it. The mean represents the middle of the chart and
the target measurement.
314.
8.11.4 Scatter Diagram
•Helps to see a correlation (or
lack of) between variables.
• The closer the output
resembles a diagonal line,
the more dependent the
variables are
• The less it resembles a
diagonal line, the more
independent the variables
are.
315.
8.11.5 Quality CheckSheet:
Do’s and Don’ts for Taking the Exam
Instructions: Checksheets are good tools you can use to ensure
everything that should be done in a process has been completed as
planned.
As a team, create two columns providing information for the do’s and
don’ts of for preparing to take the PMP/CAPM exam.
316.
8.11.6 Histogram
A histogramis a chart that indicates the occurrence of a variable via
vertical bars. The columns represent a characteristic and column height
represents occurrence frequency
317.
8.11.7 Cause andEffect Diagram
(a.k.a. Ishikawa, Fishbone) Diagram
318.
Key Quality Formulasand Variables
Standard Deviation shows how far
the measurement is from the mean
(average).
St Dev = (P-O)/6 P=Pessimistic
Estimate
O=Optimistic
Estimate
(120-60)/6=10
Sigma (These values represent the
pure math value, without factoring in
process variance which can be up to
1.5 Sigma.)
N/A 1 Sigma=68.26%
2 Sigma=95.46%
3 Sigma=99.73%
6
Sigma=99.9999998%
or 99.9997%
Memorize the bolded
values on 1, 2, 3, and
6!
1 Sigma=68.26%
2 Sigma=95.46%
3 Sigma=99.73%
6 Sigma=99.9999998%
319.
Exercise
• As ateam, use the Quality Mind Map to complete the Quality ITTO
Matching Exercise.
• Individually, do Quality Practice Test, 10 questions.
Human Resource ProcessTable
Process Group Process Name Main Outputs
Planning
Plan Human Resource
Management
Human Resource Management Plan
Executing
Acquire Project Team
Project Staff Assignments
Resource Calendars
Project Management Plan Updates
Develop Project Team Team Performance Assessments
Manage Project Team
EEF Updates
OPA Updates
Change Requests
Project Management Plan Updates
9.1.1 Human ResourceManagement Plan
• Part of the Project Management Plan, the human resource plan
outlines methods for defining, staffing, managing, controlling, and
releasing human resources.
• The plan should include, at a minimum:
– Documentation of roles and responsibilities with emphasis on role
definition, role authority, and role responsibility.
– Project organization charts that define team members and their
reporting hierarchy
– Staffing Management Plan that outlines the manner and timing for
meeting human resource needs
324.
9.1.2 Staffing ManagementPlan
The Staffing Management Plan helps the Project Manager and team do
the following:
• Establish the staffing policies for the project
• Establish the organizational chart (OBS) for the project
• Define position descriptions for the project
• Get team members on the project
• Develop the group of people into a team
• Deal with team issues that arise
325.
9.1.3 Responsibility AssignmentMatrix
(RAM) Charts
Activity/Resource Mike Denise Brianne Reanna Cody
Planning R A C C I
Design I R A I C
Development I A R C I
Testing I A C R C
Closure I R A C I
Legend:
Responsible=R, Accountable=A, Consult=C, Inform=I
SCARI Matrix = Sign-Off, Consult, Accountable, Responsible, Inform
9.1.5 Organizational Theory
Maslow’sHierarchy of Needs
Self
Actualization
Esteem
Belonging
Safety
Physiological
Self Actualization (could be
considered “Achievement”)
Someone who performs a calling, someone with
everything going right and feeling that life can’t get
much better
Esteem How we are perceived and feel about ourselves
Belonging Friends, finding love, existence, and association
Safety Items or elements that make us feel comfortable or
protected
Physiological Basics needed for survival, such as shelter and food
328.
Herzberg’s Motivational Theory
Herzberghad two main factors for workplace success.
• Hygiene – This focuses mainly on the areas associated with the workplace.
Factors such as a safe work environment, steady pay, and a stable job are
examples.
• Motivating Agents – This focuses on non-financial characteristics of work.
Examples can include the opportunity to improve and do more, education, and
responsibility.
• One basic assumption of motivational theory is that in most cases, money does
not create motivation. Instead, endeavors like improving the workplace, showing
appreciation toward the worker, and additional responsibility typically motivate
workers more than simply throwing money at them.
McClelland’s Achievement Theory
AchievementTheory: McClelland's theory that revolves around
achievement, power, affiliation.
• The achievement focus is on being successful
• The power focus is on influencing others, and
• The affiliation focus is on belonging.
• These three tie together as a group of people form a project team
and work toward common goals.
331.
McGregor’s Theory X
TheoryX is more an “old school” mentality when factories produced
the majority of the work and people went to work, were told what to
do, and didn’t want to have to evaluate what needed to be done, but
wanted the boss to tell them.
Theory X
Labor and management Characteristics
Labor wants to be told what to do.
Management feels the need to supervise.
Labor is not necessarily motivated to work.
Labor does not want to work.
X X
X
332.
McGregor’s Theory Y
TheoryY is a more “modern” perspective on labor and management.
It is an environment where management typically lets labor know what
needs to be done and when, and direct them toward it. This main
difference here stems from motivation.
Theory Y
Labor and Management Characteristics
Labor can work with an end goal in mind.
Management can minimize supervision.
Labor is motivated to do what is necessary for
work.
Labor wants to work and enjoy it.
333.
9.1.6 Leadership andManagement Styles with the Project
Management Life Cycle
Stage of Project Management Approach
Early Directing
Gains Momentum Coaching
Significant work complete Facilitating
Closing Supporting
334.
9.1.7 Delegation
For Considerationto Delegate Not to be Delegated
Technical Activities
Evaluating or ranking team
members
Cross-training-related work Long term (strategic) planning
Routine activities
Monitoring extremely important
activities
Enjoyable activities Rewarding team members
Work that breaks the routine of
some jobs
Determining policies
Work that others do better Personnel selection
335.
9.1.8 Management Styles
Befamiliar with the eight different Management Styles.
Style Description
Autocratic Autocratic managers have unlimited power and authority.
Charismatic
Charismatic managers have an appealing persona that makes team
members enjoy working with them.
Coach
The Coach brings out the best in the team, coaching members to their
potential or where they need to be with regard to the project.
Director
The Director drives the direction of the team or team members to
accomplish specific activities or goals.
Facilitator
The Facilitator helps keep things progressing, making them happen. This
style is not super proactive or ownership.
336.
Management Styles (Cont.)
StyleDescription
Mediator
The Mediator tries to find a common goal when there is disagreement.
This style is ideal when there are varying technical opinions or
disagreement among resource managers.
Mentor
The Mentor focuses on showing someone how, by example, to improve
and be better, helping them take on new skills and roles.
Visionary
The Visionary sees what can be, where the company or team needs to
go, focusing on the big picture of the company, with others focusing on
the day-to-day events.
337.
9.1.9 Roles andResponsibilities
Constructive Team Roles
Initiator
A proactive role that takes initiatives on a project with
contribution and ideas
Information
Seeker
A role that works to enhance information and knowledge
associated with the project
Information
Giver
A role that shares information and thus helps enhance
communication on the project
Encourager
A role that helps the project and team by focusing on what
the project is creating, not the challenges of the project
Clarifier
A role that helps focus on making sure people on the
project understand what the details of the project entail
338.
Roles and Responsibilities(cont.)
Constructive Team Roles
Harmonizer
A role that helps evolve information and understanding on the
project above the team members
Summarizer
A role that relates back to the overall picture of what the
project is focusing on
Gate
Keeper
In project management, a role that helps bring people into the
project
In business school, this term could be viewed differently,
including a role that keeps people out of something
Devil's
Advocate
A role that contradicts popular views or opinions about the
work of the project
339.
Destructive Team Roles
DestructiveTeam Roles
Aggressor A role with a negative attitude toward the project
Blocker A role that interrupts information flow on the project
Withdrawer A role that is non-participatory on the project regarding
information and project issues
Recognition
Seeker
A role that looks at the project first to see what they can
get out of it
Topic Jumper A role that doesn't stay focused on the primary topics of
focus and conversation
Dominator A role that consumes project communication and focus
with their own views without considering others
340.
9.1.10 Power
Five typesof Power
Type Level of Responsibility Example
Formal
This is legitimate power. It is the type
of power that comes from the Senior
Management at a company
authorizing you to be the Project
Manager, and whatever authority
comes that.
As you saw at the kickoff meeting,
the sponsor said that I am the
Project Manager on this project and
the team would take direction from
me on matters related to the
project.
Reward
A reward is usually the best form of
power to use. With reward, someone
receives a benefit (reward) for doing
something that is needed.
If you complete your work on the
project ahead of schedule, we will
send you to that training class you
have been wanted to attend.
341.
Power (Cont.)
Type Levelof Responsibility Example
Penalty
A penalty is the worst form of power
to use. With a penalty, people
experience negative impacts if they
don’t do what is desired.
If you don’t complete the work as
planned, I will make sure that you
don’t get your bonus like the
other people will.
Expert
This form of power is one that Project
Managers must earn on their own.
With expert power, the Project
Manager is perceived as an expert on
the subject by those on the team or at
the company.
We need to listen to what he says
regarding project management.
He has 20 years experience in it
and is a PMP®.
342.
Power (Cont.)
Type Levelof Responsibility Example
Referent
This type of power comes
from an attitude or
“presence” that a person has
and the corresponding type
of influence this person has
on the team. It could also
come from someone who
would align with other
people in a powerful
position at the company or
on the team.
Ex. #1: I want to stay late and finish
this before the morning like I
promised the Project Manager I
would. He has always been good to
me and the rest of the team and I
don’t want to let him down.
Ex. #2: We must do what the Project
Manager asks. She has lunch with our
Vice President every week, and they
play golf together a lot. If we let her
down, he will definitely hear about it.
343.
Project Manager PowerTypes
Power Type Description
Attitude Power
This type of power can involve utilizing a middle person to
negotiate for the Project Manager. This arrangement can minimize
the "personal" effect or attitude that can arise when, during
negotiations, the Project Manager potentially takes some point or
issue personally or more seriously than it should be taken.
Commitment
Power
This type of power involves utilizing commitment via alliances and
partnerships on the project team to tackle challenges to the
project as they arise. This has a potential connection with referent
power.
Competition
Power
This type of power involves maximizing involvement in the project
or idea in the form of competition to help enhance the
commitment of those involved to work toward a more successful
outcome of the project or idea.
344.
Project Manager PowerTypes (Cont.)
Power Type Description
Investment
Power
This type of power involves an attempt to delay until later a key decision (or
decisions) that could cause a stakeholder or party with a different view than
yours from having to make a decision until they have made a significant time
investment in the project. After this initial investment has been made, they are
typically more flexible in their negotiations.
Knowledge
of Needs
Power
This type of power involves attempting to realize two things that are negotiated:
What the other party says they are after, and what they are after that hasn't
been made public. Knowledge of these two items can help the project manager
with power focused on a solution instead of a moving target.
Moral or
Ethical
Power
This type of power involves utilizing a moral or ethical perspective tied to one's
values in the negotiation process. Often times this can be asking what is
reasonable or fair in the negotiations process instead of an approach which
could attempt to maximize opportunity.
345.
Project Manager PowerTypes (Cont.)
Power Type Description
Persistence Power
This type of power involves sticking to the target of the
negotiations or project. In a lot of cases people will simply give up
after an initial rejection, persistence involves holding on and
working toward the target.
Persuasion Power
This type of power involves discounting logic which technical
people can often use to sell ideas, and instead focusing on
comparisons that relate to the negotiating parties experiences,
creating evidence that can't be overlooked, and showing how a
solution will meet their needs.
Planning Power
This type of power involves using preparation followed by
negotiation to effectively plan the project.
346.
Project Manager PowerTypes (Cont.)
Power Type Description
Precedent Power
This type of power involves utilizing something that has worked before
regardless if it is at the current project environment or elsewhere, if the
desired result was achieved. This can also include challenging ways
things have always been done at a company to see a new way of doing
things based on precedent set elsewhere.
Professionalism
Power
This type of power involves being professional and practical when
working with others. This helps to foster a win/win relationship with
those that work with the project manager by allowing the project
manager to look at the people and their needs.
Risk Power
This type of power involves utilizing calculated risks in negotiations to
achieve project goals. Avoid getting attached to a position because it
could limit you in negotiations. Also, to minimize surprises, know as
much about the negotiation environment as possible.
9.2.1 Halo Theory
HaloTheory is the process (in project management) of assuming that
someone would make a good project manager because that person is good in
his or her technical field.
This theory:
• Could also be used to imply that if someone was not good in his or here
technical field that person wouldn’t be good at project management.
• Often becomes reality when someone is promoted to a project manager
from technical or hands on position and hasn’t had the opportunity to
receive any project management training.
9.3.1 Form, Storm,Norm, Perform, Adjourn (Team
Development Life Cycle)
Team development involves convergence of a group of people into a
performing organization.
Form Form refers to the creation of the team, when people on the
team are put together per the project organizational Planning
needs.
Storm Storm refers to the chaos that occurs as people start to get
accustomed to working together.
Norm Norm refers to the point in time when team behavior starts to
normalize and team members are accustomed to each other.
The newness of the group of people has worn out.
Perform Perform refers to the activity that transpires as the team
works as a team instead of as a group of people. The group
should be working at an optimal level in this phase.
Adjourn As the team work is complete, the team is disbanded and
team members move to new work or assignments.
351.
9.3.2 Recognition andRewards
A Reward and Recognition System is needed for team development and for
optimizing performance.
Key points for a successful Reward and Recognition System:
• Define the system but be adaptable because different things motivate
different people.
• Provides compensatory time for overtime hours worked or paying for a
certification test or training.
• Management follows through on its promises.
• Don’t break your word to you team not only hurts the reward system, but
your creditability as a Project Manager as well.
9.4.1 Sources ofConflict
To minimize conflict, a Project Manager can utilize the following:
• Team ground rules
• Group norms
• Project management practices
354.
9.4.2 Conflict Resolution
Conflict
ResolutionMode
Description Example
Problem Solving
(Confrontational)
Problem solving is an
effort in which
attempts are made to
solve the actual
problem. This is the
best type of conflict
resolution.
If you can’t do what is
needed with your current
computer, get an upgrade
that lets you accomplish
what’s needed for your job.
355.
Conflict Resolution: Compromise
Conflict
ResolutionMode
Description Example
Compromise
Compromise is an activity during
which an attempt is made to get
everyone involved to give
(concede) a little to find a
common ground and resolution.
Compromise is sometimes viewed
as undesirable because everyone’s
giving something up can
(potentially) cause the solution
not to meet anyone’s needs.
If we can get labor to
give in on benefits a
little, and
management to
increase their raise
increase a little, I think
we can find
agreement that both
sides can live with.
356.
Conflict Resolution: Forcing,Smoothing
Conflict
Resolution
Mode
Description Example
Forcing
Forcing is an action in which a
direct order to resolve
something is given. It is typically
the worst type of Conflict
Resolution mode.
You will stop using that
software and switch to the
authorized version or you will
not be around here for long.
Smoothing
Smoothing is an attempt to
focus on the positive and
distract the attention from the
negative.
Look at how good the
requirements on the project
went. We just have to apply
that same view to this phase
of the project as well.
357.
Conflict Resolution: Withdrawal
Conflict
Resolution
Mode
DescriptionExample
Withdrawal /
Avoiding
In withdrawal, the Project Manager
ignores the problem and hopes it
either fixes itself or disappears.
Typically, withdrawal is not viewed
by PMI® as a Conflict Resolution
mode because it’s not a proactive
approach to resolving conflict.
I know he is a pain to
work with and takes
longer to do his work
than we like, but
maybe if we leave him
be, he will just quit and
take a new job.
358.
Conflict Resolution: Collaborating
Conflict
Resolution
Mode
DescriptionExample
Collaborating Collaborating entails considering
insights and views from a variety
of sources and leads to
consensus management which in
turn leads to commitment.
The suggestions and
pertinent information
we obtained from
across the enterprise
have been
instrumental in
ensuring that the
project was successful.
359.
9.4.2 Interpersonal Skills
Interpersonalskills are utilized by Project Managers to take advantage of each team
member’s strengths.
Interpersonal skills most commonly used by Project Managers are:
• Leadership skills which should be used throughout the project, especially to
convey vision and inspire the project team’s performance
• Influencing skills which should be used in a matrix organization to influence
stakeholders on a timely basis, especially clear presentation of information,
listening skills, consideration of other viewpoints, and knowledge of critical and
relevant information
• Effective decision making skills which should be used to influence and negotiate
with members of the project team and the organization and which include
focusing on goals, utilizing a decision-making process, knowledge of the
environment and its impact on the project, managing opportunities and threats,
and stimulating team creativity
Communications Process Table
Process
Group
ProcessName Main Outputs
Planning
Plan Communications
Management
Communications Management
Plan
Executing
Distribute Information
Organizational Process Assets
Updates
Manage Communications
Project Communications
Project Management Plan
Updates
Monitoring
and
Controlling
Control Communications
Work Performance Information
Change Requests
363.
10.1 Communication Skills
Communicationskills differ from communication management in project
management, but it’s key to successful project integration as the key pieces
of the project come together per the Project Management Plan.
• Components of communication skills can include:
• Sender-receiver model
• Feedback
• Media format
• Writing styles
• Management and
Presentation techniques
• encode
• decode
• message
• medium
• noise
364.
10.2 Communication Types
Dimensionsof Communication Activity
Type Description
Formal The formal communication should be used for the following:
legal communication and project documents (written)
when distance or extreme complexity are involved (written)
official situations (verbal)
presentations (written and verbal)
primarily one-directional communication (verbal)
Internal Communication within the project
External Communication with customer, other projects, the media, the
public
Vertical Communication up and down the organization
Horizontal Communication with peers
365.
Dimensions of CommunicationActivity (cont.)
Official Communication that is on the record, such as newsletters and annual
reports
Unofficial Communication that is not on the record
Written and oral Communication in writing or orally
Verbal and Non-Verbal Communication that conveys more than just words (inflection of voice,
body language)
366.
Communication Skills CommonlyUsed by Management
Communication Skills Commonly Used by Management
Active and effective listening
Questioning to enhance understanding
Educating to increase the project team’s knowledge, leading to increased
effectiveness
Fact-finding as a means of identification or confirmation of information
Setting and continuously managing expectations
Using persuasion to elicit desired action
Using negotiation to achieve agreement acceptable to all parties
Using conflict resolution to prevent negative impact
Using summarization, recap, and identification of the next steps to ensure
adequate understanding of information
10.3.1 Communications ManagementPlan
• The communications management plan defines the communication needs
of the stakeholders, the communications format and frequency, and who
delivers them. This communication can include reports, meeting
schedules, change processes, and contact information for the team. It lets
the team members know the communication rules and the project
expectations.
• The plan helps the Project Manager and team do the following:
– Determine communication requirements for the project
– Establish and utilize communication infrastructure for distributing
information on the project
– Report performance on the project to the appropriate stakeholders
– Deal with communication issues that arise
369.
10.3.2 Communication Control
•Controlling communication is the key to project management success.
• Although Project Managers cannot control all communication, trying to do
so should keep them in the communication loop as much as possible.
• You need to know how much Project Managers should want to control
communications, and how much they can likely control it (what % of their
time is spent on it).
• Remember, approximately 90% of a Project Manager’s job is
communication.
370.
10.3.3 Communication Model
Thebasics of communication are covered in the Communication Model.
The three main components are:
• Sender
• Message
• Receiver
371.
10.3.3 Communication Model(Cont.)
• The medium is another component to consider because it is the
medium that sets the format of the message. Communication can be
impacted positively or negatively depending on the medium of the
communication.
• Given the global nature of projects and people on projects today,
breaks in the model are not uncommon. The key responsibility of the
sender is to correctly encode (communicate) the message to the
receiver(s) so that they can (do what they are responsible for)
correctly decode (understand) it.
372.
10.3.4 Communication ChannelsFormula
The formula for this relationship is:
Channels = N*(N-1)/2
N = number of people on the project.
The following figure show how communication grows quickly as people
added to the project.
Person 1 Person 2
Person 3
Person 2Person 1
Person 4Person 3
Person 2Person 1
2 People, 1 Channel
3 People, 3 Channels 4 People, 6 Channels
373.
Communication Channel Formula(cont.)
PM has a team of 6 (count 7 people) The PM is described as “outside” the team, and the
total count must be adjusted to include the PM in the
communications channels.
Team has 6 people (count 6 people) The PM is described as within the team. No adjustment
to the total count is necessary.
374.
Communication Channel FormulaExample
With a team of 4, there are 6 channels 4 x (4-1)/2=6
If 2 people are added to the team, there is
now a team of 6 and a total of 15
channels.
(4+2) x ((4+2-1)/2)=15
Or
6 x ((6-1)/2)=15
The total number of channels added is 9. New # - Original # = # added
15-6=9
375.
10.3.5 Communication Methods
Themethods utilized to share information among stakeholders can be
divided into three primary methods:
• Interactive which enables an exchange of information between
multiple parties and fosters a common understanding between
participants
• Push which distributes information but does not ensure that the
information was received or understood
• Pull which provides information in a centrally accessible location such
as the internet
10.3.7 Meeting Rules
•Meeting rules are commonly abused. As a result, our perception on how to
handle meetings often comes from not doing it “right” because we never knew
any better. Some basic rules for meetings:
• When a meeting is scheduled, an agenda should be created and distributed
before the meeting to allow people to review and prepare for the meeting.
• People should review the agenda and prepare for the meeting.
• In (or before) the meeting, a leader should be established and that person
should lead the meeting and follow the agenda. The leader doesn’t always need
to be the Project Manager.
• Anything added to the meeting outside of the agenda should be added at the
end or to a future meeting.
• From an exam readiness perspective, if the project is a priority and a meeting
were scheduled, functional issues (generally speaking) would not delay the
meeting with the team.
10.4.1 Communication Types
Typesof Processes used in Communication
Process Description
Active
Listening
The receiver verifies with the sender that the message was interpreted correctly, by
asking for clarification or by providing feedback to the sender.
Effective
Listening
The receiver observes visual and vocal clues as well as asking for feedback from the
sender.
Feedback
The sender receives feedback from the receiver, possibly by asking additional questions
or using other methods for clarity.
Nonverbal Body and facial language
Para-Lingual Voice characteristics
Progress Reports
Progress reportsprovide information on what has been done
recently on the project.
Ex: What have we done in the last week? (The results of the
week)
382.
Progress and StatusReports
Progress reports provide information on what has been done recently on
the project. Ex: What have we done in the last week? (The results of the
week)
Status reports provide information on the present overall state of the
project.
383.
Forecasts Reports
Forecast reportsprovide information on what is expected to be happening on
the project which can include:
• Time series which base future outcome estimates on historical information
• Causal/econometric which base outcome estimates on underlying factors
(weather impacts outer-wear sales)
• Judgment which base outcome estimates on opinion, probability, and
intuitive judgment (scenario building, surveys, Delphi method)
• Other methods such as ensemble forecasting, probabilistic forecasting, and
simulation
• Forecast reporting associated with cost can include Estimate at Completion
(EAC), Estimate to Complete (ETC), Variance at Completion (VAC).
384.
Other Types ofReports
Variance Reports
• Variance reports show the difference between what was planned to
happen and what actually happened.
Earned Value Reports
• Earned Value reports show the state of the schedule, budget, and
scope of the project at various points in time.
Risk Process Table
Process
Group
ProcessName Main Outputs
Planning
Plan Risk Management Risk Management Plan
Identify Risks Risk Register
Perform Qualitative Risk
Analysis
Project Documents Updates
Perform Quantitative Risk
Analysis
Project Documents Updates
Plan Risk Responses
Project Documents Updates
Project Management Plan Updates
Monitoring
and
Controlling
Control Risks
Work Performance Updates
Change Requests
Project Management Plan Updates
390.
11.1 What isa Risk
• Risk is an event that has some degree of uncertainty.
• It may or may not have occurred.
• The objective of assessing risk is to offset any negative impact it may have and
pursue any positive impact. A risk also has good and bad characteristics.
• An example of a negative risk would be relying on a piece of software that is not
available when needed or as planned, forcing the team to come up with an
alternative.
• An example of a positive risk event might be accommodating the growth that
results when the sales of a new product exceeds expectations.
11.2.1 Risk ManagementPlan
The plan is used by the project manager and team to:
• Define the methodology, tools (such as a risk register) and data sources
used to perform risk management
• Identify risk categories (grouping of potential causes of risk) by using a Risk
Breakdown Structure (RBS)
• Define the probability and impact matrix, as well as its thresholds
• Determine when and how to perform quantitative risk analysis, expected
monetary value (EMV), and decision tree analysis
• Establish risk owners and detail the responsibilities of each risk owner
• Plan when and how often risk information will be gathered, tracked,
managed and controlled throughout the lifecycle of the project.
393.
11.2.2 Risk BreakdownStructure (RBS)
The RBS is a decomposition of the risk categorization and the risks
within those categories that could occur on a project.
394.
11.2.3 Risk ImpactScale
The threshold information in the table is an example only. Specific thresholds would be
determined by appropriate party.
Low Medium High
Probability 0 to 0.33 0.34 to 0.66 0.67 to 1.00
Project Objective
(Impact)
Low Medium High
Scope Minimal changes Significant changes for
functionality
Potentially useless product as
built
Time 5% or less delay 6% to 15% delay 16% or greater delay
Cost 5% or less increase 6% to 15% increase 16% or greater increase
Quality Quality slippage minimal Slippage requires sponsor
sign off
Product is basically useless
395.
11.2.4 Uncertainty
• Uncertaintyis a component of risk that deals with the amount of
information known (or unknown) about the outcome.
• This could mean there is very little that is not known about a possible
outcome to not having a clue as to what can happen in the case of a
risk event.
396.
11.2.5 Types ofRisk
Type Description
Pure Risk
Pure risk is a risk for which insurance can be purchased,
thereby transferring the risk for financial benefit to the
party accepting the risk.
Business Risk
Business risk is typically uninsurable. It is what a business
does when it opens its doors everyday for business. It’s the
process of doing business, for example. Think of it this
way: when was the last time you could buy insurance for
sales projections?
397.
11.2.6 Risk andContracting
• There is a belief that if a company outsources a piece of work, the provider
assumes the risk and the purchaser has no risk.
THIS IS NOT THE CASE.
• When outsourcing, a buyer (organization) can minimize risk exposure, but some
risk remains plus a new risk exposure.
• An example of the new risk would be the seller not being able to provide the
services as promised.
• See the Procurement chapter for more information about risk as it relates to the
buyer, seller, and contracting.
398.
11.2.7 Risk Toleranceand Perspective
Type Description
Risk-Averse
Risk-Averse is a mentality of risk avoidance. Selecting the
low risk item or the sure thing is typical in this case.
Risk Seeker
Risk Seeker is a mentality of looking for risk, or worse case,
not being afraid of it. This is typically the early adopter of
new products or the person or company this is willing to go
for an all or nothing approach to an initiative.
Risk-Neutral
Risk-Neutral is a middle ground mentality toward risk. It can
shift toward either seeker or averse depending upon the
situation but usually falls in the middle.
11.3.1 Risk Register
Therisk register is a project document created during the risk planning
processes. It evolves as the risk management processes and the project
evolve, and it contains the following:
• Risks
• Triggers
• Probability (Likelihood) and Impact ($) from risk analysis
• Planned Responses
• Risk owners
It evolves as the risk management processes and the project evolve.
401.
11.3.2 Diagramming Techniques
Diagrammingtechniques may be used to help decompose or categorize
risk. This could result in utilization of a number of techniques to lean an
appropriate amount of information about the risk of the project.
Examples could include:
• Cause and Effect (Ishikawa) diagrams
• System or Process Flow Charts
• Influence Diagrams, which show graphical relationships associated
with process timing and interactions.
402.
11.3.3 Risk Triggers
•Risk Triggers are the characteristics which indicate that a risk event is
possible in the near feature.
• Typically, these triggers are identified when the risks are identified.
• As you monitor project progress and notice a trigger, you know that a
risk event could occur soon.
403.
11.3.4 Risk Reviews
•Risk Review is the process of reviewing the documented risks and the
project for any new risks.
• This review helps ensure that the documented risks are still risks, and
that their ranking, characteristics, probabilities, and impacts haven’t
changed.
11.5.1 Probability
• Probabilityis the likelihood that something will happen.
• Below are characteristics of a Probability:
– In non-statistical language, it is: “What are the odds of this happening?”
– It is usually measured in percentages (0 to 100%) or real numbers (0.0
to 1.0)
– Its is equal to 100% or 1.0, which means that you are looking at all
possible outcomes
– It can also be measured in low, medium, and high or some other non-
numerical method if the numerical detail doesn't fit the situation.
408.
11.5.2 Impact
• Impactis the consequence or amount at stake if something does happen.
• For example, if the government denies a request to approve a new drug for a
specific disease, what is the impact on the company?
• Impact can be good as well.
• Think back to the dot-com era when there was a commercial with a company
launching its web site, and the team members were all standing around
watching the sales counter.
• After jumping into the thousands in the first few seconds, they look at each
other wondering what to do. That is a good impact.
409.
11.5.3 Probability Distributions
Normaldistribution is typically used for statistical or scientific
computing.
Normal
Distribution
Beta
Distribution
0.1
0.0
Triangular
Distribution
0.1
0.0
0.1
0.0
410.
11.5.4 Decision Treesand Expected Monetary Value (EMV)
• Decision tree analysis is based on looking at the probability
and impact of all potential decisions to determine the
potential expected monetary value (EMV), or expected risk
value, of the opportunity as a whole.
• This is accomplished by multiplying the probabilities and the
impact straight across, then adding the sums of the
multiplication for that project or opportunity.
• A rule to consider is: The sum of all probabilities must equal
1.0 (or 100%). For example, 0.4 and 0.6 on Project A equal 1.0
or 100% of all possible outcomes.
11.5.5 Monte Carlo
•Monte Carlo is a mock-up technique that uses software to simulate
project characteristics.
• This simulation is typically done in the scheduling area to allow a
reserve to be determined in schedule creation.
• It could be used in other areas of the project where applicable.
413.
11.5.6 Probabilities Tables
Thetables below show the probabilities associated with cost and time
parameters for a project. Tables like this can be helpful. Instead of going
with the “gut feel” of thinking you will be ahead/behind schedule or a
little over/under budget.
$14,50025%$35,00065%
$15,00030%$40,00070%
$17,50035%$40,50075%
$20,00040%$41,00080%
$22,50045%$41,50085%
$25,00050%$42,00090%
$27,50055%$42,50095%
$30,00060%$43,564100%
Total CostTotal Cost
Confidence
Level
Confidence
Level
Quantitative Analysis For Total Budget Table
05/01/201325%09/01/201365%
05/15/201330%09/15/201370%
06/01/201335%10/01/201375%
06/15/201340%10/15/201380%
07/01/201345%11/01/201385%
07/15/201350%11/15/201390%
08/01/201355%12/01/201395%
08/15/201360%12/15/2013100%
Date
Completed
Date
Completed
Confidence
Level
Confidence
Level
Quantitative Analysis For Completion Date Table
414.
11.5.7 Tornado Diagram
•A graphical representation of
risks and their potential impact,
as determined by a sensitivity
analysis, on the project.
• Sensitivity analysis determines
risk impact by considering how
much the uncertainty of each
project element impacts a
particular project objective
when the other elements
remain at their baseline values.
Risk Management Terms:Reserve Types
Risk Management Known and Unknown Table
Name Created For Description Example
Contingency
Reserves
Known
Unknowns
For risks events
that you know can
happen on a
project
Something costing more
than planned, taking
longer than planned, or
scope creep
Management
Reserves
Unknown
Unknowns
For risks events you
cannot forecast
potentially
happening on a
project
Something you cannot
envision happening on a
project, such as a natural
disaster or terrorist
attack
11.6.1 Residual Risk
Residualrisk is the amount of risk remaining after a risk response
(from the risk response plan) has been implemented.
11.6.2 Secondary risk is a jeopardy that results from the
implementation of a risk response. In the medical example, it is
side effects from a treatment.
11.6.2 Workaround is an action when a risk response and any backup
plans don’t work. It is the reactive “wing it” response.
419.
11.6.4 Risk Owner
•The Risk Owner is the person responsible for a risk event if it happens
and is similar to the person responsible for completing an activity.
• Risk Owners know beforehand that they own particular risk events.
• They know that, if those events happen, they are responsible for
implementing the response.
420.
11.6.5 Risk ResponseStrategies
• The following strategies are those recommended by PMI to use in
planning risk responses.
• We recommend that you memorize each response type and be able
to recognize it in a situation.
• A memory tool is SEE the ATM, as described in the following tables
(share, exploit, enhance, avoid, transfer, mitigate) on the next slides.
421.
Risk Response StrategiesFor Positive Risks or Opportunities
Risk
Response
Description Example
Share
The share strategy involves
sharing the responsibility (and
benefit) of the risk with a third
party (or parties) to maximize
an opportunity.
The technology company
formed a partnership with a
marketing company to
launch a sales campaign to
support the new product
being developed.
Exploit
The exploit strategy involves
taking steps to ensure the risk
and success of the event or
project.
The new project had the best
resources assigned to
maximize the probability of
success.
422.
Risk Response StrategiesFor Positive Risks or
Opportunities (cont.)
Risk
Response
Description Example
Enhance
The enhance strategy involves
taking steps to improve the size
or capacity of the risk event by
determining the key components
of the risk and maximizing those
components.
When sales were
exceeding projections, the
company hired more sales
people to ensure that as
many customers as
possible knew of their
products.
423.
Risk Response StrategiesFor Negative
Risks or Threats
Risk
Response
Description Example
Avoid
Avoid involves modification of
the plan so the risk doesn't have
to be dealt with.
Selecting alternative potential
vendors will keep you from
running out of inventory
Transfer
Transfer involves transferring the
risk exposure to another party.
In doing this, you do not
necessarily eliminate all risk, but
likely minimize some risk and
create some new risk as well.
Example #1: Hiring an outside
company to do something
instead of doing it yourself
Example #2: Buying insurance
for something
424.
Risk Response StrategiesFor Negative
Risks or Threats (cont.)
Risk Response Description Example
Mitigate
Mitigate minimizes the
bad characteristics of the
risk.
Eliminating outside sources and
doing the work internally would
mitigate your risk if another
company failed to meet the
deliverables on your project.
Acceptance
Acceptance involves
tolerating the risk and
dealing with it. It is a valid
option if there are no
other options available.
Determining that if a union goes
on strike, the project will have to
stop until the strike is settled.
425.
Contingent Risk ResponseStrategy
Risk
Response
Description Example
Contingent
Response
Strategy
Ideally created to be used only
if certain conditions are
present. This could be created
if conditions change on the
project or to accommodate for
worst case situations.
The team developed a
contingency plan to add staff
to the project if the
important development
milestone was missed.
Procurement Process Table
ProcessGroup Process Name Main Outputs
Planning Plan Procurement Management
Procurement Management Plan
Procurement Statement of Work
Source Selection Criteria
Make-or-Buy Decisions
Change Requests
Executing Conduct Procurements
Selected Sellers
Agreements
Resource Calendars
Monitoring and
Controlling
Control Procurements
Work Performance Information
Change Requests
Project Management Plan Updates
Closing Close Procurements
Closed Procurements
Organizational Process Assets Updates
12.1.1 Procurement ManagementPlan
• The Procurement Management Plan helps the Project Manager and
team do the following:
– Determine make vs. buy with the various needs of the project
– Establish what procurement documents (RFP, RFI, RFQ) are needed
for the project
– Create the procurement documents for the project
– Run bidders conferences
– Address single source and sole source procurement
– Select vendors to do work
– Establish a contract with vendors
432.
12.1.2 Make-or-Buy
One ofthe basic keys of procurement is the Make-or-Buy decision.
There are a number of considerations a company can use in making this
decision. Some of the basic decision point are listed below:
Make Decision Qualities
The buyer owns intellectual property associated with
the work and considers doing the work internally in
order to maintain control of the information.
The buyer has excessive qualified capacity.
Buy Decision Qualities
The buyer doesn’t possess the skills needed for the
work.
The buyer doesn’t possess the capacity to do the work.
433.
12.1.3 Rent orBuy Calculation
You may be quizzed on the calculation area of this topic. It is a
straightforward calculation. The components are typically as follows:
• Purchase cost and daily maintenance with the purchase option
• Daily (or weekly, monthly) rental fee, which usually includes
maintenance fees
• Typically, you should be prepared to calculate the point where it
makes sense to purchase, versus rent, or vice versa.
434.
12.1.3 Rent orBuy Calculation
You are the project manager for a housing developer. The
development requires a skid loader to clean out the lots where the
houses will be built. You can rent the skid loader for $100 per day
(including maintenance) or you can purchase one for $750, with a
$50 per day maintenance cost. What is the maximum time you
would want to rent this tool before considering purchasing it?
• To determine the best decision, take the variables and make a formula.
• The options are 1) rental at $100 per day or 2) purchasing at $750 with $50
per day maintenance.
435.
Rent or BuyExample (cont.)
Translate this data into a formula as follows where you solve for
variable X.
The formula is $100X = $750 + $50X and solve for X as the number of
days.
Step 1. (-$50X)+$100X = $750 or
$50X = $750
Move all of the pieces with the variable X
to one side of the equation.
Step 2. $750/$50 = X Divide to determine the value of X.
Step 3. $750/$50 = 15
Step 4. X = 15 Here is the maximum number of days you
would want to rent the tool before
purchasing it.
436.
12.1.4 Contract
• AContract is mutually binding legal agreement between buyer and seller.
Other names for a contract could be a:
• You should expect a couple of questions on this, so make sure that you
know the components of a contract, plus when a contract is in place.
• A contract has five basic components (listed in the next table).
• Without these components, a contract does not exist.
• purchase order (PO) • subcontract • agreement
437.
Contract: Five Components
ContractComponents
Contract
Component
Description
Capacity Competency, not a minor, and individual legal entities
Consideration The item to change possession from seller to buyer
Offer A proposition to exchange something, for something
Legal Purpose
The reason for the contract has to be for something
legal
Acceptance A buyer willing to accept the offer from the seller
Memory Tool:
CCOLA – Capacity, Consideration, Offer, Legal, Acceptance
438.
12.1.5 Buyer andSeller Names
Buyer Seller
Client Contractor
Customer Subcontractor
Prime Contractor Vendor
Contractor Service Provider
Acquiring Organization Supplier
Government Agency
Service Requestor
Purchaser
The table above shows a number of terms that can be used to describe
the buyer and seller. The seller’s title could also change during the
project duration.
439.
12.1.6 Contract TypeSelection
There are four main types of contracts:
• Each of these contracts can involve variations including incentives, fees, and
more.
• Selecting the wrong type of contract can spell doom for a project.
• It is imperative that you understand the types of contracts, their differences,
where they should (and shouldn’t) be applied, and the risk for both the buyer
and seller.
• Purchase Order (PO) • Time and Materials (TM)
• Fixed Price (FP) • Cost Reimbursable (CR)
440.
Contract Types
Contract
Risk for
Buyer
Riskfor
Seller
Description Example
Purchase
Order (PO)
Neutral Neutral
A unilateral agreement that requires
approval by only one party because the
other party has offered the product for
the predefined price.
Typically, a PO is used for commodity
items such as those that can be mass
produced. Some consultants have
mentioned that the workplace would
typically get a contract type sign off and
then get a purchase order. PMI® doesn’t
view this as the case, seeing a PO as a
separate contract type.
19” Computer
monitors for
$179.00 each
441.
Contract Types (cont.)
Contract
Riskfor
Buyer
Risk for
Seller
Description Example
Firm
Fixed
Price
(FFP) also
known as
Lump
Sum
Minimal Significant
One of the most common
contracts in business today,
popular because a company can
budget for a fixed price.
Because it requires detail for the
seller to estimate accurately, an
FP contract is typically used
when there is a detailed Scope
of Work. The downside for seller
is cost containment. For the
seller, everything after costs are
covered is profit.
Purchasing the
implementation of a
computer network at
your company from an
outside vendor for
$2,000,000 after
providing the seller a
detailed Scope of Work.
442.
Contract Types (cont.)
Contract
Riskfor
Buyer
Risk for
Seller
Description Example
Fixed Price
Incentive
Fee (FPIF)
Minimal Significant
A contract type with the fixed
price component described
above; includes incentives fees to
motivate the seller to produce at
a rate greater than the minimum
required.
A FPIF is usually used to help
accelerate a buyer’s need such as
a market opportunity. It provides
an opportunity for the seller to
determine what is needed to
make additional profit via the
incentive fee.
A city buying
services from a
construction
company to put in
a new freeway for
$4,000,000. For
each week the
seller finishes
before a given
date, it receives
$65,000.
443.
Contract Types (cont.)
Contract
Riskfor
Buyer
Risk for
Seller
Description Example
Fixed Price
Economic
Price
Adjustment
(FP-EPA)
Minimal Significant
A Fixed Price contract with the
similar components listed
above; associated with a multi-
year contract.
To compensate for economic
changes from year to year, the
Economic Price Adjustment is
factored in. The item
determining the amount of
change from year to year is
usually some national
economic metric not directly
tied to the buyer or the seller.
A city buys services
from a construction
company to build a
new freeway for
$4,000,000 over
three years. At the
start of each year,
the amount varies
relative to the
national cost of
living or some other
negotiated
standard.
444.
Contract Types (cont.)
Contract
Riskfor
Buyer
Risk for
Seller
Description Example
Cost Plus
Fixed Fee
(CPFF)
Medium Minimal
Typically used when the
buyer knows generally what
is need but lacks detail to
know specifically what is
needed to built it.
The CPFF covers the costs of
the seller and includes a
predefined fee for the work.
A buyer hires a vendor to
produce a video training
series but is not yet sure of
all the detail needed and
agrees to pay the vendor for
costs plus a $37,000 fee.
445.
Contract Types (cont.)
Contract
Riskfor
Buyer
Risk for
Seller
Description Example
Cost Plus
Incentive
Fee
(CPIF)
Medium Minimal
Typically used when the buyer
knows generally what is needed but
lacks any details to know specifically
what is needed to build it.
Generally, the buyer has some sort
of need which requires that
something created as soon as
reasonably possible. The incentive
fee gives the buyer an opportunity
to motivate the seller to complete
the project quicker, to higher quality
standards, or other criteria.
A buyer hires a company
to write a manual for
publication and sale.
Due to a market
opportunity, the quicker
to market, the higher
the sales. The buyer
agrees to pay costs plus
an incentive fee of
$7,500 for each week
the project is done
before the estimated
completion date.
446.
Contract Types (cont.)
Contract
Riskfor
Buyer
Risk for
Seller
Description Example
Cost Plus
Incentive
Award
(CPAF)
Minimal Significant
Covers the seller for legitimate
costs, but majority of fee is only
awarded based on buyer’s
satisfaction with broad
subjective criteria detailed in
the contract
A buyer agrees to pay
for costs incurred for a
freeway bridge. Due to
the people impacted, if
the seller meets the
agreed on date and
completed the bridge
with minimal negative
impact to the
environment, the buyer
will award the seller an
additional $500,000.
447.
Contract Types (cont.)
Contract
Riskfor
Buyer
Risk for
Seller
Description Example
Cost Plus
Percentage
of Costs
(CPPC) or
Cost Plus
Fee (CPF)
Significant Minimal
Covers the seller costs for
building something for a
buyer and pays them a
percentage of the total costs
as a fee.
The more the seller spends,
the higher the fees. Most
companies will not enter into
this type of contract because
it can negatively impact the
buyer if the seller is not
ethical.
A buyer hires a
company to install a
computer network for
500 users and agrees
to pay for the costs of
the seller and 17% of
all costs for a fee.
448.
Contract Types (cont.)
Contract
Riskfor
Buyer
Risk for
Seller
Description Example
Time and
Materials
(T&M)
Minimal Minimal
Typically used for smaller
initiatives, staff
supplementation, or the initial
piece of a project where the
discovery occurs before the full
details of the project are
known; can also be used for
materials on an initiative to
complement the labor.
Staff
supplementation of
a technical writer at
$75 per hour, or
having a bathroom
added to your
house at $50 per
hour and the cost of
materials
449.
Advantages & Disadvantages
AdvantagesDisadvantages
What Are the Advantages and Disadvantages of a T&M Contract?
What Are the Advantages and Disadvantages of a CR Contract?
What Are the Advantages and Disadvantages of a FP Contract?
Advantages Disadvantages
Advantages Disadvantages
450.
Answers
Fixed Price Time& Materials Cost Reimbursable
Advantages Advantages Advantages
Less work for buyer to manage Quick Lower cost because no extras added
for risk
Seller has a strong incentive to control costs Brief contract Less work to write the Procurement
SOW
Companies have more experience with this
form
Good choice when you are hiring
“bodies” or people to augment your
staffBuyer knows the total price
Disadvantages Disadvantages Disadvantages
Seller may “cut” scope Profit is in every hour billed Requires auditing
Seller may charge extra on change orders Seller has no incentive to control costs More work to manage
More work for buyer to write the Scope of
Work
Appropriate only for small-size
projects
The total price is unknown
More expensive than CR because of
additions seller adds for risk
Seller has only a moderate incentive to
control costs
12.1.8 Point OfTotal Assumption
Point of Total Assumption Variables and Calculation
Purpose
To calculate the maximum that a buyer pays in a fixed-price
incentive fee (FPIF) contract when taking into consideration the
share ratio on cost overruns
Target Cost (TC) The expected cost of the work in the contract. (Ex: $1M)
Target Profit (TP) The expected profit of the work in the contract. (Ex: $200,000)
Profit Rate at
Target Cost
The profit margin of the target profit compared to the target cost
(target profit/target cost) (Ex: 20%)
Target Price
The total of the target cost and target profit; should be the total
target value of the contract work barring any overruns or under runs
(Ex: $1,200,000)
453.
Point Of TotalAssumption Variables
Point of Total Assumption Variables and Calculation
Ceiling Price
A percentage of the target cost (TC).
This is the maximum total amount the work is expected to cost with any
cost overruns being considered. (Ex: 140% of cost or $1,400,000)
Share Ratio
(SR)
The ratio between the buyer and seller for any cost savings or overruns
that impact the total contract amount and profit. (Ex: 70/30)
Point of Total
Assumption
(PTA)
The total amount of money the buyer will pay regardless of cost overrun
on the contract.
The formula is in the cell below. (Ex: $1,285,714.29)
Point of Total
Assumption
Formula
PTA=(Ceiling Price-Target Price)/Buyer Share + Target Cost
$1,285,714.29=(($1,400,000-$1,200,000)/0.70)+$1,000,000
NOTE: The difference between ceiling price and target price is indeed
divided by the buyer’s share. This is not an error.
454.
12.1.9 Scope ofWork
• A Scope of Work is the part of the contract that describes what the
seller will do for the buyer.
• When the Scope of Work is done or completed, the main work of the
project is done and closing can begin.
• Because the level of detail and planning can vary among contracts,
you can take several different approaches to develop the Scope of
Work in the contract.
455.
Scope of WorkApproach: Design
Scope Of Work
Scope Of
Work
Description Example
Design
A Scope of Work type in which the buyer
provides the seller with the exact details of
what is required
Design is typically used when buyers know
exactly what they want and want no
variance from specifications. It typically will
works with Fixed Price contracts.
A company hires a vendor to
build a prototype cabinet to
house telecom equipment.
The buyer provides the
seller with specifications of
what is to be built; it must
hold a number of devices
already created.
456.
Scope of WorkApproach: Functionality
Scope Of Work
Scope Of
Work
Description Example
Functionality
A Scope of Work type in which the
buyer details to the seller the
functionality needed in the new system
or development
Functionality allows sellers to propose
their own solutions as long as the end-
results are achieved.
It typically works with Cost Plus (CP)
contracts.
A company hires a vendor to
implement a phone system for
them. It provides the needed
functionality requirements to
the vendor, and as long as
those are met, it allows the
vendor the flexibility to build a
solution as the vendor sees fit.
457.
12.1.10 Procurement Documents
Document
Type
TypicalPurpose Description Example
Request for
Information
(RFI)
Typically used to
solicit information
to learn more
about a company
that could provide
service for a buyer
A document requesting
information on a service
provider’s qualifications
so a buyer can review
them
A request from a state
government to see if a
consulting company has
the appropriate
experience in an area to
bid for a potential
project.
458.
12.1.10 Procurement Documents
Document
Type
TypicalPurpose Description Example
Request for
Quote
(RFQ)
Typically used to
solicit proposals for
a small dollar
amount or used for
commodity type of
products that do
not require a great
degree of
customization.
A document that
requests a price for a
standard item.
There is a general
assumption that
negotiation is not
associated with this
type of procurement
document.
A request for prospective
sellers wishing to provide
pricing for customer-
established server
criteria: Quantity 50 XYZ
Servers with 1Gig RAM,
200G hard drive to be
purchased within 90 days
of submittal.
459.
12.1.10 Procurement Documents
Document
Type
TypicalPurpose Description Example
Request for
Proposal
(RFP)
sometimes
called Request
for Tender
(RFT)
Typically used to
solicit proposals for
bigger, higher priced,
customized services
or products
Generally, the seller
describes the detailed
approach to the
solution for the buyer,
including previous
experience in the
area.
A document that requests
an approach, price, and
significant detail about
how the seller proposes
to do the requested work
The general assumption is
that negotiations occur
based on scope, time,
and cost of what the
buyer requested and
what the seller
suggested.
A request for a proposal
to prospective sellers for
design, implementation,
and training for a data
warehouse to consolidate
five different enterprise
databases at fortune 500
company named Widgets
Inc.
460.
12.1.10 Procurement Documents
DocumentType Typical Purpose Description Example
Invitation for
Bid
(IFB)
sometimes
called Request
for Bid (RFB)
Used for
government sealed
bidding processes
with characteristics
similar to those for a
RFP (Request for
Proposal)
A document that
requests an approach,
price and significant
detail about how the
seller proposes to do the
requested work
The general assumption
is that negotiations occur
based on scope, time and
cost of what the buyer
requested and what the
seller suggested.
A request from a branch
of the U.S. government
for a proposal to sellers
for design,
implementation, and
training of an Enterprise
Reporting System
The selection process is
sealed bid and the
contract is awarded on
May 25, 2008
12.2.2 Bidder Conference
Biddersconferences are meetings during which companies considering bidding on a project
can ask a buyer any questions and get clarification on any potential issues before creation of a
proposal.
A conference:
– Can also include a formal presentation by the buyer
– Should allow the potential sellers to be able to ask any questions
– Should make all the questions and answers available to anyone considering bidding on
the project.
Buyers representatives need to be sure to make all questions and answers public to all
potential sellers as well as take all reasonable steps to ensure that potential sellers do not
collude together on unfair pricing. This collusion could include Company A shooting high on a
price to allow Company B to get the work for this project with the understanding that their
roles will switch on the next project.
463.
12.2.3 Non-Competitive Formof Procurement
• Non-Competitive Procurement is done when there is only one source for
the products, or the buyer has an established relationship with the seller
and there are mechanisms in place to ensure that the buyer of the
products or services attains a fair price.
• If a vendor is selected without competition, there is a chance of
inappropriate selection and unreasonable pricing, so there should be a
mechanism in place to assure that appropriate actions are taken in this
area.
• The two main categories in this area are: sole source and single source.
464.
Two Main Non-CompetitiveCategories
Sole Source Single Source
This involves using a company that has no
other competition for whatever you are
acquiring from it.
This company could be one that owns a
patent or some other type of intellectual
property associated with what you are
purchasing.
This involves choosing a partner you prefer
to work with or deciding not to look for
competition.
Whatever you are purchasing from them
might be available from others, but for
whatever reason you have decided not to
look at others for providing of the services.
This could be a situation where there is a
vendor you prefer, or you might not have
time to go through the full process to find
others to do the work.
465.
12.2.4 Incentive Fees
•Incentive Fees are those that a buyer of services can use to get the
seller aligned to a similar standard of productivity.
• They are typically a premium that the buyer will pay to seller above
the base price of the contract.
466.
12.2.5 Negotiations
Negotiation
Strategy
Description
Competition
Using oneseller (fictitious or real) against another to attain the best
price or other terms the buyer desires
Deadline
Using a fictitious or real deadline to attempt to get a party to sign a
contract
The Boss is
Missing
Stating that another person who is key to approving something is not
there, is busy, or otherwise unable to be involved
467.
12.2.6 Agreements (Previouslycalled Contract Award)
• Each selected seller is awarded a procurement contract which is:
• A legally binding agreement obligating the seller to provide one or more
specified products, services, or results
• Obligates the buyer to compensate the seller
• Subject to remedy in the courts.
• Components of a contract may include a statement of work or
deliverables, performance reporting, period of performance, schedule
baseline, roles and responsibilities, seller’s place of performance, place of
delivery, pricing , payment terms, inspection criteria, acceptance criteria,
warranty, product support, liability limits, fees and retainage, penalties,
incentives, insurance/performance bonding, approval terms for
subordinate subcontractors, handling of change requests, and termination
and alternative dispute resolution (ADR) mechanisms.
468.
12.2.7 Standard Termsand Conditions
• These are typically common (non-negotiable) contract items.
• They can include negotiations but will generally have a tight range of
parameters from the company’s legal department.
This range could cover items such as:
• Payment options
• Intellectual property rights
• The ability to sub-contract
469.
12.2.8 Special Provisions
•Special Provisions are items typically added to account for any
Standard Terms and Conditions that will not meet the needs of the
work involved.
• The buyer and seller negotiate these provisions, which would
complement any workable Standard Terms and Conditions that
would already have been defined as acceptable in the contract.
470.
12.2.9 Contract Interpretation
•Contract Interpretation can keep you out of court or put you right in
it.
• Generally, the Contract Administrator should understand what is
defined in the contract, with their interpretation in line with general
legal opinion.
12.3.1 Contract Administrator
•The Contract Administrator is the manager of the contract.
• Their main responsibility is to protect the integrity and purpose of he
contract.
• Think of the contract as the law and the Contract Administrator as
the contract enforcement or police.
473.
12.3.2 Project Managerin the Administer Procurement Area
• Role of the Project Manager: Helps ensure successful execution of
the contract typically work with the Contract Administrator to
accomplish the successful execution as the scope, terms, and
conditions of the contract are defined and as work results become
complete responsible for delivery of the project deliverables BUT
they cannot change the contract.
• Only the Contract Administrator has the power to change the
contract.
474.
12.3.3 Centralized Vs.Decentralized
The environments have different positives and negatives for a contract
administrator. The characteristics are similar to those of a PMO and
being on a standalone project, or being the only project manager in a
small company.
Centralized Contracting Decentralized Contracting
Contract Administrators support each
other
Contract Administrator is alone on a
project without support of other
Contract Administrators
They have career paths The position is viewed more as a need
instead of a career type position
They have a great degree of shared
expertise
The Contract Administrator is the only
one on the project.
Stakeholder Process Table
ProcessGroup Process Name Main Outputs
Initiating Identify Stakeholders Stakeholder Register
Planning Plan Stakeholder Management Stakeholder Management Plan
Executing
Manage Stakeholder
Engagement
Issue Log
Change Requests
Project Management Plan Updates
Monitoring and
Controlling
Control Stakeholder
Engagement
Work Performance Information
Change Requests
Project Documents Updates
OPA Updates
13.1.1 Balancing StakeholderInterests
The really challenging questions could go to the point of determining if
the project actually continues, or is radically altered. In these cases,
refer to the following rules in this order:
•Why is the project being done? What is the market condition or
business need? Why is it a priority compared to other projects?
•What does the project charter and foundation of the project describe
to do?
•What does the project management plan say?
481.
13.1.2 Dealing withProject Change Requests
With regard to addressing project-specific changes, the following order
should help ensure success:
1. Never tell the customer/sponsor “no” when asked about a request. If
the customer/sponsor is willing to encounter a delay or pay more to
implement the change, it is the decision of the customer/sponsor
2. Listen to the customer/sponsor regarding their requests
3. Involve the appropriate team members to determine the options
associated with the request and their impact
4. Communicate them to the customer/sponsor
5. Let the customer/sponsor make the final decision based on the
options you have provided them
13.2.1 Stakeholder AnalysisMethods
The power/interest grid graphically illustrates which stakeholders need
to be kept satisfied, managed closely, monitored, or kept informed
based on the level of their power and their interest in the outcome of
the project. High
Power
Low
InterestLow High
Keep
Satisfied
Manage
Closely
Monitor
(minimum effort)
Keep
Informed
Stakeholder A Stakeholder C
Stakeholder BStakeholder D
Stakeholder E
Stakeholder F Stakeholder G
484.
13.2.2 Stakeholder Register
•The stakeholder register is used to manage an increase in the
positive impact of and a decrease in the negative impact of
stakeholders.
• A typical register includes the stakeholder name, level of
interest in the project, level of impact on the project, and
strategies to gain support or minimize negative impact.
Stakeholder Level of Interest Impact Assessment Strategies
13.3.1 Stakeholder ManagementPlan
The plan helps the project manager and team:
• Compare the current and desired level of key stakeholder
engagement
• Identify interrelationships between stakeholders
• Identify stakeholder communications requirements
• Update the stakeholder management plan when needed
487.
13.3.2 Stakeholder EngagementAssessment Matrix
The stakeholder engagement assessment matrix is used to
compare the current and desired level of stakeholder
engagement. The matrix helps focus the team on stakeholder
interaction. As the project evolves, the objective is to have the C
(current) and D (desired) in the same cell for each stakeholder.
Manage Stakeholder Engagement– (Cont.)
Key Tools &
Techniques
Communication
Methods
Communication methods are determined for each stakeholder in the
communications management plan. The project manager reviews
each stakeholder’s communications needs and determines which
methods will be used, how they will be used, and the frequency with
which they are used. The methods include interactive, push, and
pull communications.
Interpersonal
Skills
Interpersonal skills are used to manage stakeholder expectations.
They include the establishment of trust, the settlement of conflict,
active listening, and the mastery of resistance to change.
Management
Skills
Management skills are used to ensure the adaption of the group to
accomplish project goals. Management skills include facilitation,
negotiation, influence, and the ability to modify behavior.
PMI® Code ofEthics and Professional Conduct
TIP: What YOU would do in the real world may not align with the PMI®
Code of Ethics and Professional Conduct. Answer EACH question by
considering “What does PMI® say to do?”
Applies to all:
• PMI members
• Non-members who:
– hold a PMI® certification.
– apply to commence a PMI® certification process.
– serve PMI® in a volunteer capacity.
493
494.
Structure of theCode
The Code of Ethics and Professional Conduct is divided into sections
that contain standards of conduct which are aligned with the four
values that were identified as most important to the project
management community.
• Responsibility
• Respect
• Fairness
• Honesty
494
495.
Responsibility
Responsibility is ourduty to take ownership for the decisions we make
or fail to make, the actions we take or fail to take, and the
consequences that result.
• We inform ourselves and uphold the policies, rules, regulations and
laws that govern our work, professional, and volunteer activities.
• We report unethical or illegal conduct to appropriate management
and, if necessary, to those affected by the conduct
495
496.
Respect
• Respect isour duty to show a high regard for ourselves, others, and
the resources entrusted to us.
• An environment of respect engenders trust, confidence, and
performance excellence by fostering mutual cooperation.
– We negotiate in good faith.
– We do not exercise the power of our expertise or position to
influence the decisions or actions of others in order to benefit
personally at their expense.
– We do not act in an abusive manner toward others.
– We respect the property rights of others.
496
497.
Respect Differences inDiverse Cultures
• Global competition
– Global marketplace
– Heightened awareness of cultural influences and customary practices of
host country
– Practice the golden rule, “Do unto others as you would have done to
you”
• Culture shock
– Expect disorientation when normal events may be different from your
culture
– Study the culture of the country you will be visiting
– When in doubt, ask questions
497
498.
Respect Confidential Information
•Company data
– Non-disclosure agreements
– Uphold personal and organizational privacy
– Personnel information
– Trade secrets
• Intellectual property
– Copyrighted material
– Ideas
– Patents
498
499.
Fairness
• Fairness isour duty to make decisions and act impartially and
objectively. Our conduct must be free from competing self interest,
prejudice, and favoritism.
499
500.
Honesty
• Honesty isour duty to understand the truth and act in a truthful
manner both in our communications and in our conduct.
500
What Are TheRisks For Taking the PMI® Exam?
• Delay in taking the exam
• Confusing myself when trying to answer the questions.
• Changing my mind at the last minute
• Not passing and not being able to take it again before my application
expires
• Not knowing the inputs and outputs of each process
• Panicking and getting everything confused
• Forgetting everything! Freezing up!
• Concern about fully understanding the context of the question
• Not having enough time to complete the exam
• Remove myself from the seller’s perspective
503.
How to TakeThe Exam
• Attack the exam by being in attack mode
• Mark and skip questions relating to your gaps and do
them later
• Mark and skip questions you cannot understand but
always choose an answer
• Do not let emotions get in your way
• Feel in control
• Do not let your surroundings distract you
504.
It’s Time toTake a Test
Instructions:
• Close or put away all papers and books except your
score sheet in the supplemental materials
• Take a breath and pretend it is the real exam
• Be quick, as the questions will not stay on the screen
for very long
• Go!
505.
Did You RememberHow to Take the Exam?
1. Attack the exam; do not let it control you
2. Read the question only once
3. Read all the choices
4. Look for two right answers
5. Mark and skip questions you cannot understand but
select an answer
506.
What Is Goingon in Your Head?
• I’m not fast enough
• I will never get this
• I will fail
• Oh no, a formula question
• That other question still bugs me
• I am sure I got that other question wrong
Thoughts like these waste brain power
and hurt you on the exam!
507.
Common Exam Fears
•Running out of time
• Questions with two right answers
• Unknown unknowns
• Test anxiety/panic
• Inputs and outputs
• Remembering the formulas
508.
Running Out ofTime
• Almost no one runs out of time because you have the
Exam Simulation software to practice timing.
509.
Questions with TwoRight Answers
• Everyone has difficulty with questions with two right
answers, but you will be less bothered if you notice
these when using the exam simulation and work to
reduce the problem for you.
510.
Unknown Unknowns
• So,what if there are two questions that are out of the
blue on the exam? Do you actually expect that taking a
major exam like this will ever be easy?
• Expect questions that are not understandable and just
say to yourself, “What sick, demented person wrote this
one?” Mark it, and move on to the next question.
• You will also see topics on the exam that you do not
know. You would need to study for three years to cover
everything. Is this a good use of your time?
511.
Test Anxiety/Panic
• Panicis a personal issue. Did you panic here? If you
think panic is a concern for you, make sure you
simulate the actual exam in your mind when using the
exam simulation software.
• If you felt yourself panicking during this exercise, take
tests in a situation similar to the actual testing
environment. Try a library.
512.
Inputs and Outputs
•Use the Mindmap Charts and realize that if you know
project management most inputs and outputs are just
common sense.
513.
Remembering the Formulas
•Most test takers report that there are only about eight
calculations on the exam.
• Most formulas relate to earned value.
• In most cases, if you take the exam within three
months, you already know enough about earned value
to answer most of those questions.
514.
What You ShouldRemember
#1 - Pick a target date to take the exam -Take the exam within three
months after this class
#2 - Create a study plan and follow it!
#3 - Focus, Focus, Focus - Get into a study group
• Understand your own learning style and use the most appropriate
materials – Crosswind Bootcamp Manual, PMBOK® Guide v5.0
including Page 61 & Glossary of Terms, Mindmaps, Flashcards, ITTO
Matching Exercises, Quick Reference Guide, “Brain Dump” Sheet,
Exam simulators
515.
Good Luck!
On yourPMP® / CAPM® exam
Don’t forget to fill out your evaluation of this class