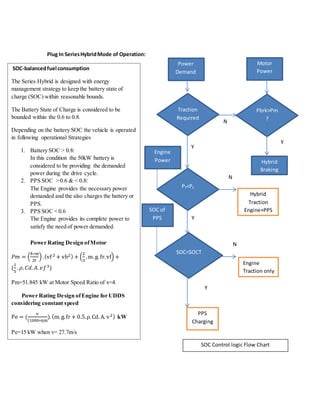
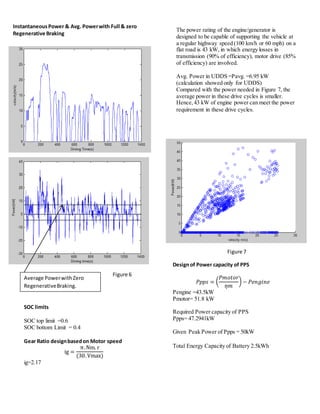
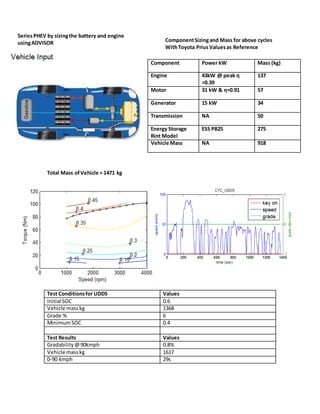
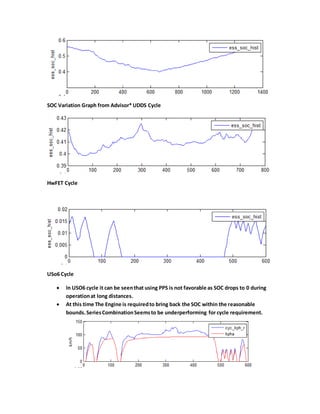
Downloaded 14 times
![CriteriaSatisfaction & Performance Targets. For 100KW IC Engine Vehicle
Performance/Utility Category Vehicle Modeling Design
Targets*
Achieved Targets
Energy consumption
(unadjusted energy use on
combined Federal Test
Procedure [FTP] city and
highway cycles)
Better than 370 Wh/km (600
Wh/mi) combined city and
highway (55%/45%,
respectively)
Energy Consumption Better
than 370Wh/km
GHG emissions (WTW
combined city and highway
cycles)
Less than 120 g of carbon
dioxide equivalent (CO2
eq)/km (200 g CO2 eq/mi)
Yes, all emissions well below
the limit ( refer above figure
for comparison with values
calculated)
Range Greater than 320 km (200 mi)
combined city and highway
Yes Range achieved in all
cases is greater than 320 km.
Maximum speed Greater than 135 kph (85
mph)
Yes maximum Speed is
greater than 135 km/h
Acceleration time of 0 to 97
kph (0 to 60 mph)
Less than 11 seconds 12.7
Highway grade ability (at
gross vehicle weight rating
[GVWR])
Greater than 3.5% grade at a
constant 97 kph (60 mph) for
20 minutes
Yes Grad ability greater than
3.5%
Part B: Downsizingof Engine:
Engine Downsizingis the way to make small enginesperformhigh.
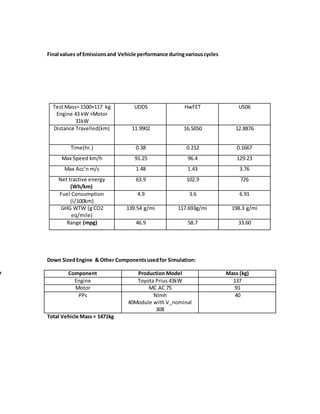
Test Mass =2000 kg
Engine Power 150kW
UDDS
Distance Travelled(km) 11.9902
Time(hr.) 0.38
Net tractive energy (Wh/km) 66.4
Fuel energy (Wh/km) NA
Battery energy (DC Wh/km) 3
GHG WTW (g CO2 eq/mile) 83.1(131.54 g/mi)](https://image.slidesharecdn.com/e643cd77-08aa-4bd8-92a6-ee92200ce658-160509191916/85/Plug-In-Hybrid-Simulation-7-320.jpg)

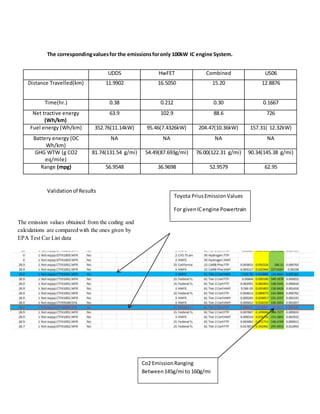
This document discusses the energy requirements and powertrain design for a plug-in hybrid electric vehicle (PHEV). It first estimates the energy needed at the wheels by simulating the vehicle's performance on various drive cycles. It then sizes the engine and electric motor based on these energy needs. For the engine, it selects a 100kW gasoline engine similar to that in the 2010 Toyota Prius. It models the Prius powertrain configuration and calculates performance metrics like acceleration and top speed. Finally, it evaluates the vehicle's emissions and fuel economy on the drive cycles to validate that it meets targets.