Download to read offline


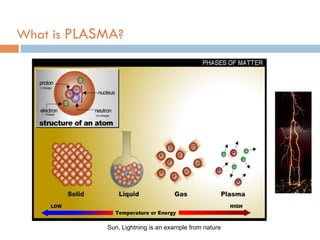
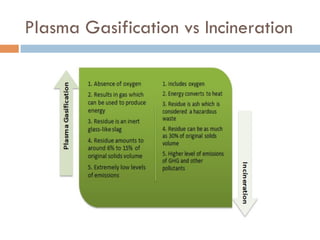
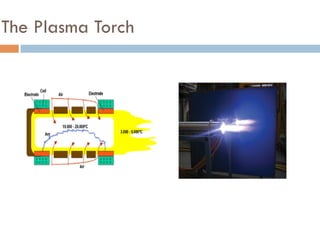
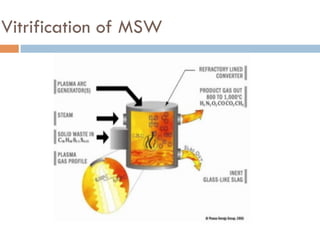

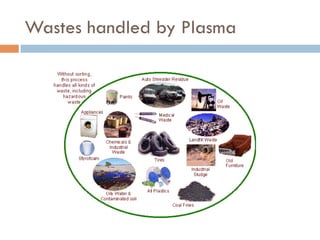
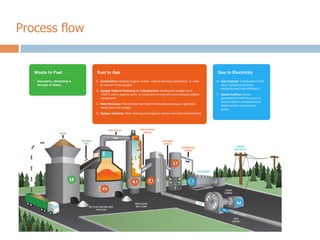
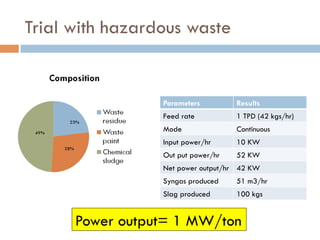

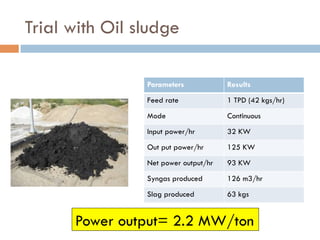
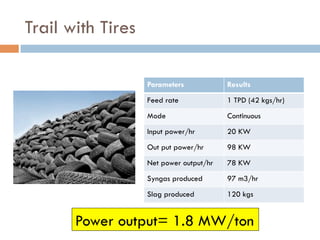


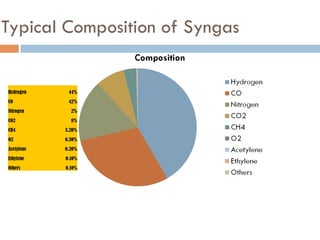

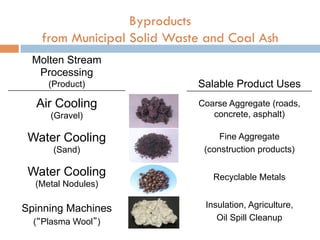
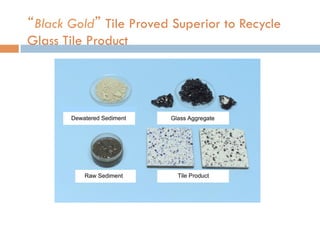
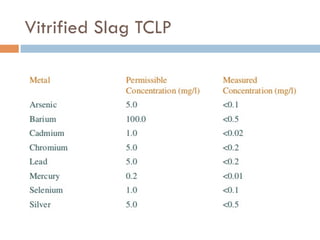

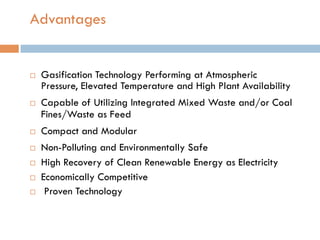


This document discusses plasma gasification technology. It provides information on the global scenario of plasma plants, the origin and definition of plasma, comparisons to incineration, the plasma torch process, types of wastes that can be handled, trial results with different waste streams producing syngas and vitrified slag, system components and process flow, typical syngas composition, low emissions, byproducts, GHG offsets, advantages, standard model sizes, a pilot facility, past projects, current projects underway, an R&D partnership, and contact information for the technology provider.


