Downloaded 221 times
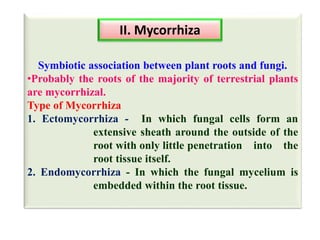
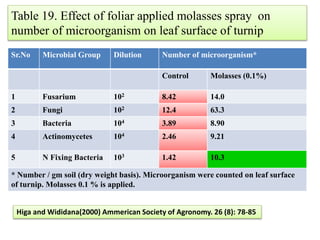
![Table 4 Nutrient (N or P) use-efficiency (mg biomass/mg N or P recovered) of non-mycorrhizal P
fertilized (PO4
3−) or mycorrhizal plants with Glomus mosseae, G. intraradices or G. deserticola either
non-inoculated or inoculated with bacteria [Bacillus pumillus (BP) or Bacillus licheniformis (BL)]
N use-efficiency P use-efficiency
-- BP BL -- BP BL
PO4
3− 181 ± 6.7 - - 804 ± 8.0 - -
Control 271 ± 4.9 428 ± 14.8 485 ± 27.8 1083 ± 4.3 200 ± 25.2 2100± 50.0
G. mosseae 500 ± 28.9 259 ± 3.8 342 ± 5.7 1191± 58.4 1200± 57.7 1271± 73.1
G. intraradices 239 ± 5.5 208 ± 9.9 244 ± 4.5 1069± 91.4 1141± 17.3 1000± 62.9
G. deserticola 321 ± 5.9 256 ± 3.1 309 ± 8.6 1091± 67.7 1107± 42.9 1058± 103.2
Source: Medina et al (2003) j. Applied Soil Ecology . 22 (2): 15-18.](https://image.slidesharecdn.com/plantmicrobeinteractionbydr-190920045954/85/Plant-microbe-interaction-by-dr-ashwin-cheke-35-320.jpg)
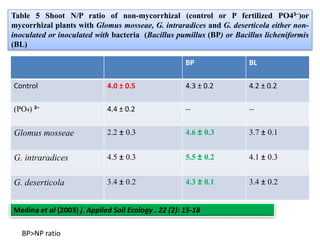
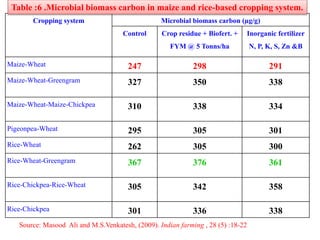
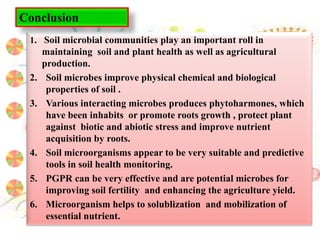


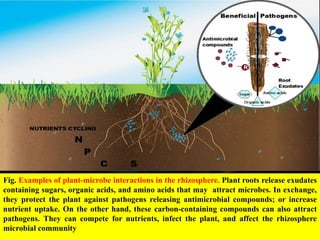
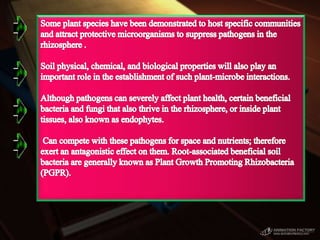
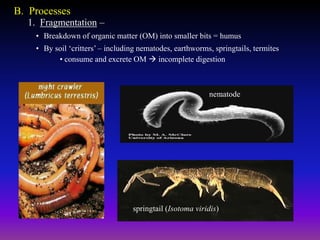
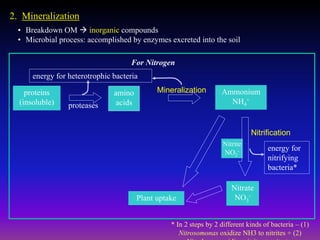
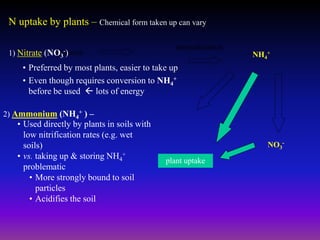
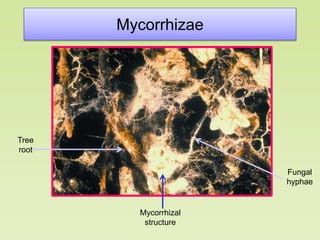
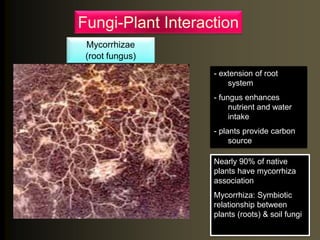
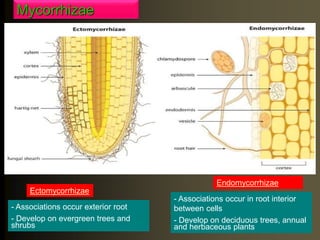
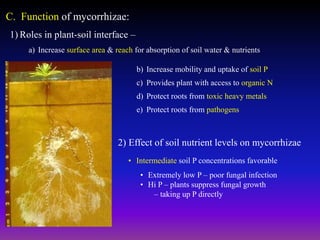
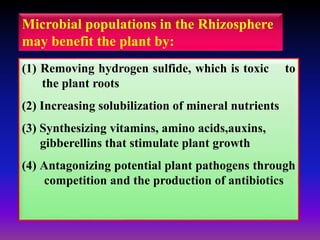
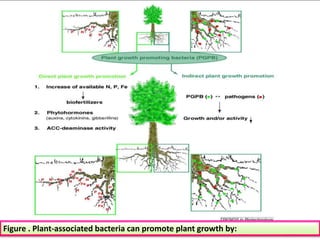
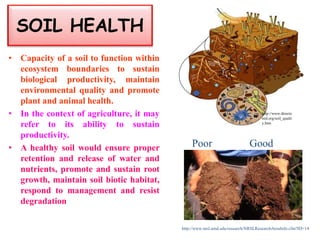
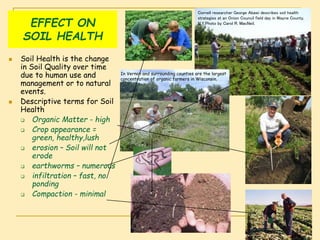
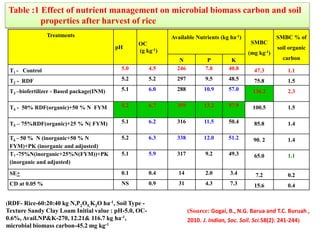
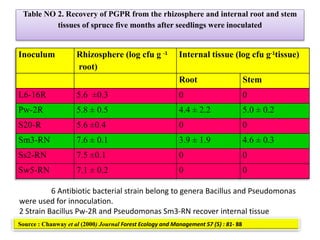
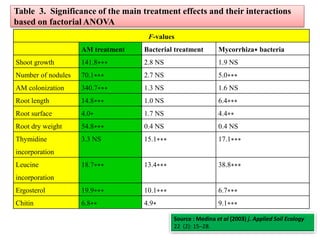
The document outlines the critical roles of plant-microbe interactions in enhancing soil health and agricultural production, including various symbiotic relationships such as mycorrhizae and nitrogen-fixing bacteria. It details how these interactions contribute to nutrient uptake, soil fertility, and protection against pathogens through mechanisms like exudate production and microbial diversity. Additionally, it highlights the importance of maintaining soil health for sustainable agricultural practices.


