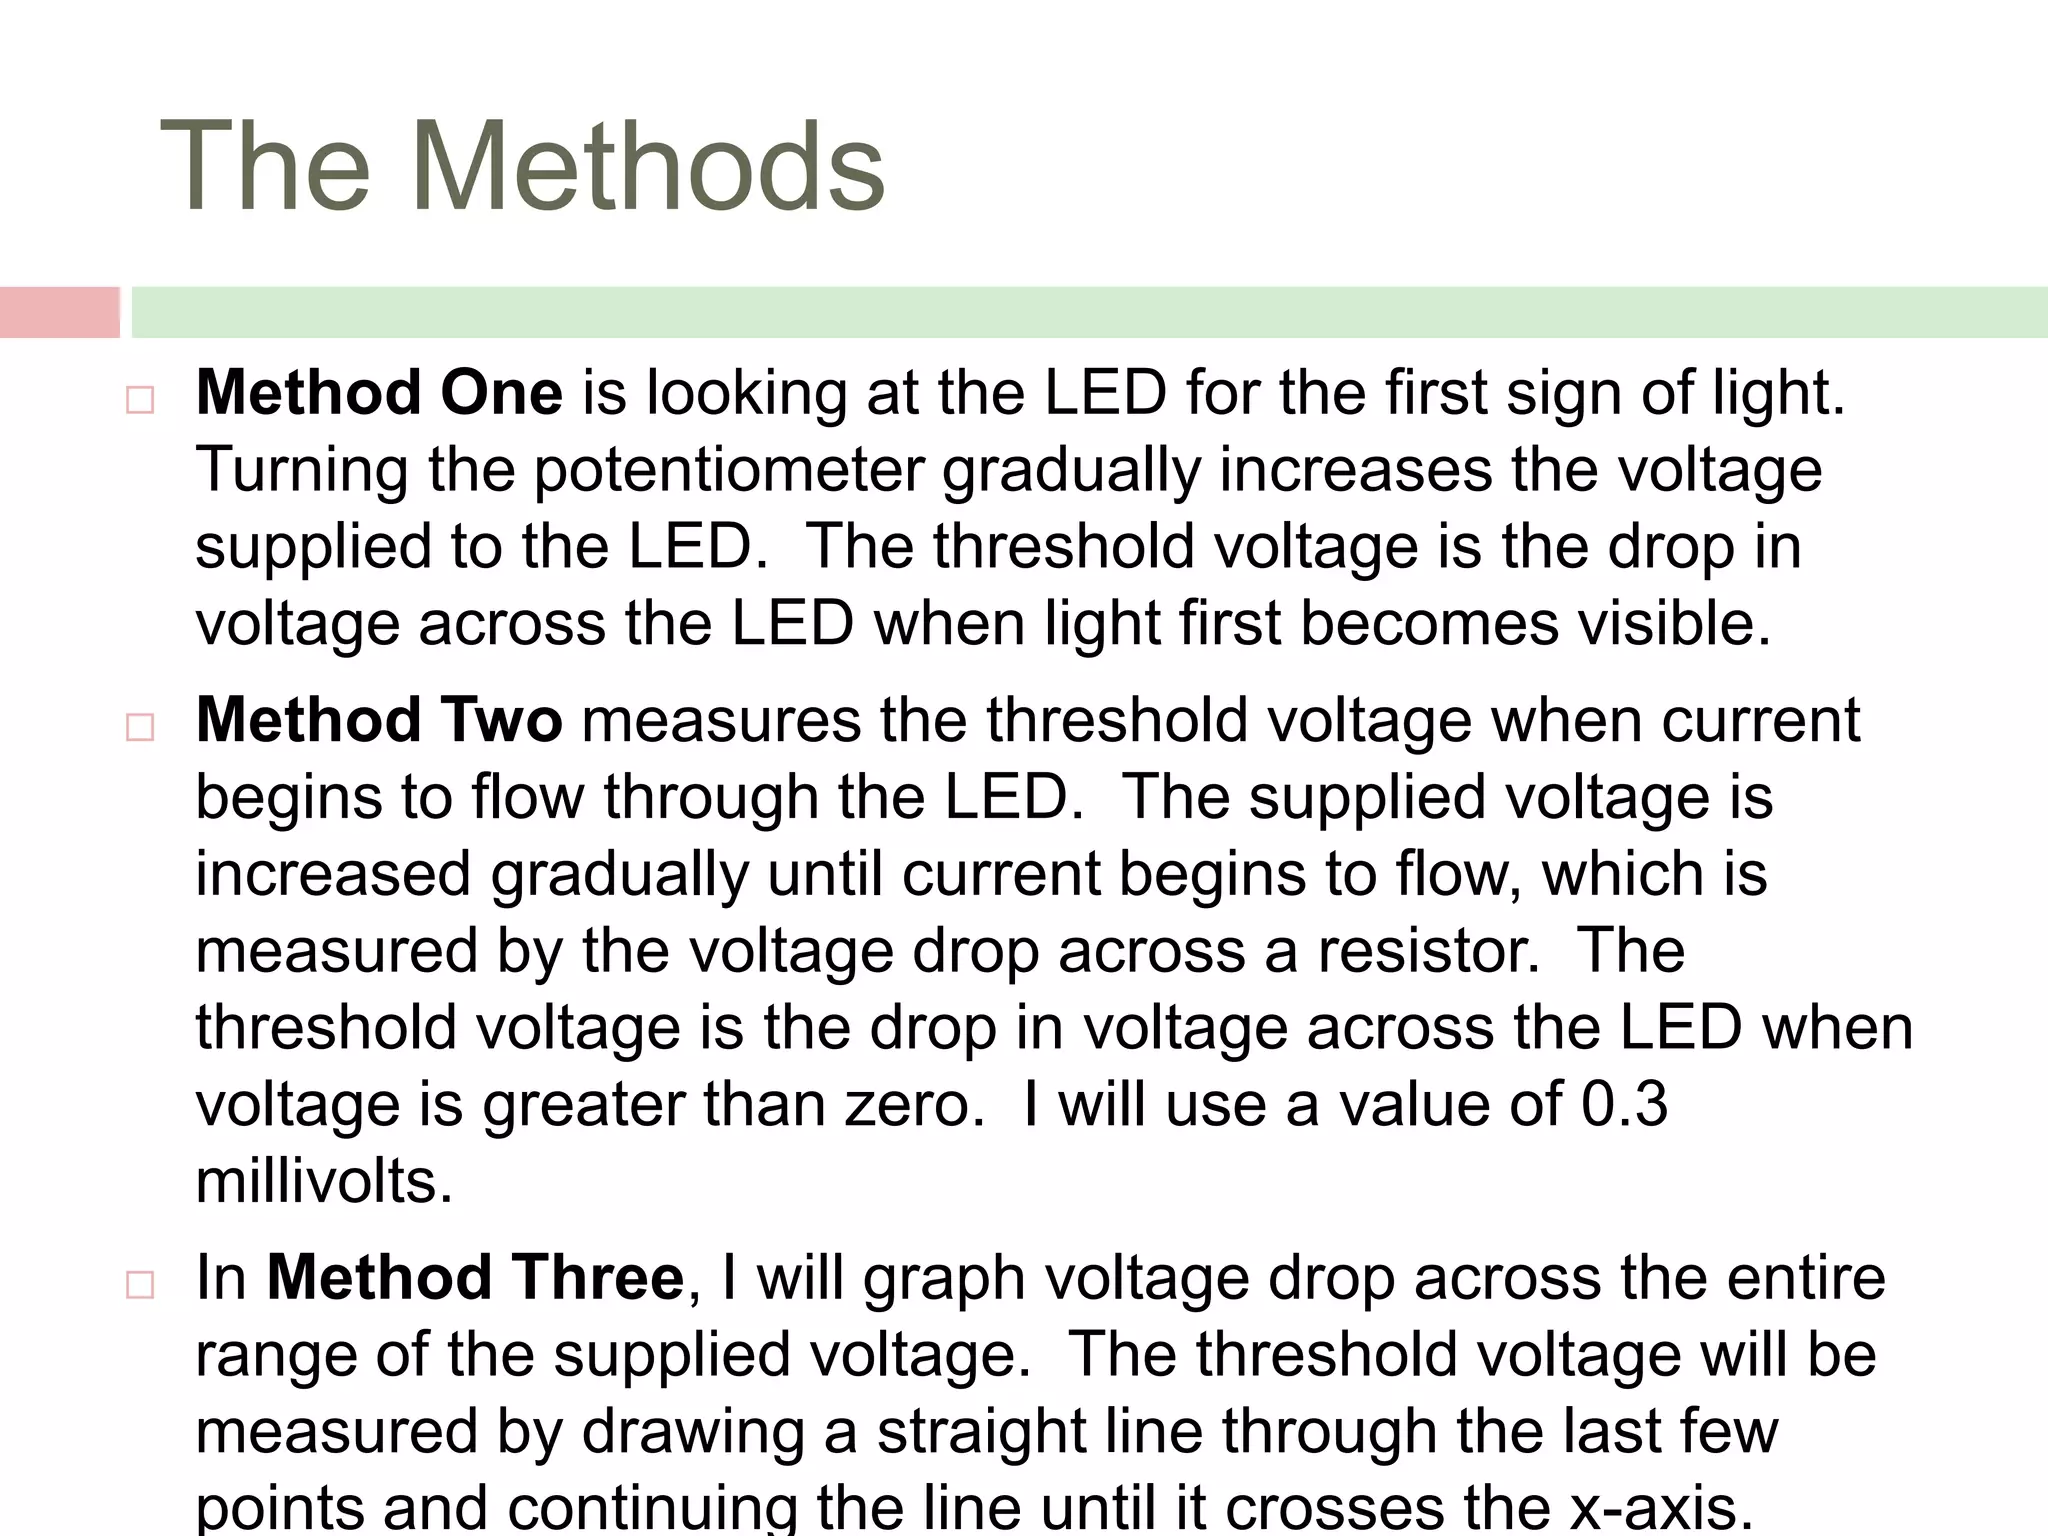
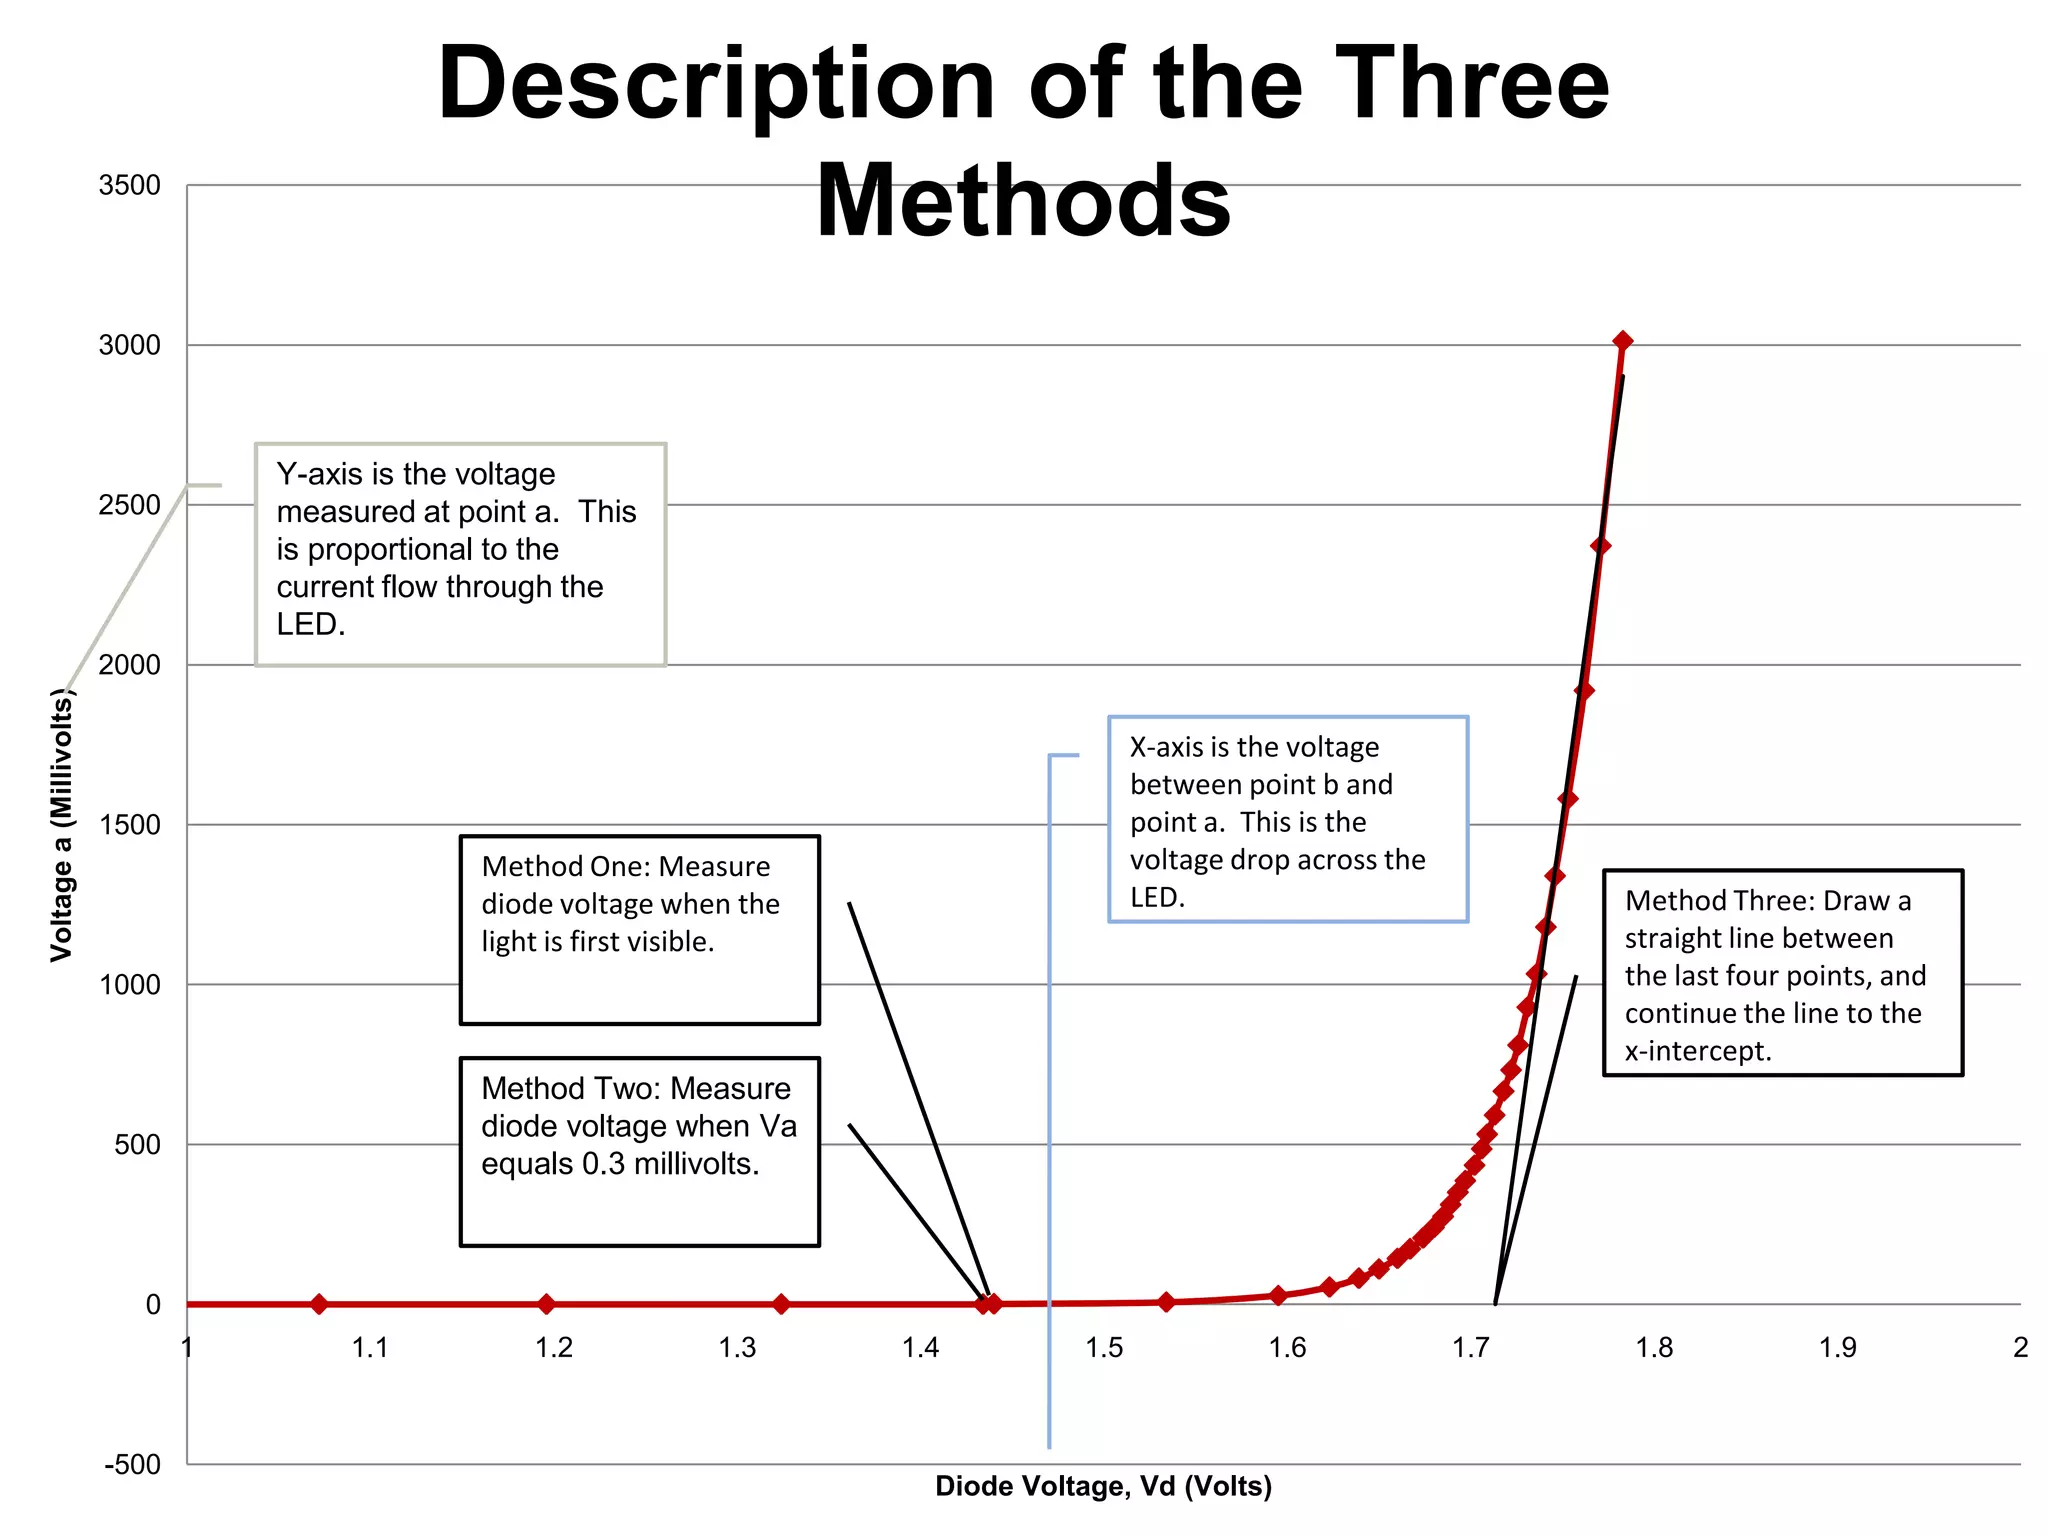
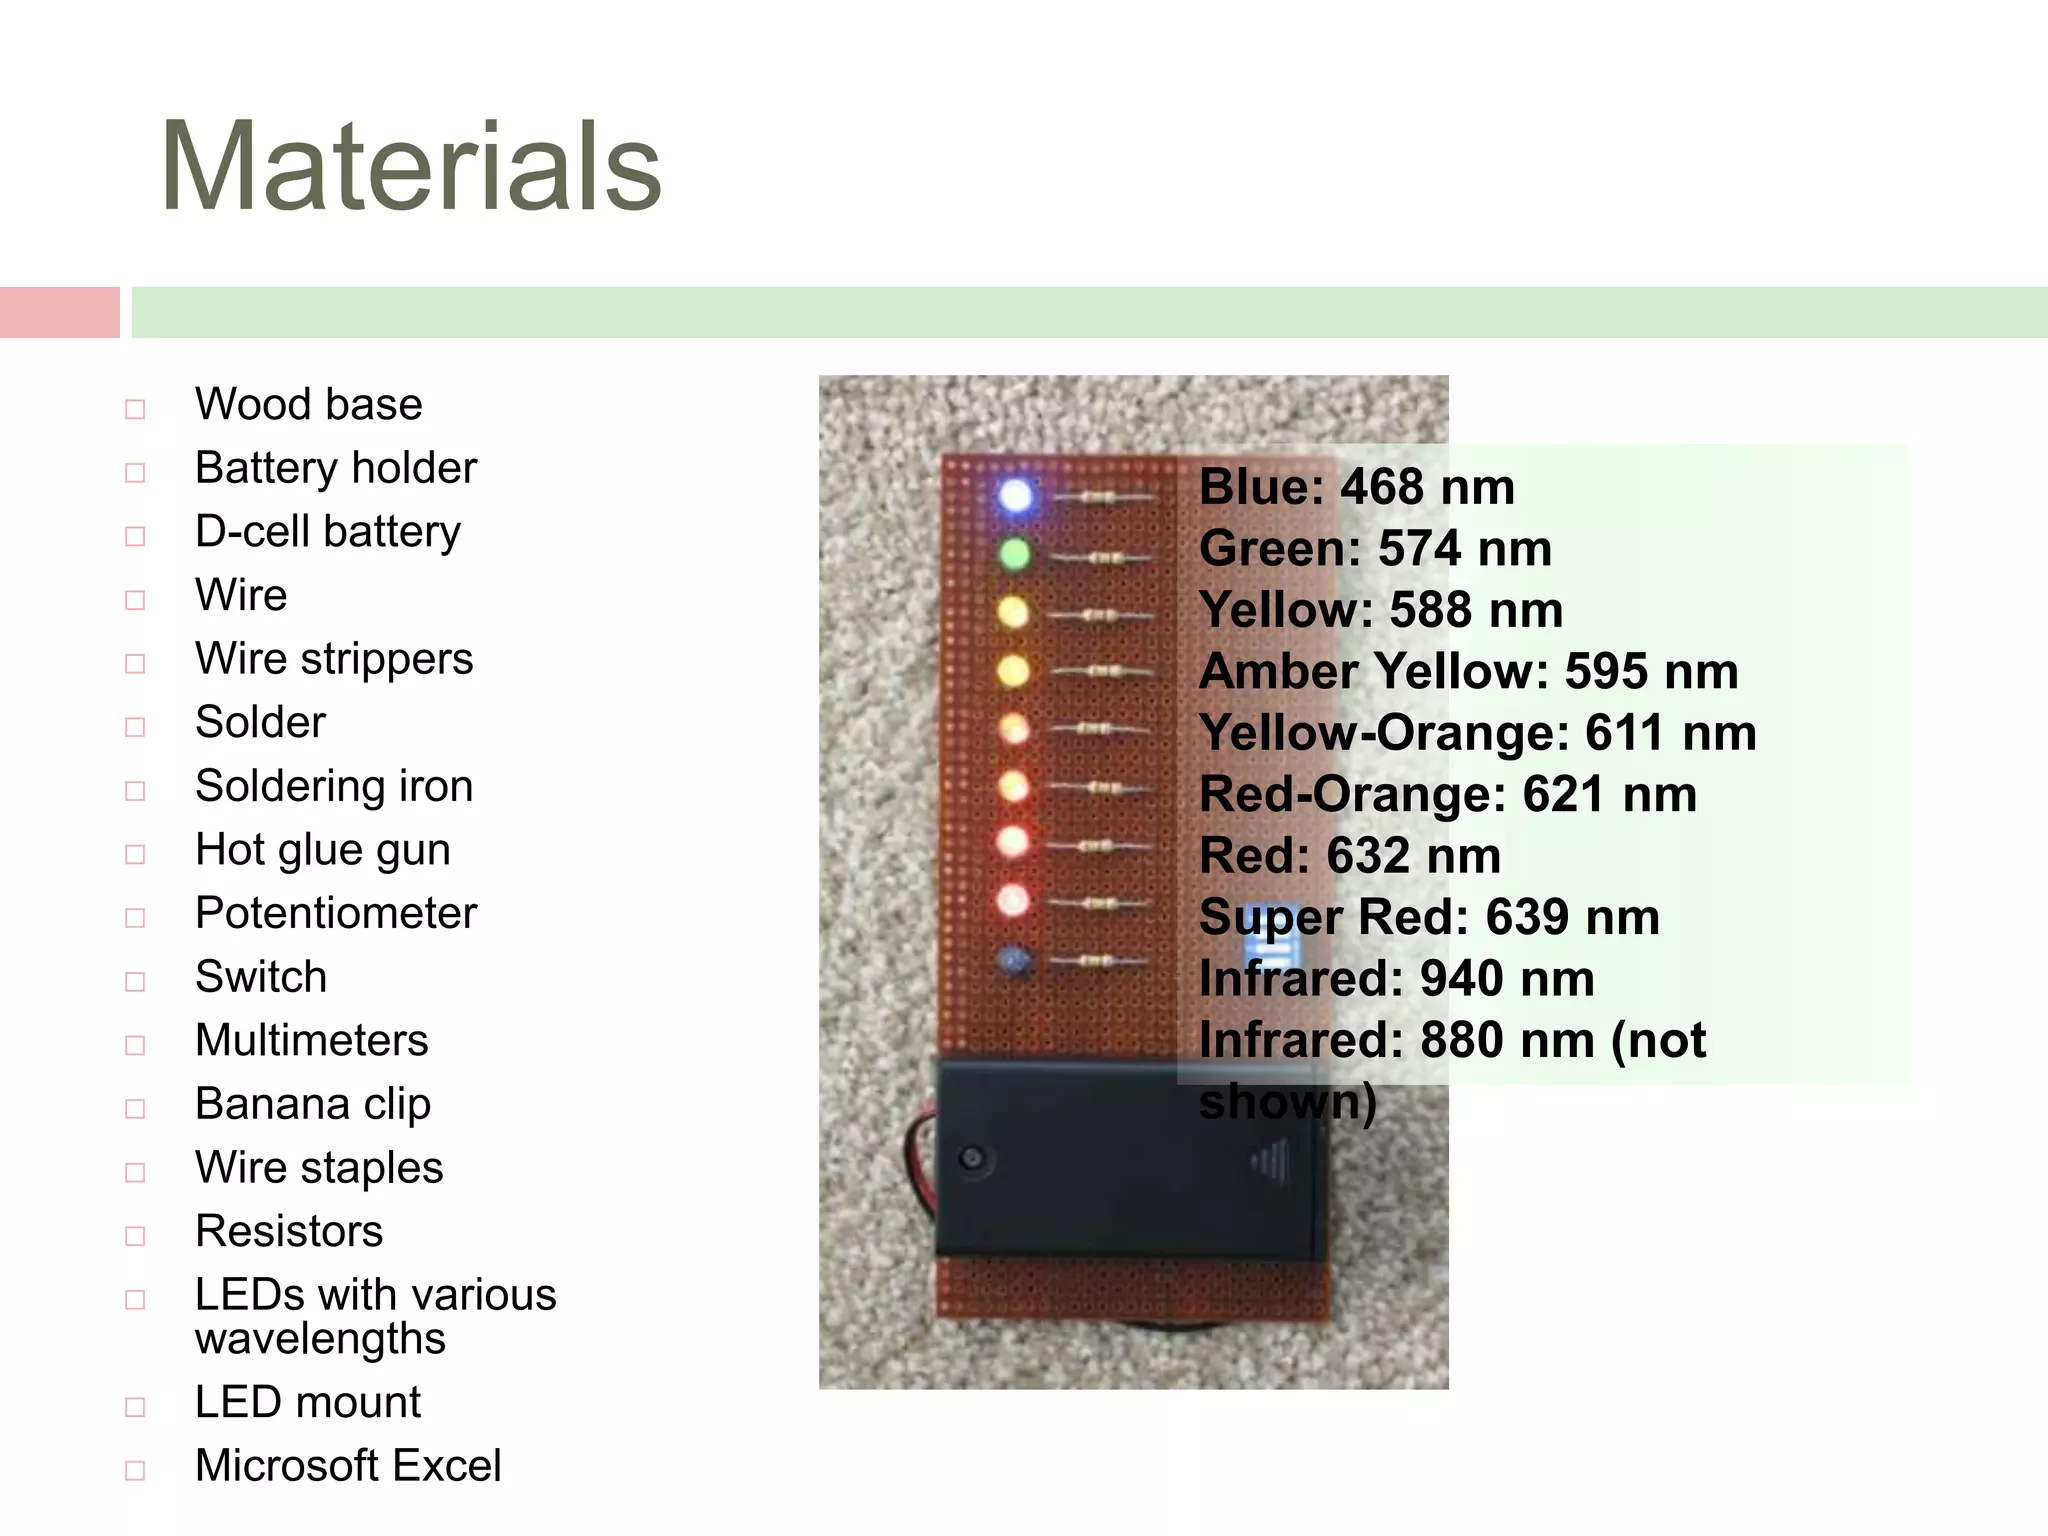
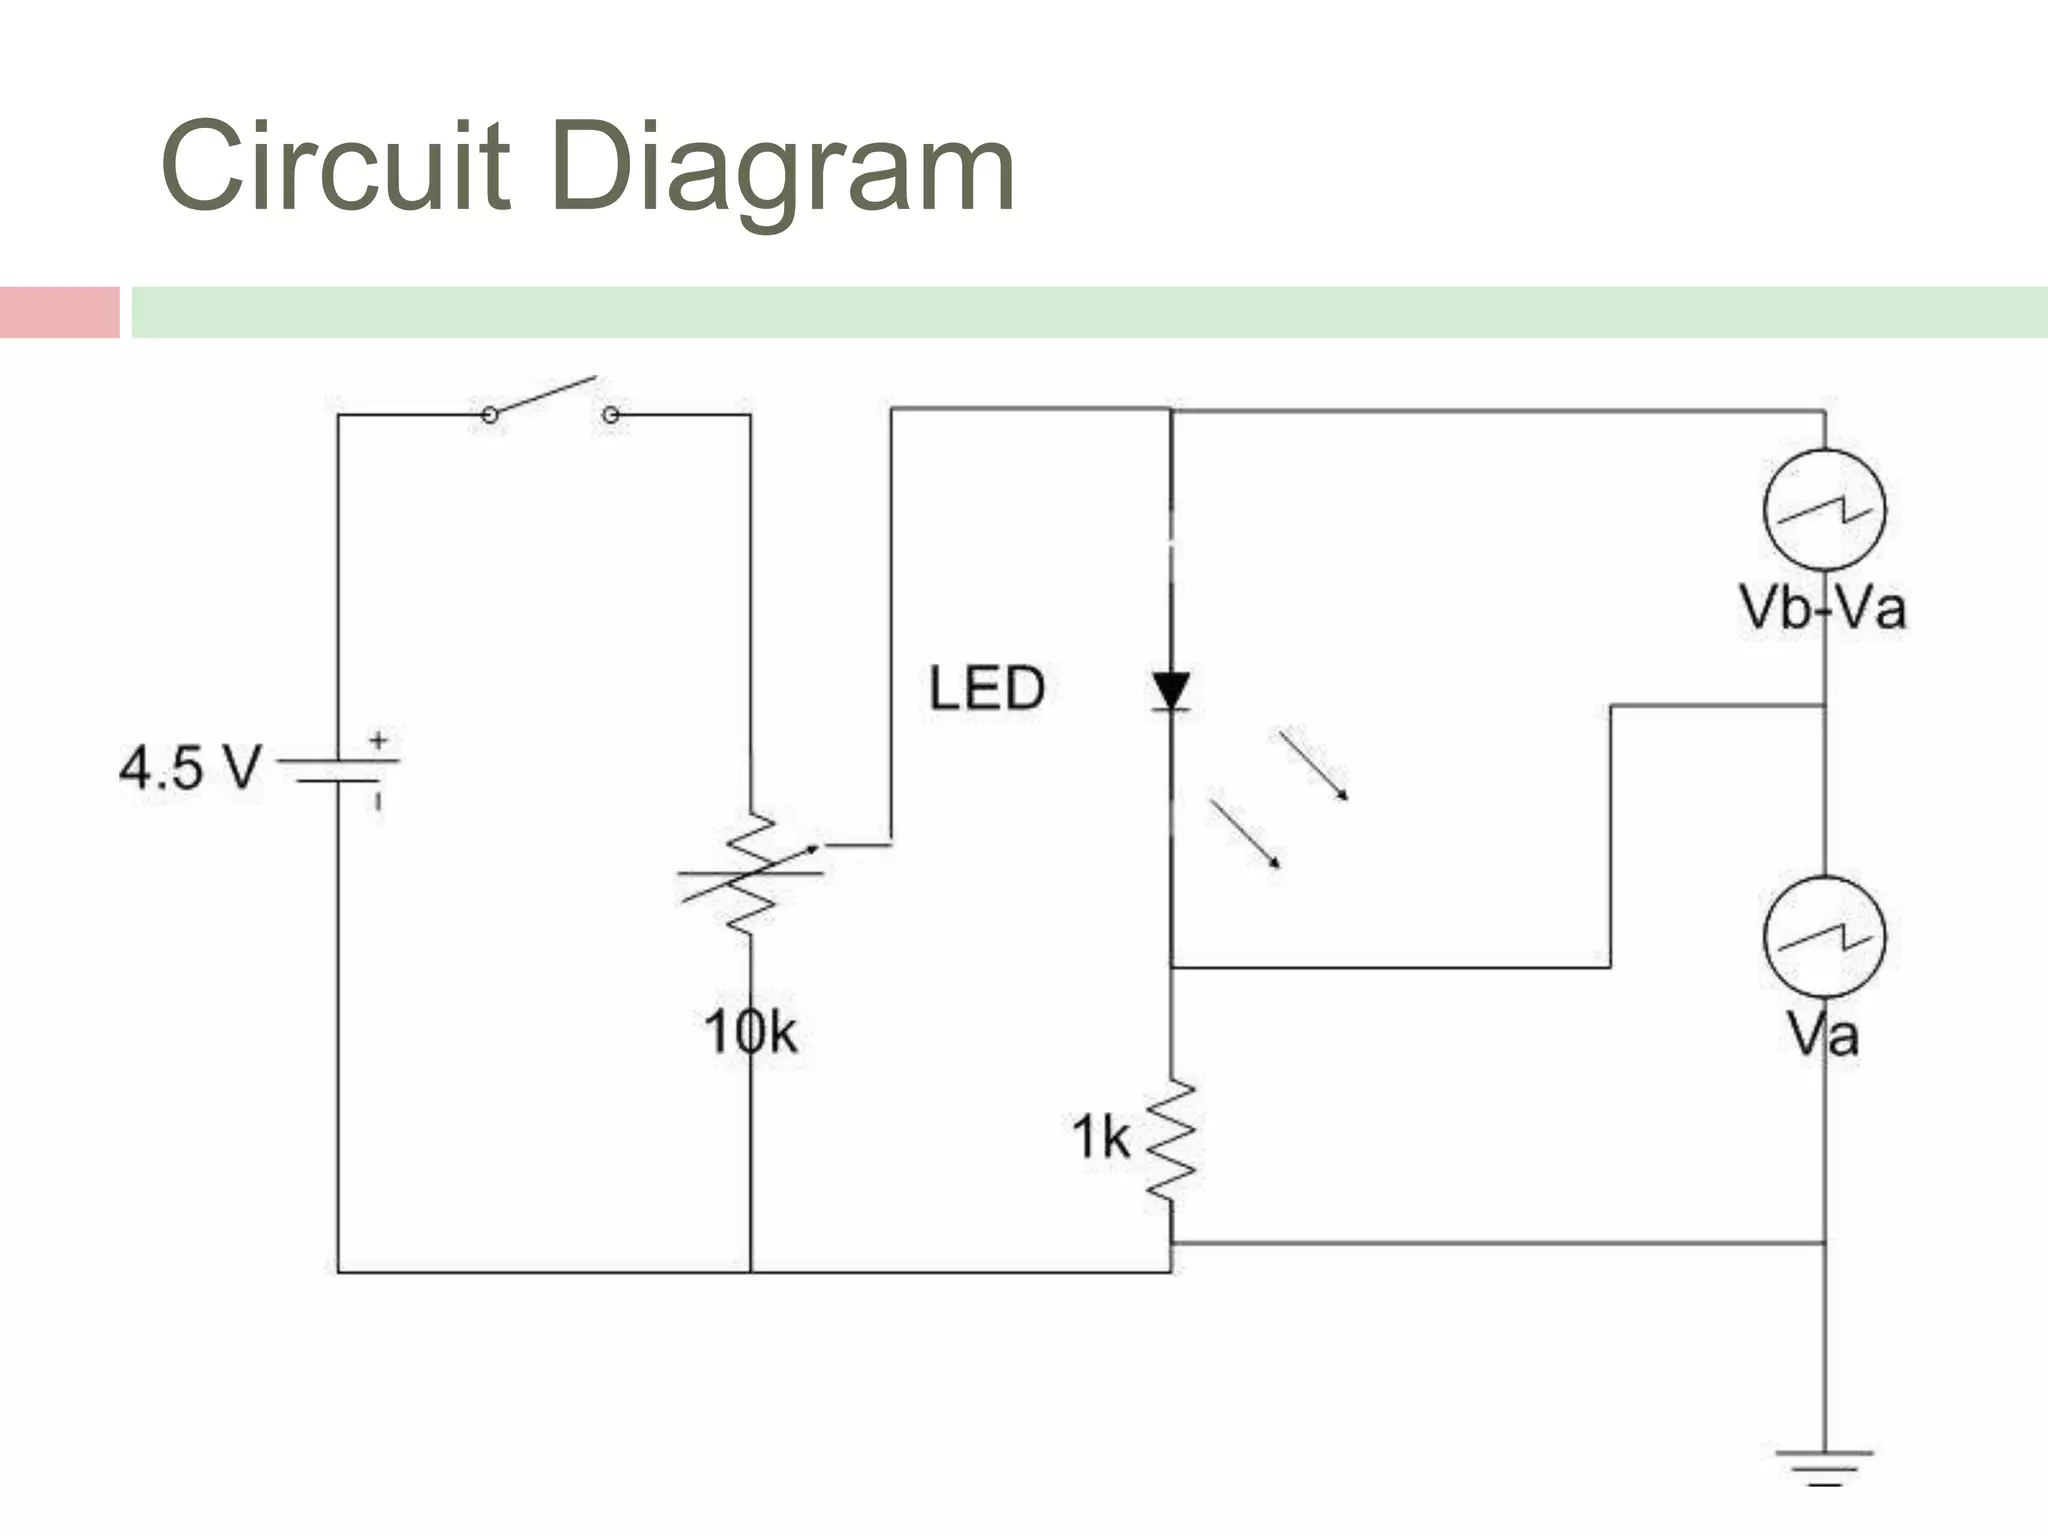
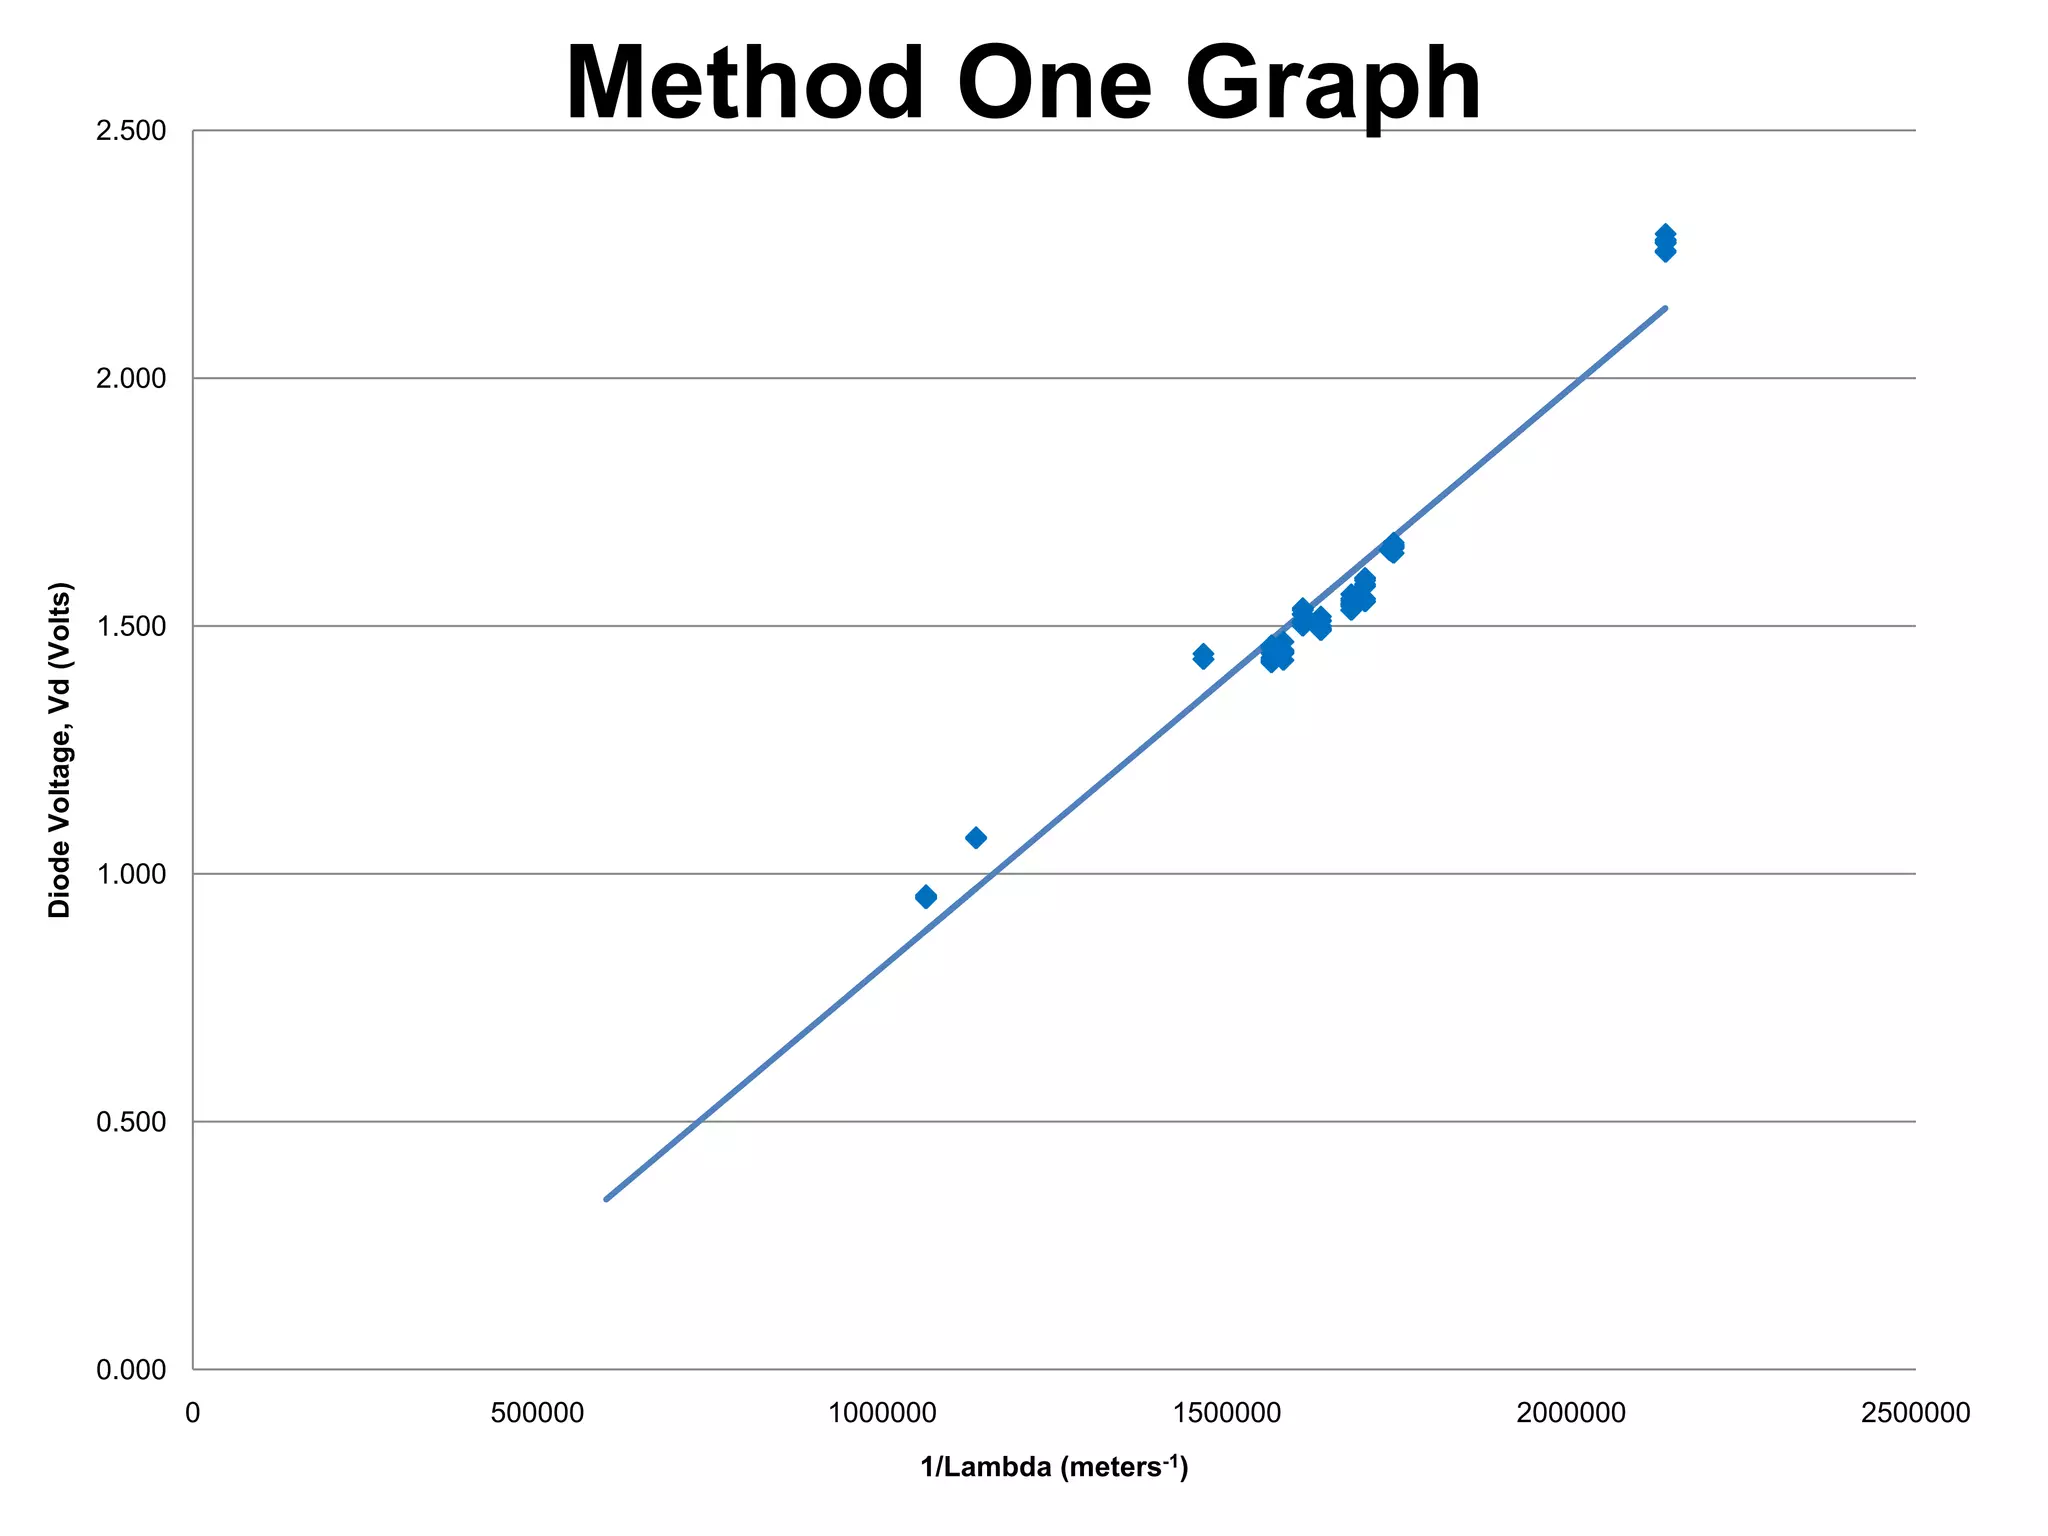
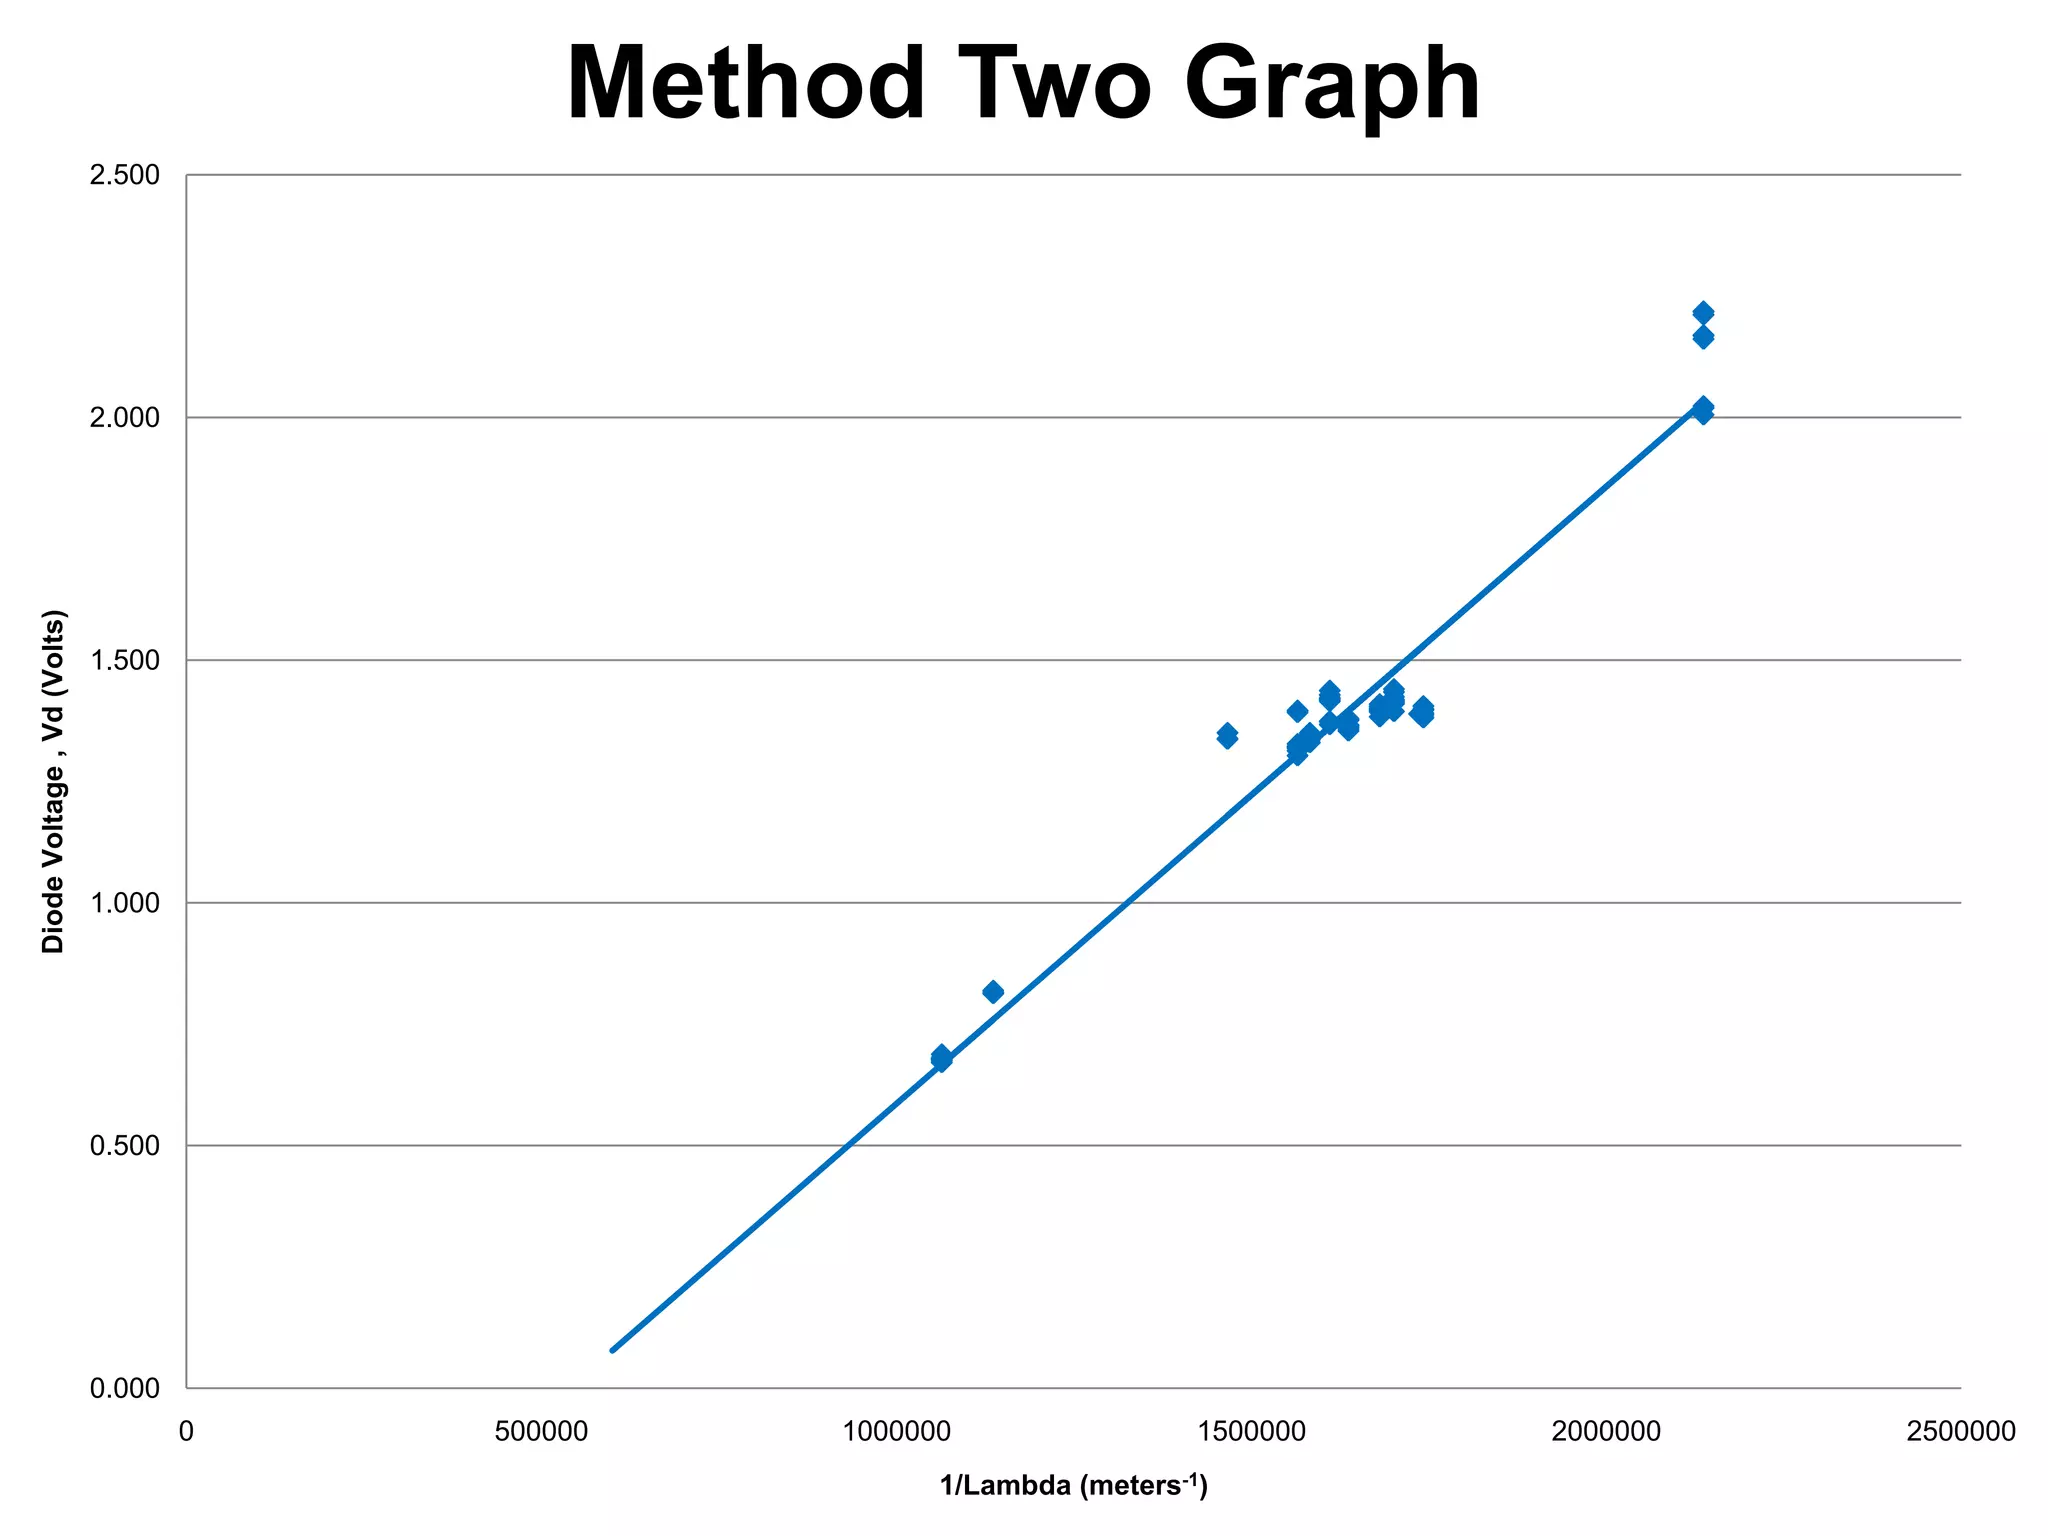
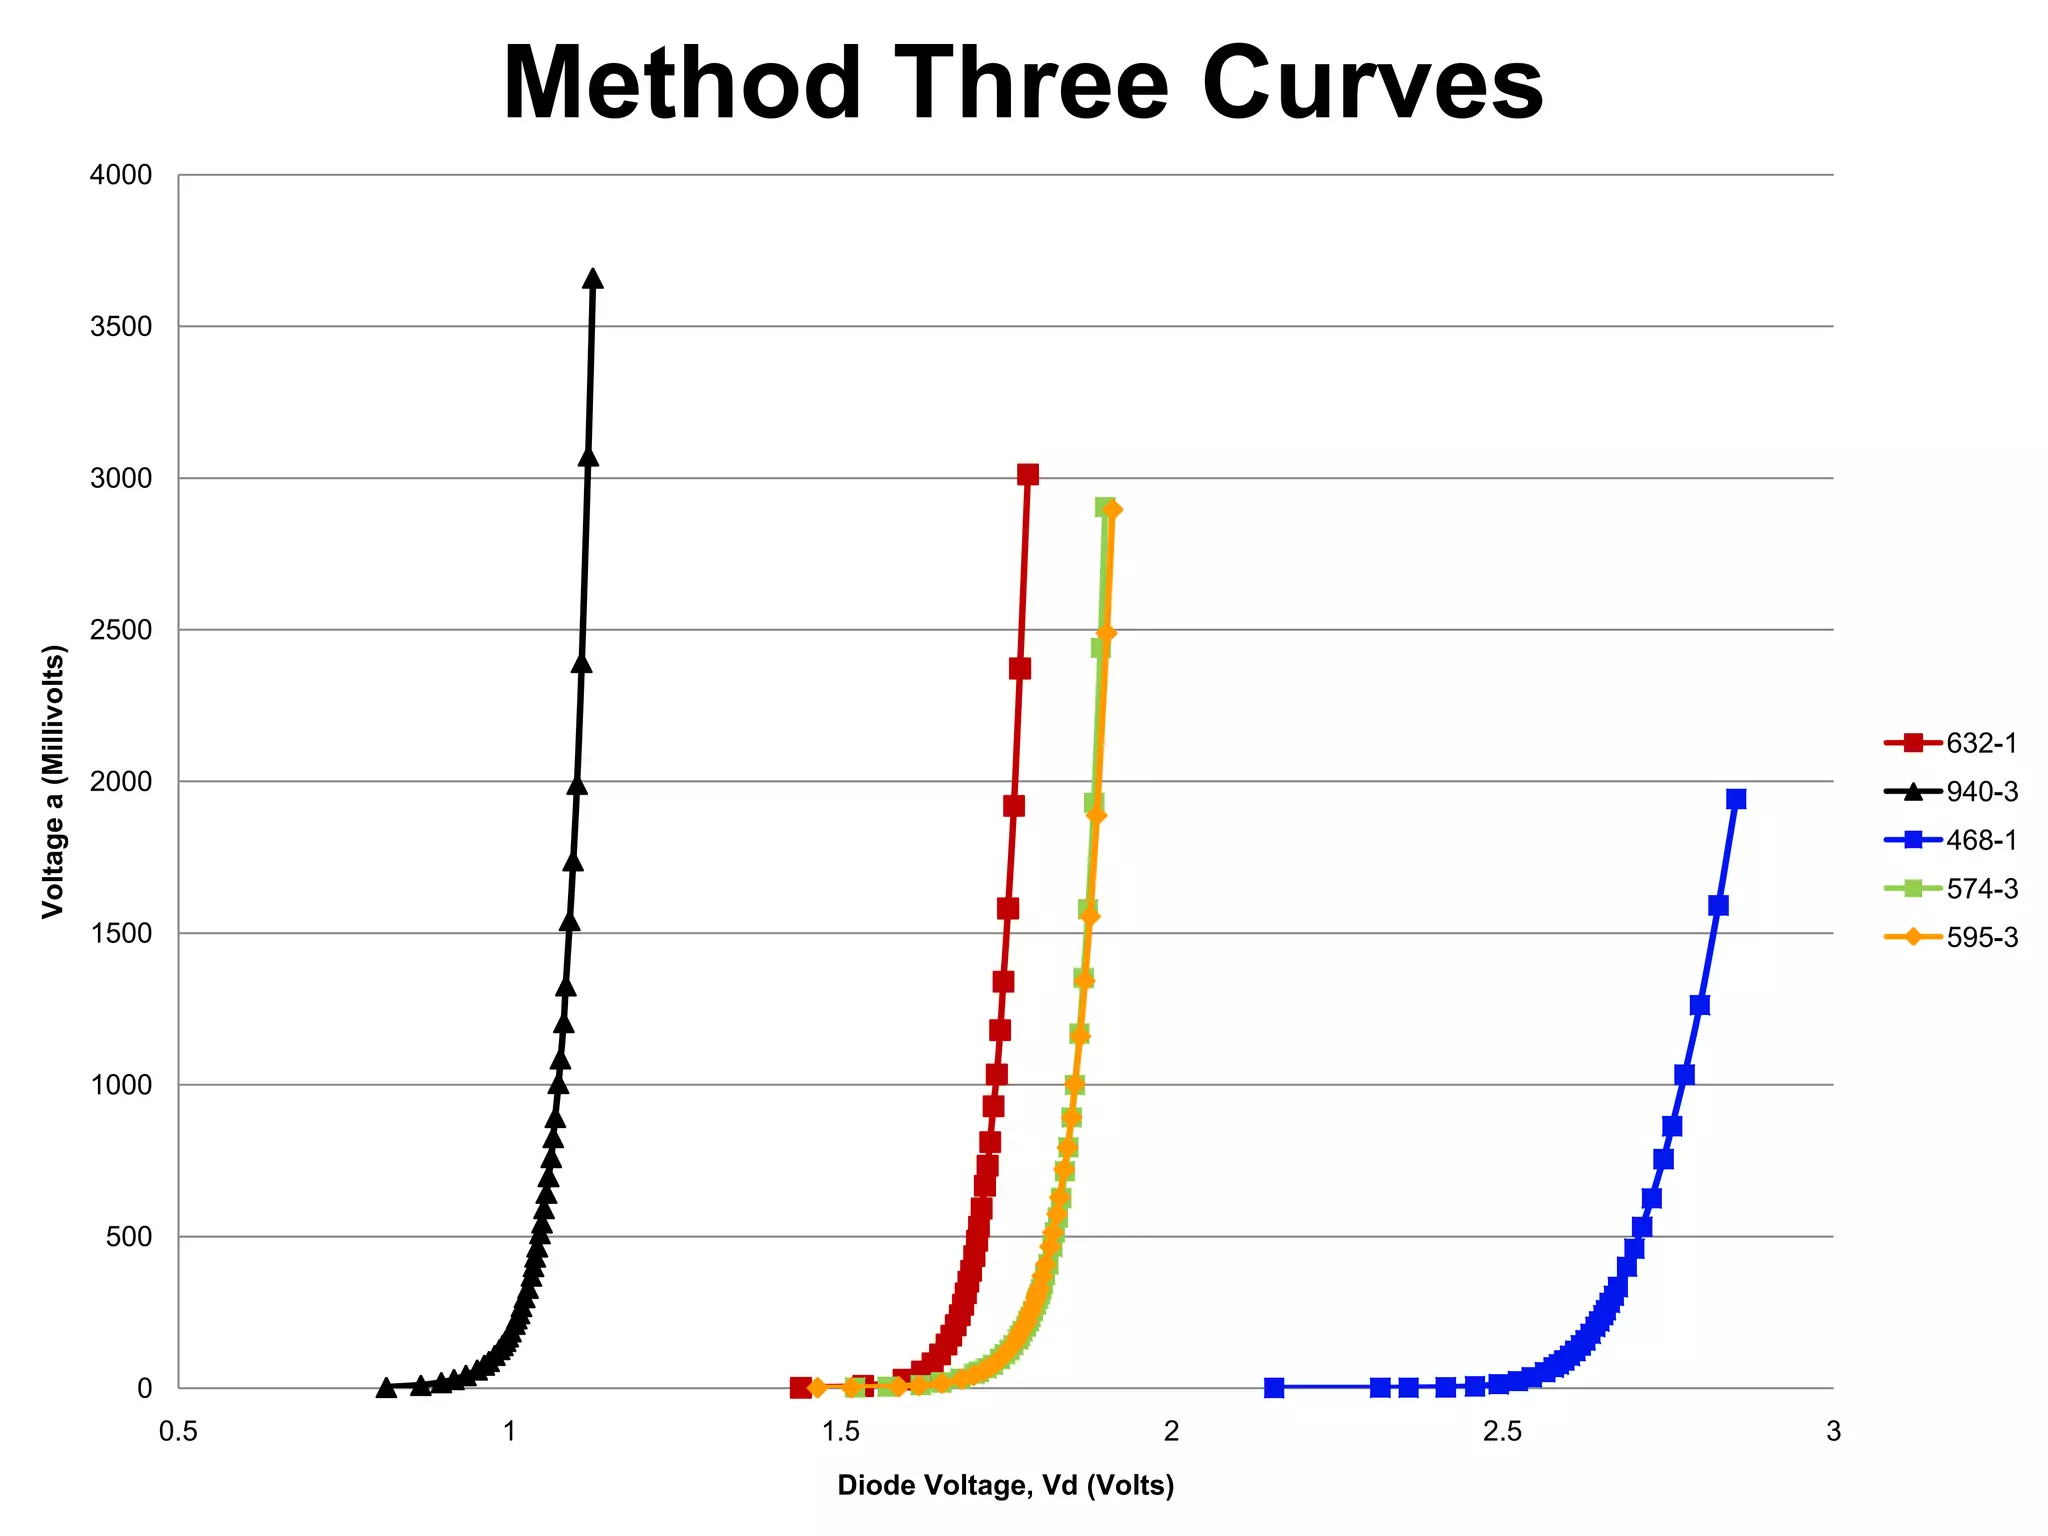
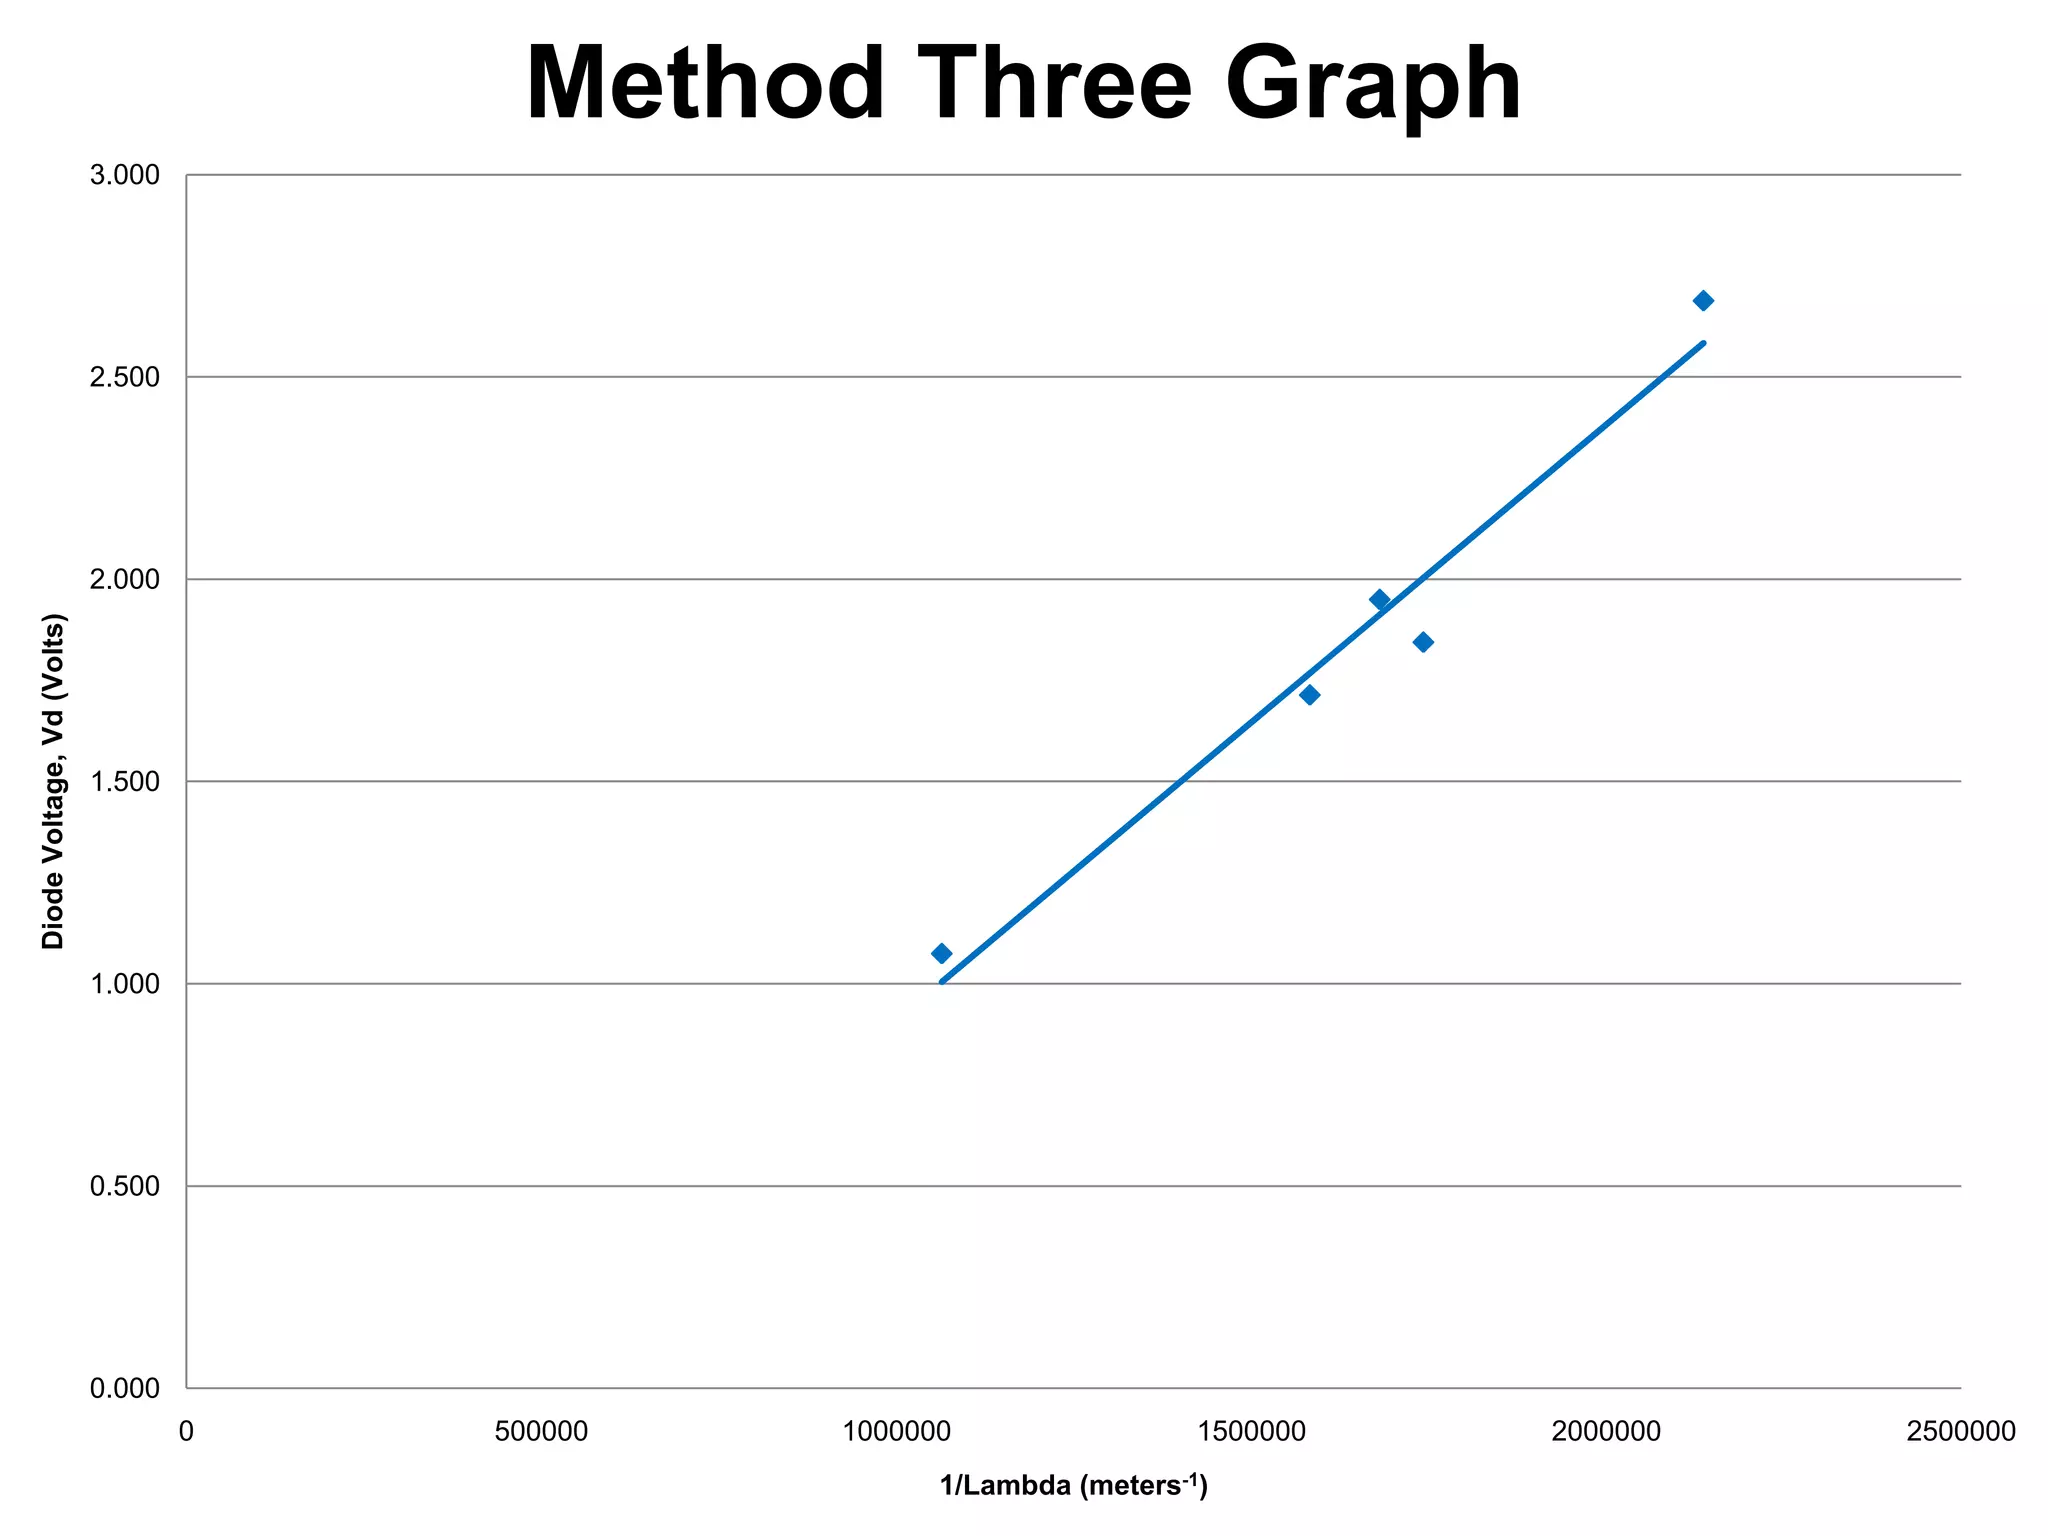
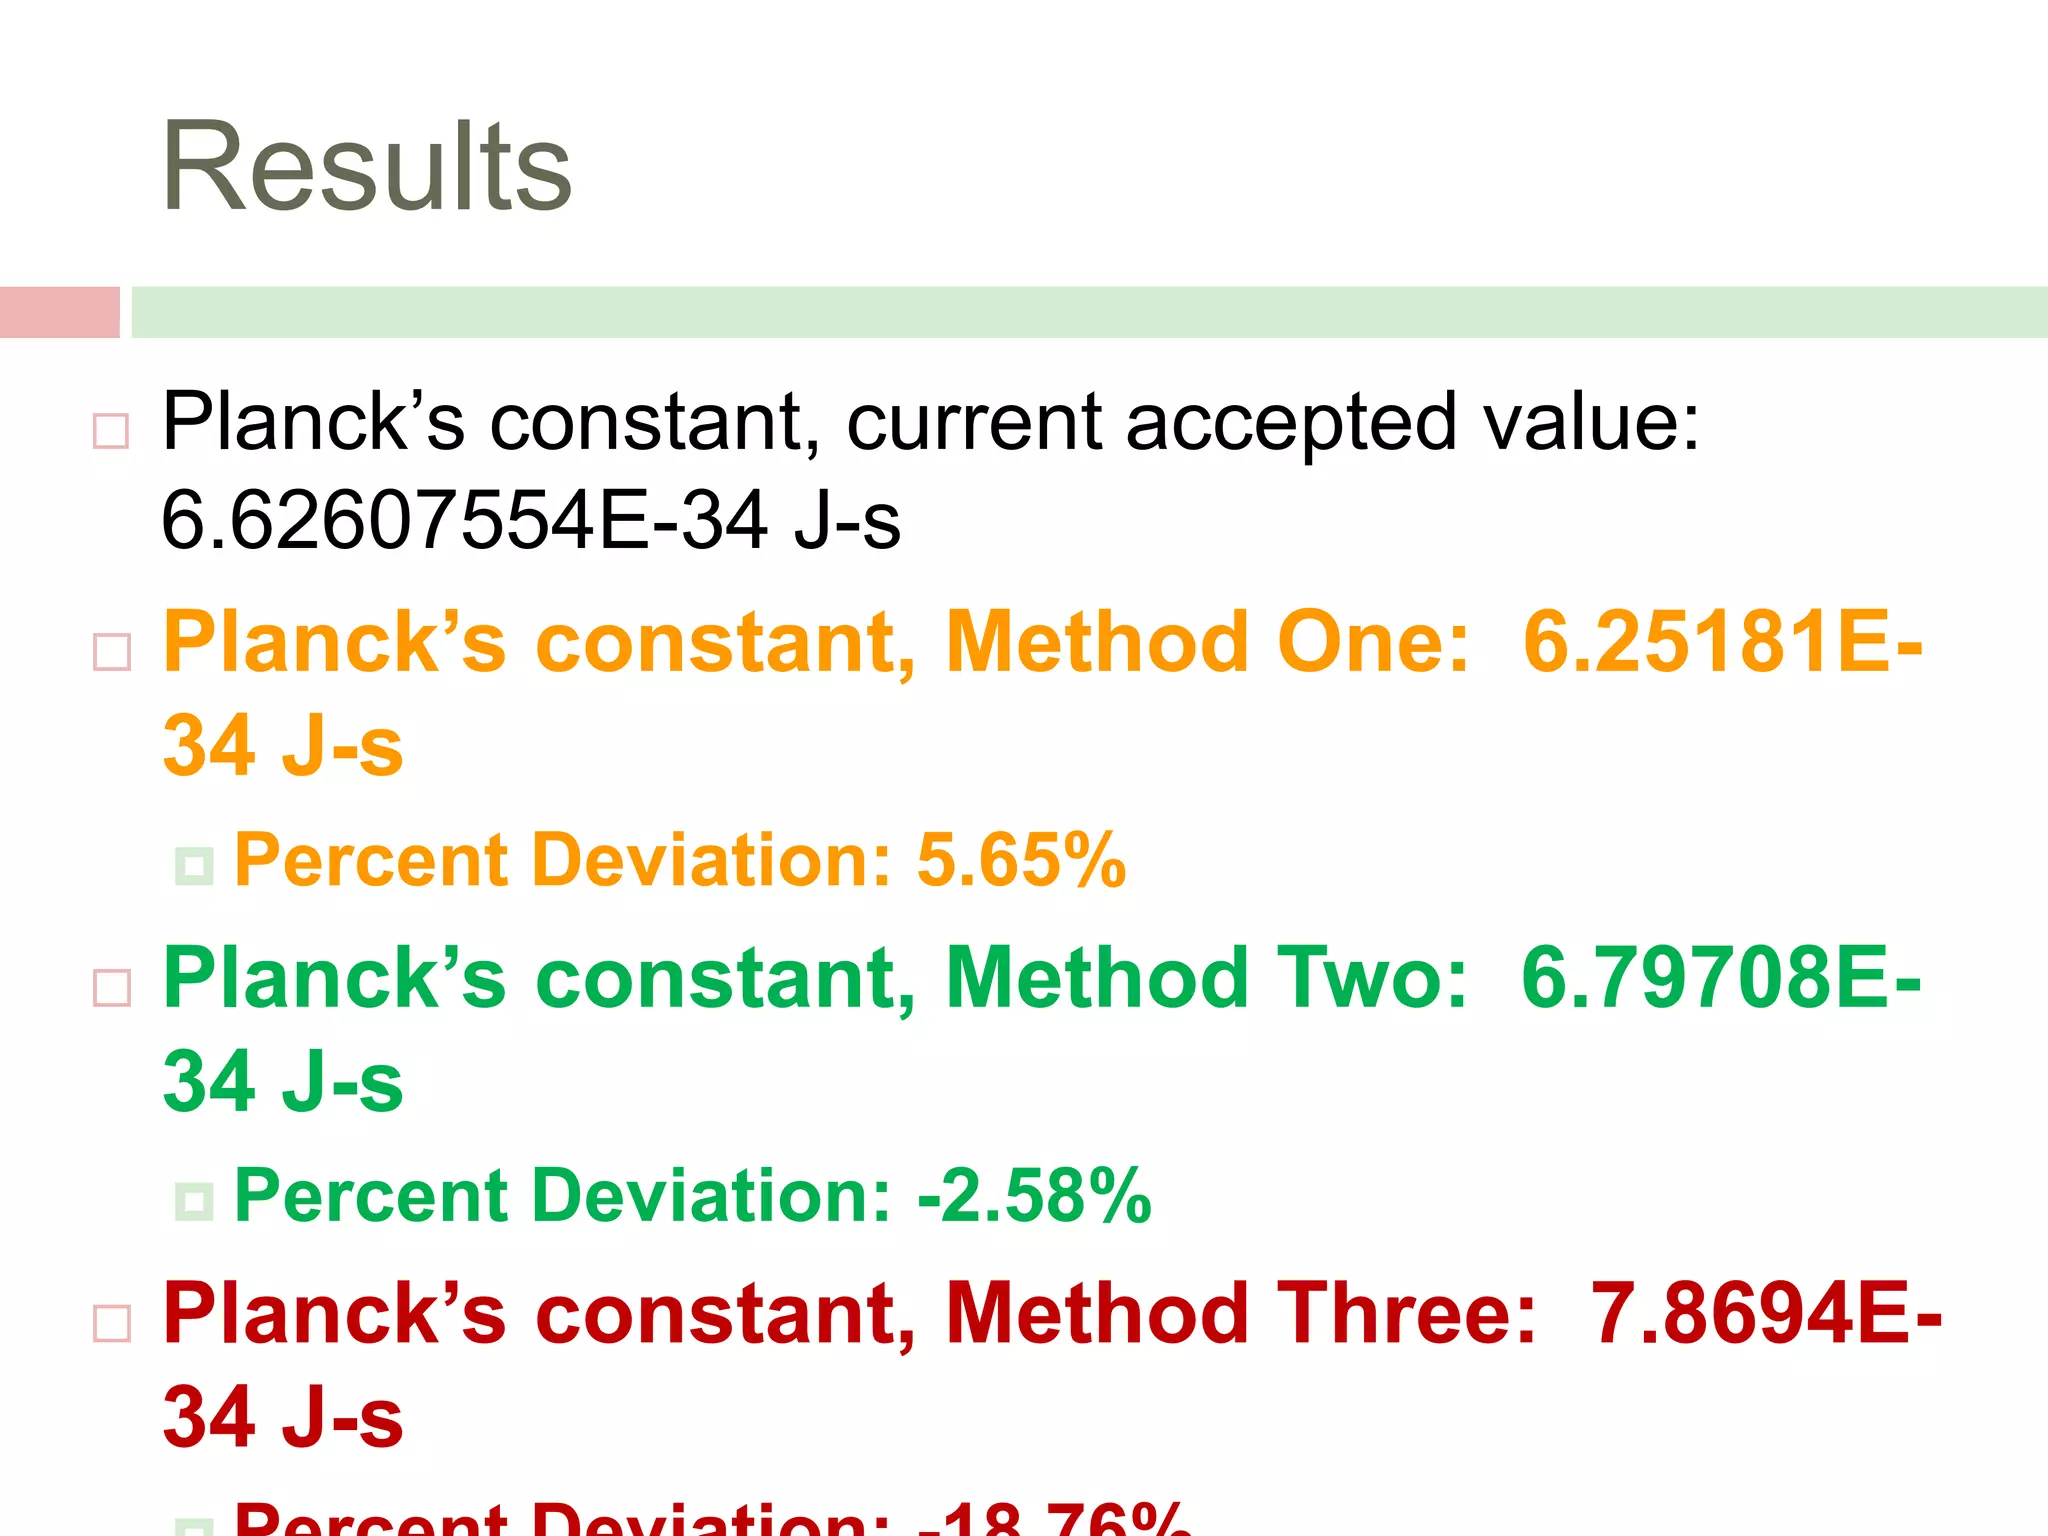
MEASURING
PLANCK’S
CONSTANT
Joseph R. Groele
The Quantum Theory
There are five major ideas represented in
the Quantum Theory:









Energy is not continuous, but comes in small but
discrete units.
The elementary particles behave both like particles
and like waves.
The movement of these particles is inherently random.
It is physically impossible to know both the position
and the momentum of a particle at the same time. The
more precisely one is known, the less precise the
measurement of the other is.
The atomic world is nothing like the world we live in.
Planck’s Equation
E=hc/λ=eV0
Where:
 E is the energy of the photon (Joules)
 λ is the wavelength of light (nanometers)
8
 c is the speed of light (2.998 x10 meters per
second)
 h is Planck’s constant (6.626 x 10⁻³⁴ J-s)
 e is the charge of an electron (1.6022 x10⁻¹⁹
Coulomb)
 V0 is the threshold voltage for the LED (Volts)
 Linear equation (y=mx+b): V0 = (hc/e)(1/ λ)
The Methods


Method One is looking at the LED for the first sign of light.
Turning the potentiometer gradually increases the voltage
supplied to the LED. The threshold voltage is the drop in
voltage across the LED when light first becomes visible.



Method Two measures the threshold voltage when current
begins to flow through the LED. The supplied voltage is
increased gradually until current begins to flow, which is
measured by the voltage drop across a resistor. The
threshold voltage is the drop in voltage across the LED when
voltage is greater than zero. I will use a value of 0.3
millivolts.



In Method Three, I will graph voltage drop across the entire
range of the supplied voltage. The threshold voltage will be
measured by drawing a straight line through the last few
points and continuing the line until it crosses the x-axis.
Description of the Three
Methods

3500

3000

Y-axis is the voltage
measured at point a. This
is proportional to the
current flow through the
LED.

2500

Voltage a (Millivolts)

2000

X-axis is the voltage
between point b and
point a. This is the
voltage drop across the
LED.

1500

Method One: Measure
diode voltage when the
light is first visible.

Method Three: Draw a
straight line between
the last four points, and
continue the line to the
x-intercept.

1000

Method Two: Measure
diode voltage when Va
equals 0.3 millivolts.

500

0
1

-500

1.1

1.2

1.3

1.4

1.5

1.6

Diode Voltage, Vd (Volts)

1.7

1.8

1.9

2
Purpose/Variables


The purpose of this experiment is to measure
Planck’s constant and to compare the
accuracies of three methods used to measure it.



Variables:
Independent: wavelength of LED and supplied
voltage
Constant: wavelength of the LED
Dependent: voltage drop across the LED and
voltage drop across the resistor





Hypothesis
I hypothesize that Method Two will be the
most accurate for measuring Planck’s constant.
All the data required will come directly from the
two multimeters, so human error should not
present a problem. I think that Method One will
be less accurate because it calls for human
judgment as to when the LED first begins to emit
light. In Method Three, a line needs to be made
from the last few points of the Va and Vb-Va
graph, which I believe will be curved like an
exponential graph. The curve will make choosing
points to make a line difficult and likely cause this
method to be less accurate.
Materials





















Wood base
Battery holder
D-cell battery
Wire
Wire strippers
Solder
Soldering iron
Hot glue gun
Potentiometer
Switch
Multimeters
Banana clip
Wire staples
Resistors
LEDs with various
wavelengths
LED mount
Microsoft Excel

Blue: 468 nm
Green: 574 nm
Yellow: 588 nm
Amber Yellow: 595 nm
Yellow-Orange: 611 nm
Red-Orange: 621 nm
Red: 632 nm
Super Red: 639 nm
Infrared: 940 nm
Infrared: 880 nm (not
shown)
Circuit Diagram
Method One Graph

2.500

Diode Voltage, Vd (Volts)

2.000

1.500

1.000

0.500

0.000
0

500000

1000000

1500000

1/Lambda (meters-1)

2000000

2500000
Method Two Graph
2.500

Diode Voltage , Vd (Volts)

2.000

1.500

1.000

0.500

0.000
0

500000

1000000

1500000

1/Lambda (meters-1)

2000000

2500000
Method Three Curves
4000

3500

Voltage a (Millivolts)

3000

2500

632-1
2000

940-3
468-1
574-3

1500

595-3

1000

500

0
0.5

1

1.5

2

Diode Voltage, Vd (Volts)

2.5

3
Method Three Graph
3.000

2.500

Diode Voltage, Vd (Volts)

2.000

1.500

1.000

0.500

0.000
0

500000

1000000

1500000

1/Lambda (meters-1)

2000000

2500000
Results




Planck’s constant, current accepted value:
6.62607554E-34 J-s
Planck’s constant, Method One: 6.25181E34 J-s
 Percent



Planck’s constant, Method Two: 6.79708E34 J-s
 Percent



Deviation: 5.65%

Deviation: -2.58%

Planck’s constant, Method Three: 7.8694E34 J-s
Project Photos

Planck's constant presentation

  • 1.
  • 2.
    The Quantum Theory Thereare five major ideas represented in the Quantum Theory:      Energy is not continuous, but comes in small but discrete units. The elementary particles behave both like particles and like waves. The movement of these particles is inherently random. It is physically impossible to know both the position and the momentum of a particle at the same time. The more precisely one is known, the less precise the measurement of the other is. The atomic world is nothing like the world we live in.
  • 3.
    Planck’s Equation E=hc/λ=eV0 Where:  Eis the energy of the photon (Joules)  λ is the wavelength of light (nanometers) 8  c is the speed of light (2.998 x10 meters per second)  h is Planck’s constant (6.626 x 10⁻³⁴ J-s)  e is the charge of an electron (1.6022 x10⁻¹⁹ Coulomb)  V0 is the threshold voltage for the LED (Volts)  Linear equation (y=mx+b): V0 = (hc/e)(1/ λ)
  • 4.
    The Methods  Method Oneis looking at the LED for the first sign of light. Turning the potentiometer gradually increases the voltage supplied to the LED. The threshold voltage is the drop in voltage across the LED when light first becomes visible.  Method Two measures the threshold voltage when current begins to flow through the LED. The supplied voltage is increased gradually until current begins to flow, which is measured by the voltage drop across a resistor. The threshold voltage is the drop in voltage across the LED when voltage is greater than zero. I will use a value of 0.3 millivolts.  In Method Three, I will graph voltage drop across the entire range of the supplied voltage. The threshold voltage will be measured by drawing a straight line through the last few points and continuing the line until it crosses the x-axis.
  • 5.
    Description of theThree Methods 3500 3000 Y-axis is the voltage measured at point a. This is proportional to the current flow through the LED. 2500 Voltage a (Millivolts) 2000 X-axis is the voltage between point b and point a. This is the voltage drop across the LED. 1500 Method One: Measure diode voltage when the light is first visible. Method Three: Draw a straight line between the last four points, and continue the line to the x-intercept. 1000 Method Two: Measure diode voltage when Va equals 0.3 millivolts. 500 0 1 -500 1.1 1.2 1.3 1.4 1.5 1.6 Diode Voltage, Vd (Volts) 1.7 1.8 1.9 2
  • 6.
    Purpose/Variables  The purpose ofthis experiment is to measure Planck’s constant and to compare the accuracies of three methods used to measure it.  Variables: Independent: wavelength of LED and supplied voltage Constant: wavelength of the LED Dependent: voltage drop across the LED and voltage drop across the resistor   
  • 7.
    Hypothesis I hypothesize thatMethod Two will be the most accurate for measuring Planck’s constant. All the data required will come directly from the two multimeters, so human error should not present a problem. I think that Method One will be less accurate because it calls for human judgment as to when the LED first begins to emit light. In Method Three, a line needs to be made from the last few points of the Va and Vb-Va graph, which I believe will be curved like an exponential graph. The curve will make choosing points to make a line difficult and likely cause this method to be less accurate.
  • 8.
    Materials                  Wood base Battery holder D-cellbattery Wire Wire strippers Solder Soldering iron Hot glue gun Potentiometer Switch Multimeters Banana clip Wire staples Resistors LEDs with various wavelengths LED mount Microsoft Excel Blue: 468 nm Green: 574 nm Yellow: 588 nm Amber Yellow: 595 nm Yellow-Orange: 611 nm Red-Orange: 621 nm Red: 632 nm Super Red: 639 nm Infrared: 940 nm Infrared: 880 nm (not shown)
  • 9.
  • 10.
    Method One Graph 2.500 DiodeVoltage, Vd (Volts) 2.000 1.500 1.000 0.500 0.000 0 500000 1000000 1500000 1/Lambda (meters-1) 2000000 2500000
  • 11.
    Method Two Graph 2.500 DiodeVoltage , Vd (Volts) 2.000 1.500 1.000 0.500 0.000 0 500000 1000000 1500000 1/Lambda (meters-1) 2000000 2500000
  • 12.
    Method Three Curves 4000 3500 Voltagea (Millivolts) 3000 2500 632-1 2000 940-3 468-1 574-3 1500 595-3 1000 500 0 0.5 1 1.5 2 Diode Voltage, Vd (Volts) 2.5 3
  • 13.
    Method Three Graph 3.000 2.500 DiodeVoltage, Vd (Volts) 2.000 1.500 1.000 0.500 0.000 0 500000 1000000 1500000 1/Lambda (meters-1) 2000000 2500000
  • 14.
    Results   Planck’s constant, currentaccepted value: 6.62607554E-34 J-s Planck’s constant, Method One: 6.25181E34 J-s  Percent  Planck’s constant, Method Two: 6.79708E34 J-s  Percent  Deviation: 5.65% Deviation: -2.58% Planck’s constant, Method Three: 7.8694E34 J-s
  • 15.