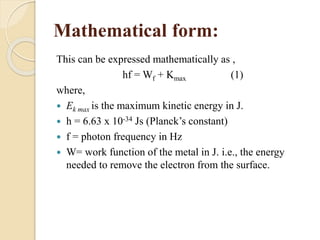
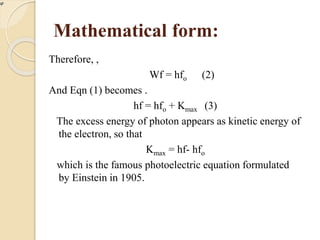
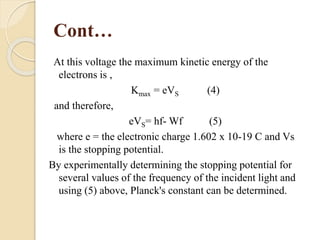
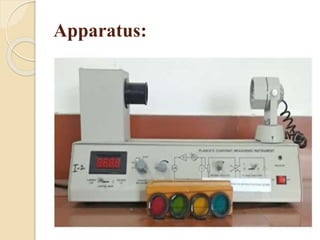
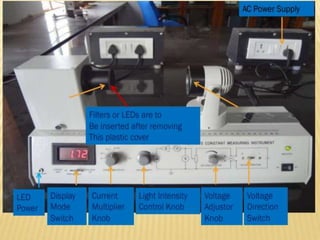
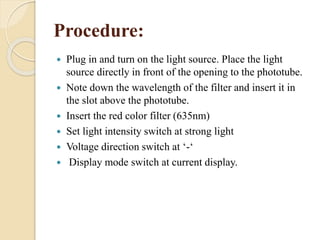
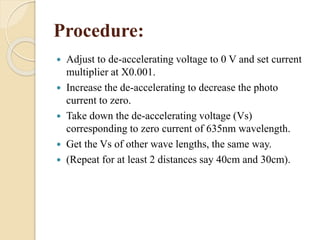
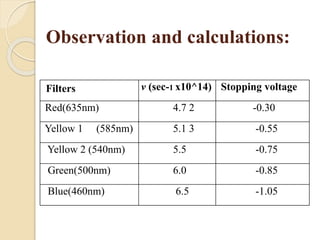
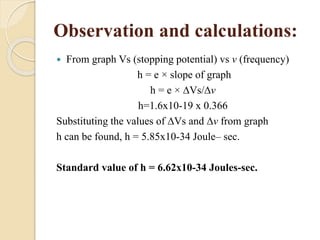
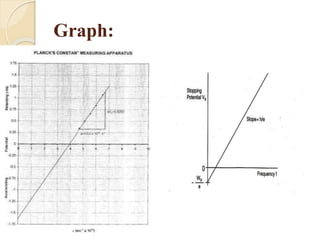
Planck constant using
Photoelectric Effect
Sumayyah Ata
18501510-072
BS-Physics-VI-(B)
LAB-VI
TO: Dr.Tahir Iqbal Awan
Content:
 Abstract
 Objective
 Introduction (History + Theory)
 Mathematical Form
 Apparatus
 Procedure
 Observation
 Calculation & Result
 Graph
 Conclusion
Abstract:
 In this experiment we Measure Planck’s Constant Using
the Photoelectric Effect.
 First of all we arrange apparatus as we arrange
photoelectric effect apparatus.
 Then we incident different wavelength photon and
calculate stopping voltage of electrons that’s emit due to
photo electric effect. The electrons then flow through the
phototube to the collector and create a current flow.
 A voltage called the stopping voltage or stopping
potential is applied to prevent the flow of
photoelectrons.
Abstract:
 Secondly we draw graph between frequency and
stopping potential then by using slope formula
that’s nothing else Einstein equation. If the
frequencies or wavelengths of the incoming
light and the corresponding stopping voltages
are known, then the value of Planck's Constant
can be found.
Objective:
1. Study photoelectric effect.
2. Measuring and Calculating Planck's constant, h.
Introduction:
 When light strikes a metallic surface, electrons are
emitted from the surface. This effect is called the
photoelectric effect. The emitted electrons, called
photoelectrons, have varying kinetic energies that are
primarily dependent upon the frequency of the light that
strikes the surface.
History:
 In 1905 Albert Einstein was able to provide an
explanation of the photoelectric effect. He proposed that
light acts like a particle having energy equal to hf, where
h is Planck's constant and f is the frequency of the
incident light. These particles of light, called photons or
quanta collide with and transfer energy to the electrons
in the metal.
Theory:
 The emitted electrons then use part of this energy to
migrate to the surface of the metal and part to free
themselves from the electrostatic attraction of the
metallic surface; the remainder goes into the kinetic
energy of the electrons. For those electrons at the surface
of the metal, no energy is used by the electrons to
migrate to the surface, and thus, these electrons end up
with the maximum possible kinetic energy, Kmax.
Mathematical form:
This can be expressed mathematically as ,
hf = Wf + Kmax (1)
where,
 Ek max is the maximum kinetic energy in J.
 h = 6.63 x 10⁻³⁴ Js (Planck’s constant)
 f = photon frequency in Hz
 W= work function of the metal in J. i.e., the energy
needed to remove the electron from the surface.
Mathematical form:
Therefore, ,
Wf = hfo (2)
And Eqn (1) becomes .
hf = hfo + Kmax (3)
The excess energy of photon appears as kinetic energy of
the electron, so that
Kmax = hf- hfo
which is the famous photoelectric equation formulated
by Einstein in 1905.
Cont…
At this voltage the maximum kinetic energy of the
electrons is ,
Kmax = eVS (4)
and therefore,
eVS= hf- Wf (5)
where e = the electronic charge 1.602 x 10⁻¹⁹ C and Vs
is the stopping potential.
By experimentally determining the stopping potential for
several values of the frequency of the incident light and
using (5) above, Planck's constant can be determined.
Apparatus:
 Light source
 Digital voltmeter
 Ammeter
 Vacuum photo tube
 Filters of different colors
Apparatus:
Procedure:
 Plug in and turn on the light source. Place the light
source directly in front of the opening to the phototube.
 Note down the wavelength of the filter and insert it in
the slot above the phototube.
 Insert the red color filter (635nm)
 Set light intensity switch at strong light
 Voltage direction switch at ‘-‘
 Display mode switch at current display.
Procedure:
 Adjust to de-accelerating voltage to 0 V and set current
multiplier at X0.001.
 Increase the de-accelerating to decrease the photo
current to zero.
 Take down the de-accelerating voltage (Vs)
corresponding to zero current of 635nm wavelength.
 Get the Vs of other wave lengths, the same way.
 (Repeat for at least 2 distances say 40cm and 30cm).
Observation and calculations:
Filters v (sec-1 x10^14) Stopping voltage
Red(635nm) 4.7 2 -0.30
Yellow 1 (585nm) 5.1 3 -0.55
Yellow 2 (540nm) 5.5 -0.75
Green(500nm) 6.0 -0.85
Blue(460nm) 6.5 -1.05
Observation and calculations:
 From graph Vs (stopping potential) vs v (frequency)
h = e × slope of graph
h = e × ∆Vs/∆v
h=1.6x10-19 x 0.366
Substituting the values of ∆Vs and ∆v from graph
h can be found, h = 5.85x10⁻³⁴ Joule– sec.
Standard value of h = 6.62x10⁻³⁴ Joules-sec.
Graph:
Precautions:
 The instrument should be kept in dust proof and
moisture proof environment, if there is dust on the
phototube, color filter, lens etc.
 clean it by using absorbent cotton with a few drops of
alcohol.
 The colour filter should be stored in dry and dust proof
environment.
 After finishing the experiment remember to switch off
power and cover the drawtube with the lens cover
provided. Phototube is light sensitive device and its
sensitivity decrease with exposure to light and due to
ageing.
Reference:
 http://www.ifsc.usp.br/~lavfis2/BancoApostilasImagens/ApConstan
tePlanck/ApCtePlanck2013/Planck%20Constant.pdf
 https://www.iitr.ac.in/departments/PH/uploads/Teaching%20Laborat
ory/14a%20Plancks%20constant%20Photo%20Electric%20Effect.p
df
 https://www.iitr.ac.in/departments/PH/uploads/Teaching%20Laborat
ory/14a%20Plancks%20constant%20Photo%20Electric%20Effect.p
df
Video link:
 https://www.youtube.com/watch?v=Dek_Sq1Sulg
 https://www.youtube.com/watch?v=MJdZdlC6j8s
Planck constant using photoelectric effect

Planck constant using photoelectric effect

  • 1.
    Planck constant using PhotoelectricEffect Sumayyah Ata 18501510-072 BS-Physics-VI-(B) LAB-VI TO: Dr.Tahir Iqbal Awan
  • 2.
    Content:  Abstract  Objective Introduction (History + Theory)  Mathematical Form  Apparatus  Procedure  Observation  Calculation & Result  Graph  Conclusion
  • 3.
    Abstract:  In thisexperiment we Measure Planck’s Constant Using the Photoelectric Effect.  First of all we arrange apparatus as we arrange photoelectric effect apparatus.  Then we incident different wavelength photon and calculate stopping voltage of electrons that’s emit due to photo electric effect. The electrons then flow through the phototube to the collector and create a current flow.  A voltage called the stopping voltage or stopping potential is applied to prevent the flow of photoelectrons.
  • 4.
    Abstract:  Secondly wedraw graph between frequency and stopping potential then by using slope formula that’s nothing else Einstein equation. If the frequencies or wavelengths of the incoming light and the corresponding stopping voltages are known, then the value of Planck's Constant can be found.
  • 5.
    Objective: 1. Study photoelectriceffect. 2. Measuring and Calculating Planck's constant, h.
  • 6.
    Introduction:  When lightstrikes a metallic surface, electrons are emitted from the surface. This effect is called the photoelectric effect. The emitted electrons, called photoelectrons, have varying kinetic energies that are primarily dependent upon the frequency of the light that strikes the surface.
  • 7.
    History:  In 1905Albert Einstein was able to provide an explanation of the photoelectric effect. He proposed that light acts like a particle having energy equal to hf, where h is Planck's constant and f is the frequency of the incident light. These particles of light, called photons or quanta collide with and transfer energy to the electrons in the metal.
  • 8.
    Theory:  The emittedelectrons then use part of this energy to migrate to the surface of the metal and part to free themselves from the electrostatic attraction of the metallic surface; the remainder goes into the kinetic energy of the electrons. For those electrons at the surface of the metal, no energy is used by the electrons to migrate to the surface, and thus, these electrons end up with the maximum possible kinetic energy, Kmax.
  • 9.
    Mathematical form: This canbe expressed mathematically as , hf = Wf + Kmax (1) where,  Ek max is the maximum kinetic energy in J.  h = 6.63 x 10⁻³⁴ Js (Planck’s constant)  f = photon frequency in Hz  W= work function of the metal in J. i.e., the energy needed to remove the electron from the surface.
  • 10.
    Mathematical form: Therefore, , Wf= hfo (2) And Eqn (1) becomes . hf = hfo + Kmax (3) The excess energy of photon appears as kinetic energy of the electron, so that Kmax = hf- hfo which is the famous photoelectric equation formulated by Einstein in 1905.
  • 11.
    Cont… At this voltagethe maximum kinetic energy of the electrons is , Kmax = eVS (4) and therefore, eVS= hf- Wf (5) where e = the electronic charge 1.602 x 10⁻¹⁹ C and Vs is the stopping potential. By experimentally determining the stopping potential for several values of the frequency of the incident light and using (5) above, Planck's constant can be determined.
  • 12.
    Apparatus:  Light source Digital voltmeter  Ammeter  Vacuum photo tube  Filters of different colors
  • 13.
  • 15.
    Procedure:  Plug inand turn on the light source. Place the light source directly in front of the opening to the phototube.  Note down the wavelength of the filter and insert it in the slot above the phototube.  Insert the red color filter (635nm)  Set light intensity switch at strong light  Voltage direction switch at ‘-‘  Display mode switch at current display.
  • 16.
    Procedure:  Adjust tode-accelerating voltage to 0 V and set current multiplier at X0.001.  Increase the de-accelerating to decrease the photo current to zero.  Take down the de-accelerating voltage (Vs) corresponding to zero current of 635nm wavelength.  Get the Vs of other wave lengths, the same way.  (Repeat for at least 2 distances say 40cm and 30cm).
  • 17.
    Observation and calculations: Filtersv (sec-1 x10^14) Stopping voltage Red(635nm) 4.7 2 -0.30 Yellow 1 (585nm) 5.1 3 -0.55 Yellow 2 (540nm) 5.5 -0.75 Green(500nm) 6.0 -0.85 Blue(460nm) 6.5 -1.05
  • 18.
    Observation and calculations: From graph Vs (stopping potential) vs v (frequency) h = e × slope of graph h = e × ∆Vs/∆v h=1.6x10-19 x 0.366 Substituting the values of ∆Vs and ∆v from graph h can be found, h = 5.85x10⁻³⁴ Joule– sec. Standard value of h = 6.62x10⁻³⁴ Joules-sec.
  • 19.
  • 20.
    Precautions:  The instrumentshould be kept in dust proof and moisture proof environment, if there is dust on the phototube, color filter, lens etc.  clean it by using absorbent cotton with a few drops of alcohol.  The colour filter should be stored in dry and dust proof environment.  After finishing the experiment remember to switch off power and cover the drawtube with the lens cover provided. Phototube is light sensitive device and its sensitivity decrease with exposure to light and due to ageing.
  • 21.
    Reference:  http://www.ifsc.usp.br/~lavfis2/BancoApostilasImagens/ApConstan tePlanck/ApCtePlanck2013/Planck%20Constant.pdf  https://www.iitr.ac.in/departments/PH/uploads/Teaching%20Laborat ory/14a%20Plancks%20constant%20Photo%20Electric%20Effect.p df https://www.iitr.ac.in/departments/PH/uploads/Teaching%20Laborat ory/14a%20Plancks%20constant%20Photo%20Electric%20Effect.p df Video link:  https://www.youtube.com/watch?v=Dek_Sq1Sulg  https://www.youtube.com/watch?v=MJdZdlC6j8s