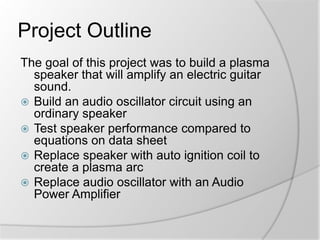
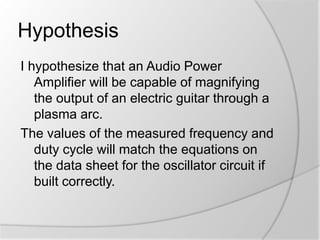
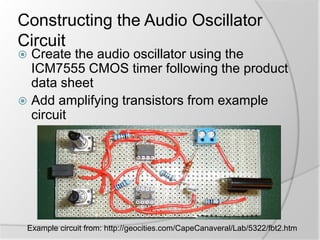
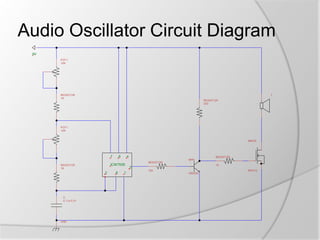
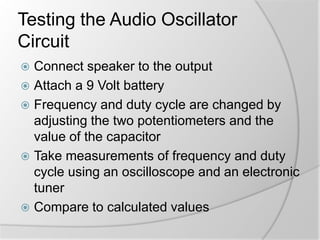
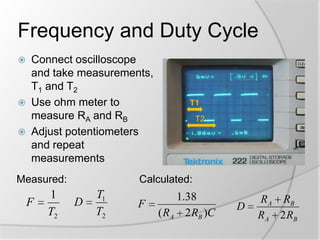
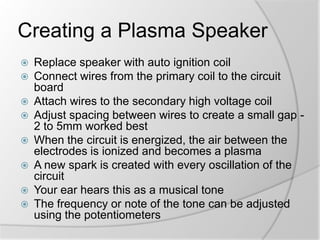
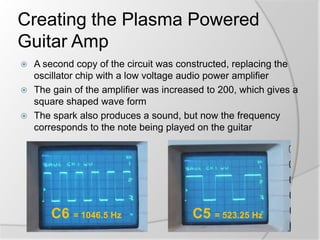
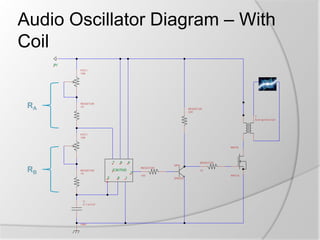
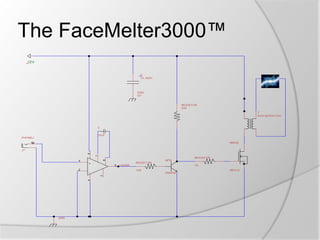
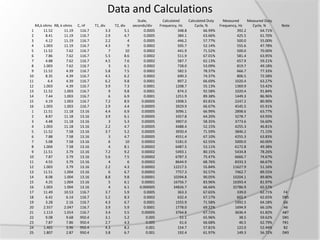
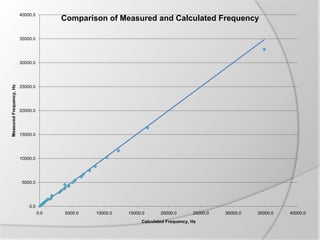
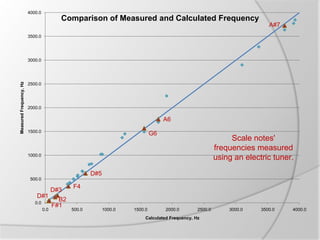
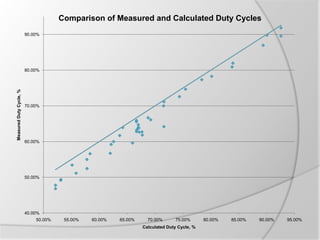
JOE GROELE
Project Outline
The goal of this project was to build a plasma
speaker that will amplify an electric guitar
sound.
 Build an audio oscillator circuit using an
ordinary speaker
 Test speaker performance compared to
equations on data sheet
 Replace speaker with auto ignition coil to
create a plasma arc
 Replace audio oscillator with an Audio
Power Amplifier
Hypothesis
I hypothesize that an Audio Power
Amplifier will be capable of magnifying
the output of an electric guitar through a
plasma arc.
The values of the measured frequency and
duty cycle will match the equations on
the data sheet for the oscillator circuit if
built correctly.
Materials
















Solder
Soldering iron
Wire
Wire strippers
Wire Cutters
Multimeter
Oscilloscope
Electronic tuner
Perf board
Auto spark ignition
Connector terminal
Power connector
Guitar input jack
















Eight pin DIP socket
0.01 µF capacitor
0.1 µF capacitor
10 ohm resistor
330 ohm resistor
100 ohm resistor
1 K ohm resistor
10 K ohm potentiometer
IRF510 MOSFET
transistor
P2N2222 transistor
ICM7555 CMOS timer
LM386 audio power
amplifier
Constructing the Audio Oscillator
Circuit

Create the audio oscillator using the
ICM7555 CMOS timer following the product
data sheet
 Add amplifying transistors from example
circuit


Example circuit from: http://geocities.com/CapeCanaveral/Lab/5322/fbt2.htm
Audio Oscillator Circuit Diagram
9V
POT1
10K

RESISTOR
1K

SPEAKER
RESISTOR
330

POT1
10K

NMOS

7

8

4

RESISTOR
NPN

ICM7555

RESISTOR
1K

2

C
0.1 or 0.01

GND

6

1

RESISTOR
10

3
100

IRF510
2N2222
Testing the Audio Oscillator
Circuit
Connect speaker to the output
 Attach a 9 Volt battery
 Frequency and duty cycle are changed by
adjusting the two potentiometers and the
value of the capacitor
 Take measurements of frequency and duty
cycle using an oscilloscope and an electronic
tuner
 Compare to calculated values

Frequency and Duty Cycle
Connect oscilloscope
and take measurements,
T1 and T2
 Use ohm meter to
measure RA and RB
 Adjust potentiometers
and repeat
measurements


Measured:

F

1
T2

T1
T2

Calculated:

D

T1
T2

F

1.38
( RA 2 RB )C

D

R A RB
RA 2 RB
Creating a Plasma Speaker











Replace speaker with auto ignition coil
Connect wires from the primary coil to the circuit
board
Attach wires to the secondary high voltage coil
Adjust spacing between wires to create a small gap 2 to 5mm worked best
When the circuit is energized, the air between the
electrodes is ionized and becomes a plasma
A new spark is created with every oscillation of the
circuit
Your ear hears this as a musical tone
The frequency or note of the tone can be adjusted
using the potentiometers
Creating the Plasma Powered
Guitar Amp
A second copy of the circuit was constructed, replacing the
oscillator chip with a low voltage audio power amplifier
 The gain of the amplifier was increased to 200, which gives a
square shaped wave form
 The spark also produces a sound, but now the frequency
corresponds to the note being played on the guitar


C6 = 1046.5 Hz

C5 = 523.25 Hz
Audio Oscillator Diagram – With
Coil
9V
POT1
10K

RA

RESISTOR
1K

RESISTOR
330
T
Auto Ignition Coil

POT1
10K

NMOS

7

RB

8

4

RESISTOR
NPN

ICM7555

RESISTOR
1K

2

C
0.1 or 0.01

GND

6

1

RESISTOR
10

3
100

IRF510
2N2222
The FaceMelter3000™
12V

C
10, 450V
..

GND
G?

RESIST OR
330
T
Auto Ignition Coil

C
10uF
PHONEJ

tip

NMOS

1

6

J?
RESIST OR
RESIST OR

+

5

2

10
IRF510
2N2222

7
4

LM386
100

-

GND

NPN

8

3
Data and Calculations
RA,k ohms RB, k ohms
1
11.52
11.19
2
8.41
11.19
3
4.12
11.19
4
1.003
11.19
5
11.52
7.62
6
7.86
7.62
7
4.88
7.62
8
1.003
7.62
9
11.52
4.39
10
8.35
4.39
11
4.4
4.39
12
1.003
4.39
13
11.52
1.003
14
7.44
1.003
15
4.19
1.003
16
1.003
1.003
1
11.51
11.18
2
8.87
11.18
3
4.48
11.18
4
1.003
11.18
5
11.52
7.58
6
7.88
7.58
7
5.08
7.58
8
1.004
7.58
9
11.51
3.79
10
7.87
3.79
11
4.55
3.79
12
1.003
3.79
13
11.51
1.004
14
8.08
1.004
15
4.25
1.004
16
1.003
1.004
17
11.49
10.53
18
6.42
6.14
19
3.28
2.16
20
2.557
2.047
21
1.113
1.014
22
9.08
9.68
23
7.87
7.86
24
1.465
3.96
25
1.807
2.87

C, nF
116.7
116.7
116.7
116.7
116.7
116.7
116.7
116.7
116.7
116.7
116.7
116.7
116.7
116.7
116.7
116.7
13.16
13.16
13.16
13.16
13.16
13.16
13.16
13.16
13.16
13.16
13.16
13.16
13.16
13.16
13.16
13.16
116.7
116.7
116.7
116.7
116.7
950.4
950.4
950.4
950.4

T1, div
3.3
2.9
2.2
4.3
7
5.5
4.5
3
5.8
4.5
6.2
3.9
9
6
7.2
2.9
4.4
3.9
3
2.2
3.7
3
6
4
7.2
5.6
4
2.2
6
8.8
5
4
3.7
5.2
4.3
3.9
3.4
3.1
2.7
4.3
3.8

Scale,
T2, div
seconds/div
5.1
0.0005
4.7
0.0005
4
0.0005
9
0.0002
10
0.0002
8.6
0.0002
7.6
0.0002
6.1
0.0002
7.5
0.0002
6.2
0.0002
9.8
0.0001
7.3
0.0001
9.8
0.0001
6.9
0.0001
8.9
0.00005
4.4
0.00005
6.9
0.00005
6.1
0.00005
5.3
0.00005
4.7
0.00005
5.2
0.00005
4.7
0.00005
10
0.00002
8.1
0.00002
9.2
0.00002
7.5
0.00002
6
0.00002
4.3
0.00002
6.7
0.00002
9.8
0.00001
6.1
0.00001
6.1
0.000005
5.9
0.0005
8.3
0.0002
6.7
0.0001
5.9
0.0001
5.5
0.00005
5.2
0.005
4.3
0.005
8.2
0.001
6.7
0.001

Calculated
Calculated Duty
Frequency, Hz
Cycle, %
348.8
66.99%
384.1
63.66%
446.2
57.77%
505.7
52.14%
441.9
71.52%
511.9
67.01%
587.7
62.13%
728.0
53.09%
582.5
78.37%
690.3
74.37%
897.2
66.69%
1208.7
55.13%
874.3
92.58%
1251.9
89.38%
1908.5
83.81%
3929.9
66.67%
3096.1
66.99%
3357.8
64.20%
3907.0
58.35%
4488.4
52.15%
3930.4
71.59%
4551.4
67.10%
5181.0
62.55%
6487.5
53.11%
5493.1
80.15%
6787.3
75.47%
8644.9
68.76%
12217.5
55.84%
7757.3
92.57%
10394.8
90.05%
16756.7
83.96%
34826.7
66.66%
363.3
67.65%
632.4
67.17%
1555.9
71.58%
1778.0
69.22%
3764.8
67.72%
51.1
65.96%
61.6
66.68%
154.7
57.81%
192.4
61.97%

Measured
Measured Duty
Frequency, Hz
Cycle, %
392.2
64.71%
425.5
61.70%
500.0
55.00%
555.6
47.78%
500.0
70.00%
581.4
63.95%
657.9
59.21%
819.7
49.18%
666.7
77.33%
806.5
72.58%
1020.4
63.27%
1369.9
53.42%
1020.4
91.84%
1449.3
86.96%
2247.2
80.90%
4545.5
65.91%
2898.6
63.77%
3278.7
63.93%
3773.6
56.60%
4255.3
46.81%
3846.2
71.15%
4255.3
63.83%
5000.0
60.00%
6172.8
49.38%
5434.8
78.26%
6666.7
74.67%
8333.3
66.67%
11627.9
51.16%
7462.7
89.55%
10204.1
89.80%
16393.4
81.97%
32786.9
65.57%
339.0
62.71%
602.4
62.65%
1492.5
64.18%
1694.9
66.10%
3636.4
61.82%
38.5
59.62%
46.5
62.79%
122.0
52.44%
149.3
56.72%

Note

F4
D#5
G6
A6
A#7
D#1
F#1
B2
D#3
40000.0

Comparison of Measured and Calculated Frequency

35000.0

Measured Frequency, Hz

30000.0

25000.0

20000.0

15000.0

10000.0

5000.0

0.0

0.0

5000.0

10000.0

15000.0

20000.0

25000.0

Calculated Frequency, Hz

30000.0

35000.0

40000.0
4000.0

Comparison of Measured and Calculated Frequency

A#7

3500.0

Measured Frequency, Hz

3000.0

2500.0

2000.0

A6
1500.0

G6

Scale notes'
frequencies measured
using an electric tuner.

1000.0

D#5
500.0

D#3
D#1
0.0
0.0

B2
F#1

F4

500.0

1000.0

1500.0

2000.0

2500.0

Calculated Frequency, Hz

3000.0

3500.0

4000.0
Comparison of Measured and Calculated Duty Cycles
90.00%

Measured Duty Cycle, %

80.00%

70.00%

60.00%

50.00%

40.00%
50.00%

55.00%

60.00%

65.00%

70.00%

75.00%

Calculated Duty Cycle, %

80.00%

85.00%

90.00%

95.00%
Conclusions
Measured values of frequency and duty
cycle were only two significant
figures, resulting in less accuracy
 The electronic tuner was more accurate
than the oscilloscope because the
tuner, like an ear, can hear smaller
differences in frequency – verified by
comparing the pitch to a piano
 The plasma guitar amplifier produced a
satisfactory sound, but the volume and
sustain could be dramatically improved


Face melter3000 presentation

  • 1.
  • 2.
    Project Outline The goalof this project was to build a plasma speaker that will amplify an electric guitar sound.  Build an audio oscillator circuit using an ordinary speaker  Test speaker performance compared to equations on data sheet  Replace speaker with auto ignition coil to create a plasma arc  Replace audio oscillator with an Audio Power Amplifier
  • 3.
    Hypothesis I hypothesize thatan Audio Power Amplifier will be capable of magnifying the output of an electric guitar through a plasma arc. The values of the measured frequency and duty cycle will match the equations on the data sheet for the oscillator circuit if built correctly.
  • 4.
    Materials              Solder Soldering iron Wire Wire strippers WireCutters Multimeter Oscilloscope Electronic tuner Perf board Auto spark ignition Connector terminal Power connector Guitar input jack             Eight pin DIP socket 0.01 µF capacitor 0.1 µF capacitor 10 ohm resistor 330 ohm resistor 100 ohm resistor 1 K ohm resistor 10 K ohm potentiometer IRF510 MOSFET transistor P2N2222 transistor ICM7555 CMOS timer LM386 audio power amplifier
  • 5.
    Constructing the AudioOscillator Circuit Create the audio oscillator using the ICM7555 CMOS timer following the product data sheet  Add amplifying transistors from example circuit  Example circuit from: http://geocities.com/CapeCanaveral/Lab/5322/fbt2.htm
  • 6.
    Audio Oscillator CircuitDiagram 9V POT1 10K RESISTOR 1K SPEAKER RESISTOR 330 POT1 10K NMOS 7 8 4 RESISTOR NPN ICM7555 RESISTOR 1K 2 C 0.1 or 0.01 GND 6 1 RESISTOR 10 3 100 IRF510 2N2222
  • 7.
    Testing the AudioOscillator Circuit Connect speaker to the output  Attach a 9 Volt battery  Frequency and duty cycle are changed by adjusting the two potentiometers and the value of the capacitor  Take measurements of frequency and duty cycle using an oscilloscope and an electronic tuner  Compare to calculated values 
  • 8.
    Frequency and DutyCycle Connect oscilloscope and take measurements, T1 and T2  Use ohm meter to measure RA and RB  Adjust potentiometers and repeat measurements  Measured: F 1 T2 T1 T2 Calculated: D T1 T2 F 1.38 ( RA 2 RB )C D R A RB RA 2 RB
  • 9.
    Creating a PlasmaSpeaker         Replace speaker with auto ignition coil Connect wires from the primary coil to the circuit board Attach wires to the secondary high voltage coil Adjust spacing between wires to create a small gap 2 to 5mm worked best When the circuit is energized, the air between the electrodes is ionized and becomes a plasma A new spark is created with every oscillation of the circuit Your ear hears this as a musical tone The frequency or note of the tone can be adjusted using the potentiometers
  • 10.
    Creating the PlasmaPowered Guitar Amp A second copy of the circuit was constructed, replacing the oscillator chip with a low voltage audio power amplifier  The gain of the amplifier was increased to 200, which gives a square shaped wave form  The spark also produces a sound, but now the frequency corresponds to the note being played on the guitar  C6 = 1046.5 Hz C5 = 523.25 Hz
  • 11.
    Audio Oscillator Diagram– With Coil 9V POT1 10K RA RESISTOR 1K RESISTOR 330 T Auto Ignition Coil POT1 10K NMOS 7 RB 8 4 RESISTOR NPN ICM7555 RESISTOR 1K 2 C 0.1 or 0.01 GND 6 1 RESISTOR 10 3 100 IRF510 2N2222
  • 12.
    The FaceMelter3000™ 12V C 10, 450V .. GND G? RESISTOR 330 T Auto Ignition Coil C 10uF PHONEJ tip NMOS 1 6 J? RESIST OR RESIST OR + 5 2 10 IRF510 2N2222 7 4 LM386 100 - GND NPN 8 3
  • 13.
    Data and Calculations RA,kohms RB, k ohms 1 11.52 11.19 2 8.41 11.19 3 4.12 11.19 4 1.003 11.19 5 11.52 7.62 6 7.86 7.62 7 4.88 7.62 8 1.003 7.62 9 11.52 4.39 10 8.35 4.39 11 4.4 4.39 12 1.003 4.39 13 11.52 1.003 14 7.44 1.003 15 4.19 1.003 16 1.003 1.003 1 11.51 11.18 2 8.87 11.18 3 4.48 11.18 4 1.003 11.18 5 11.52 7.58 6 7.88 7.58 7 5.08 7.58 8 1.004 7.58 9 11.51 3.79 10 7.87 3.79 11 4.55 3.79 12 1.003 3.79 13 11.51 1.004 14 8.08 1.004 15 4.25 1.004 16 1.003 1.004 17 11.49 10.53 18 6.42 6.14 19 3.28 2.16 20 2.557 2.047 21 1.113 1.014 22 9.08 9.68 23 7.87 7.86 24 1.465 3.96 25 1.807 2.87 C, nF 116.7 116.7 116.7 116.7 116.7 116.7 116.7 116.7 116.7 116.7 116.7 116.7 116.7 116.7 116.7 116.7 13.16 13.16 13.16 13.16 13.16 13.16 13.16 13.16 13.16 13.16 13.16 13.16 13.16 13.16 13.16 13.16 116.7 116.7 116.7 116.7 116.7 950.4 950.4 950.4 950.4 T1, div 3.3 2.9 2.2 4.3 7 5.5 4.5 3 5.8 4.5 6.2 3.9 9 6 7.2 2.9 4.4 3.9 3 2.2 3.7 3 6 4 7.2 5.6 4 2.2 6 8.8 5 4 3.7 5.2 4.3 3.9 3.4 3.1 2.7 4.3 3.8 Scale, T2, div seconds/div 5.1 0.0005 4.7 0.0005 4 0.0005 9 0.0002 10 0.0002 8.6 0.0002 7.6 0.0002 6.1 0.0002 7.5 0.0002 6.2 0.0002 9.8 0.0001 7.3 0.0001 9.8 0.0001 6.9 0.0001 8.9 0.00005 4.4 0.00005 6.9 0.00005 6.1 0.00005 5.3 0.00005 4.7 0.00005 5.2 0.00005 4.7 0.00005 10 0.00002 8.1 0.00002 9.2 0.00002 7.5 0.00002 6 0.00002 4.3 0.00002 6.7 0.00002 9.8 0.00001 6.1 0.00001 6.1 0.000005 5.9 0.0005 8.3 0.0002 6.7 0.0001 5.9 0.0001 5.5 0.00005 5.2 0.005 4.3 0.005 8.2 0.001 6.7 0.001 Calculated Calculated Duty Frequency, Hz Cycle, % 348.8 66.99% 384.1 63.66% 446.2 57.77% 505.7 52.14% 441.9 71.52% 511.9 67.01% 587.7 62.13% 728.0 53.09% 582.5 78.37% 690.3 74.37% 897.2 66.69% 1208.7 55.13% 874.3 92.58% 1251.9 89.38% 1908.5 83.81% 3929.9 66.67% 3096.1 66.99% 3357.8 64.20% 3907.0 58.35% 4488.4 52.15% 3930.4 71.59% 4551.4 67.10% 5181.0 62.55% 6487.5 53.11% 5493.1 80.15% 6787.3 75.47% 8644.9 68.76% 12217.5 55.84% 7757.3 92.57% 10394.8 90.05% 16756.7 83.96% 34826.7 66.66% 363.3 67.65% 632.4 67.17% 1555.9 71.58% 1778.0 69.22% 3764.8 67.72% 51.1 65.96% 61.6 66.68% 154.7 57.81% 192.4 61.97% Measured Measured Duty Frequency, Hz Cycle, % 392.2 64.71% 425.5 61.70% 500.0 55.00% 555.6 47.78% 500.0 70.00% 581.4 63.95% 657.9 59.21% 819.7 49.18% 666.7 77.33% 806.5 72.58% 1020.4 63.27% 1369.9 53.42% 1020.4 91.84% 1449.3 86.96% 2247.2 80.90% 4545.5 65.91% 2898.6 63.77% 3278.7 63.93% 3773.6 56.60% 4255.3 46.81% 3846.2 71.15% 4255.3 63.83% 5000.0 60.00% 6172.8 49.38% 5434.8 78.26% 6666.7 74.67% 8333.3 66.67% 11627.9 51.16% 7462.7 89.55% 10204.1 89.80% 16393.4 81.97% 32786.9 65.57% 339.0 62.71% 602.4 62.65% 1492.5 64.18% 1694.9 66.10% 3636.4 61.82% 38.5 59.62% 46.5 62.79% 122.0 52.44% 149.3 56.72% Note F4 D#5 G6 A6 A#7 D#1 F#1 B2 D#3
  • 14.
    40000.0 Comparison of Measuredand Calculated Frequency 35000.0 Measured Frequency, Hz 30000.0 25000.0 20000.0 15000.0 10000.0 5000.0 0.0 0.0 5000.0 10000.0 15000.0 20000.0 25000.0 Calculated Frequency, Hz 30000.0 35000.0 40000.0
  • 15.
    4000.0 Comparison of Measuredand Calculated Frequency A#7 3500.0 Measured Frequency, Hz 3000.0 2500.0 2000.0 A6 1500.0 G6 Scale notes' frequencies measured using an electric tuner. 1000.0 D#5 500.0 D#3 D#1 0.0 0.0 B2 F#1 F4 500.0 1000.0 1500.0 2000.0 2500.0 Calculated Frequency, Hz 3000.0 3500.0 4000.0
  • 16.
    Comparison of Measuredand Calculated Duty Cycles 90.00% Measured Duty Cycle, % 80.00% 70.00% 60.00% 50.00% 40.00% 50.00% 55.00% 60.00% 65.00% 70.00% 75.00% Calculated Duty Cycle, % 80.00% 85.00% 90.00% 95.00%
  • 17.
    Conclusions Measured values offrequency and duty cycle were only two significant figures, resulting in less accuracy  The electronic tuner was more accurate than the oscilloscope because the tuner, like an ear, can hear smaller differences in frequency – verified by comparing the pitch to a piano  The plasma guitar amplifier produced a satisfactory sound, but the volume and sustain could be dramatically improved 