SlideShare a Scribd company logo
SESSION 2 DEMO:
session 2 demo:
CHARTS, GRAPHS, AND ICONS
charts, graphs, and icons

PLAN601E VERBAL ANDInformation Graphics (session 2)
VISUAL: INFORMATION GRAPHICS (SESSION 2)
PLAN601E Verbal and visual:
copy exercise files
make a local copy of folder: session 2 exercise files
charts in adobe illustrator
overview of tools and panels
creating pie charts and bar charts using excel data
introduction
to adobe illustrator

More detail on Course Blog under ‘Resource Library’
menus
1

creating a pie chart
with adobe illustrator

1) Create a new document.
chart
tool

creating a pie chart
with adobe illustrator

2

2) Use the Chart Tool to make 4” x 4” pie chart.
Let’s make two pie charts: one showing proportion of citywide population represented
by CD3 and another showing the proportion of CD3 represented by your census tract.

MENUS
1

3
pop. data

CREATING A PIE CHART
WITH ADOBE ILLUSTRATOR

Steps: 1) open template.

cd3 vs.
[city - cd3]

creating a pie chart
with adobe illustrator

tract vs.
[cd3 - tract]

2) Paste population data into table.
4
object
menu

creating a pie chart
with adobe illustrator

4) Ungroup each chart three times.
6
5
6

creating a pie chart
with adobe illustrator

6) Create a palette. 5) Select part of chart you want to color with
select tool; Use eyedropper tool to color the polygon.
Let’s use the sort functions in Excel in order to visually
organize census data based on our own study area zones.

1

find /
replace

creating a bar graph
with adobe illustrator

1) Clean up data utilizing Find & Replace.
Let’s use the sort functions in Excel in order to visually
organize census data based on our own study area zones.

area a

area b

area c

creating a bar graph
with adobe illustrator

2) Insert a column to add a letter code for each census
tract’s zone
Let’s use the sort functions in Excel in order to visually
organize census data based on our own study area zones.

2

creating a bar graph
with adobe illustrator

2) Insert a column and add a letter code for each census
tract’s zone
Use the sort function to organize census data based on the study area zones.

sort

3

creating a bar graph
with adobe illustrator

3) Sort the data based on the new column.
Let’s generate some percentages for households
where non-relatives are living.

5

formula
4
5

creating a bar graph
with adobe illustrator

4) Hide extraneous columns; add a column; sum family and nonfamily HH with non-relatives; 5) Divide new column by total HH.
6

6

creating a bar graph
with adobe illustrator

6) Use Chart Tool to create 6” x 4” bar graph.
7

8

creating a bar graph
with adobe illustrator

7) Paste total HH into table; enter a new ‘dummy’ maximum
value in the last row; 8) Make a second chart and paste total nonrelatives into table. Add the same ‘dummy’ maximum, for scale.
9

creating a bar graph
with adobe illustrator

9

9) Build a color palette. Close table window for bar graph. Ungroup
both graphs 3 times; delete all lines and labels from non-relative
graph; use eyedropper to color bars with your palette.
10

s

creating a bar graph
with adobe illustrator

10) Use Align panel to overlay the two sets of bars; use the Direct
Selection tool to delete the far-most right bar (our ‘dummy’ bar).
Delete the horizontal tick marks along the x-axis.
12
14
13

stroke
palette

11

creating a bar graph
with adobe illustrator

11) Add color to Total HH bars; 12) Ungroup all bars; use Selection
tool to create space between zones; 13) Add labels and use Rotate
tool for t; 14) Extend and modify line weights of axes.
15

15

creating a bar graph
with adobe illustrator

15) Add labels for percentages. Where text overlaps with axes,
delete background lines using Scissors tool.
16

creating a bar graph
with adobe illustrator

16) Use ‘Find Font’ to replace fonts with preferred; adjust boxes
and positions accordingly.
18

18

17

creating a bar graph
with adobe illustrator

17) Add labels for title, units, areas, key. 18) Use rectangle tool to
create background shading.
creating a bar graph
with adobe illustrator

19) Remove any unnecessary lines.
Creating an icon in adobe illustrator
Let’s first borrow an icon from the Internet
and convert a jpeg into vectors we can work with.

1

creating AN ICON
with adobe illustrator

1) Download a jpeg of an icon that has clean lines and few colors
and File>Place it in illustrator.
Let’s first borrow an icon from the Internet
and convert a jpeg into vectors we can work with.

3

2

creating AN ICON
with adobe illustrator

2) Select Object >Live Trace>Make and Expand to have
Illustrator approximate a series of vectors of the jpeg
Let’s first borrow an icon from the Internet
and convert a jpeg into vectors we can work with.

3

4

creating AN ICON
with adobe illustrator

3) Ungroup; Use the Direct Selection Tool to delete extraneous
vectors.
Let’s first borrow an icon from the Internet
and convert a jpeg into vectors we can work with.

4

creating AN ICON
with adobe illustrator

4) Edit colors, styles, etc. You can also copy/paste the icon into
InDesign.
Another approach is to create an icon
by tracing over a photograph.

5

creating AN ICON
with adobe illustrator

5

5) Place a jpeg of a photo with a clear figure in Illustrator. Lock its
layer.
Another approach is to create an icon
by tracing over a photograph.

6
6

creating AN ICON
with adobe illustrator

6) In a new layer, use the pen tool to trace the edges of the figure.
Another approach is to create an icon
by tracing over a photograph.

7

creating AN ICON
with adobe illustrator

7) Trace other important visual features.
Another approach is to create an icon
by tracing over a photograph.

8

creating AN ICON
with adobe illustrator

8) Add lines if needed to describe the figure.
Another approach is to create an icon
by tracing over a photograph.

9
9

creating AN ICON
with adobe illustrator

9) Use direct selection tool and color palette to color the icon.
Another approach is to create an icon
by tracing over a photograph.

10
10

creating AN ICON
with adobe illustrator

10) Use direct selection tool and color palette to color the icon.
Another approach is to create an icon
by tracing over a photograph.

11

creating AN ICON
with adobe illustrator

11) Select any secondary line or shape overlaid on your flat color
and use Object>Path>Divide Objects Below to punch through
your shapes and create new polygons.
A third way to create an icon is to convert
typographic icons to vectors.

12

12

creating AN ICON
with adobe illustrator

12) Find an icon in a font that you like.
A third way to create an icon is to convert
typographic icons to vectors.

13

creating AN ICON
with adobe illustrator

13) Paste character into a new text box, select box with direct
selection tool, and use Type>Create Outlines.
A third way to create an icon is to convert
typographic icons to vectors.

14

creating AN ICON
with adobe illustrator

14) Ungroup the vectors.
A third way to create an icon is to convert
typographic icons to vectors.

15

creating AN ICON
with adobe illustrator

15) Edit colors, styles, etc. You can also copy/paste the icon into
InDesign.
You can also use icons that are available
for download under Creative Commons.

creating AN ICON
with adobe illustrator

www.thenounproject.org
www.iconmonstr.com

More Related Content

What's hot

Plan601 e session 1 demo 20151005
Plan601 e session 1 demo 20151005Plan601 e session 1 demo 20151005
Plan601 e session 1 demo 20151005
rkottam
 
Plan601 e session 2 demo
Plan601 e session 2 demoPlan601 e session 2 demo
Plan601 e session 2 demo
rkottam
 
Plan601 e session 4 demo
Plan601 e session 4 demoPlan601 e session 4 demo
Plan601 e session 4 demo
rkottam
 
Plan601 e session 4 demo
Plan601 e session 4 demoPlan601 e session 4 demo
Plan601 e session 4 demo
rkottam
 
Plan601 e session 1 demo 20151005
Plan601 e session 1 demo 20151005Plan601 e session 1 demo 20151005
Plan601 e session 1 demo 20151005
rkottam
 
Corel Draw Beginner Tutorial: How to Make a New Product Flyer
Corel Draw Beginner Tutorial: How to Make a New Product FlyerCorel Draw Beginner Tutorial: How to Make a New Product Flyer
Corel Draw Beginner Tutorial: How to Make a New Product Flyer
Flyer Tutor
 
Corel draw 12 notes
Corel draw 12 notesCorel draw 12 notes
Corel draw 12 notes
SirajRock
 
Corel draw 14 hindi notes
Corel draw 14 hindi notesCorel draw 14 hindi notes
Corel draw 14 hindi notes
SirajRock
 
Presentation On Coral Draw By Batra Computer Centre
Presentation On Coral Draw By Batra Computer CentrePresentation On Coral Draw By Batra Computer Centre
Presentation On Coral Draw By Batra Computer Centre
Batra Computer Centre
 
Plan601E Session 2 Demo
Plan601E Session 2 DemoPlan601E Session 2 Demo
Plan601E Session 2 Demo
Michael Haggerty
 
Corel Draw Tutorial: Florist Flyer
Corel Draw Tutorial: Florist FlyerCorel Draw Tutorial: Florist Flyer
Corel Draw Tutorial: Florist Flyer
Flyer Tutor
 
Intro to inkscape
Intro to inkscapeIntro to inkscape
Intro to inkscape
DUSPviz
 
GIS practicals
GIS  practicals GIS  practicals
GIS practicals
Mehran Iqbal
 
GeoGebra 10
GeoGebra 10GeoGebra 10
GeoGebra 10
Boyd Hamulondo
 
Corel draw tools
Corel draw toolsCorel draw tools
Corel draw tools
Jancypriya M
 
GeoGebra 3
GeoGebra 3GeoGebra 3
GeoGebra 3
Boyd Hamulondo
 
Geogebra 9
Geogebra 9Geogebra 9
Geogebra 9
Boyd Hamulondo
 
Mapping with Adobe CC
Mapping with Adobe CCMapping with Adobe CC
Mapping with Adobe CC
DUSPviz
 
Inkscape - A brief
Inkscape - A briefInkscape - A brief
Inkscape - A brief
Swecha | స్వేచ్ఛ
 
Corel draw
Corel drawCorel draw
Corel draw
argusacademy
 

What's hot (20)

Plan601 e session 1 demo 20151005
Plan601 e session 1 demo 20151005Plan601 e session 1 demo 20151005
Plan601 e session 1 demo 20151005
 
Plan601 e session 2 demo
Plan601 e session 2 demoPlan601 e session 2 demo
Plan601 e session 2 demo
 
Plan601 e session 4 demo
Plan601 e session 4 demoPlan601 e session 4 demo
Plan601 e session 4 demo
 
Plan601 e session 4 demo
Plan601 e session 4 demoPlan601 e session 4 demo
Plan601 e session 4 demo
 
Plan601 e session 1 demo 20151005
Plan601 e session 1 demo 20151005Plan601 e session 1 demo 20151005
Plan601 e session 1 demo 20151005
 
Corel Draw Beginner Tutorial: How to Make a New Product Flyer
Corel Draw Beginner Tutorial: How to Make a New Product FlyerCorel Draw Beginner Tutorial: How to Make a New Product Flyer
Corel Draw Beginner Tutorial: How to Make a New Product Flyer
 
Corel draw 12 notes
Corel draw 12 notesCorel draw 12 notes
Corel draw 12 notes
 
Corel draw 14 hindi notes
Corel draw 14 hindi notesCorel draw 14 hindi notes
Corel draw 14 hindi notes
 
Presentation On Coral Draw By Batra Computer Centre
Presentation On Coral Draw By Batra Computer CentrePresentation On Coral Draw By Batra Computer Centre
Presentation On Coral Draw By Batra Computer Centre
 
Plan601E Session 2 Demo
Plan601E Session 2 DemoPlan601E Session 2 Demo
Plan601E Session 2 Demo
 
Corel Draw Tutorial: Florist Flyer
Corel Draw Tutorial: Florist FlyerCorel Draw Tutorial: Florist Flyer
Corel Draw Tutorial: Florist Flyer
 
Intro to inkscape
Intro to inkscapeIntro to inkscape
Intro to inkscape
 
GIS practicals
GIS  practicals GIS  practicals
GIS practicals
 
GeoGebra 10
GeoGebra 10GeoGebra 10
GeoGebra 10
 
Corel draw tools
Corel draw toolsCorel draw tools
Corel draw tools
 
GeoGebra 3
GeoGebra 3GeoGebra 3
GeoGebra 3
 
Geogebra 9
Geogebra 9Geogebra 9
Geogebra 9
 
Mapping with Adobe CC
Mapping with Adobe CCMapping with Adobe CC
Mapping with Adobe CC
 
Inkscape - A brief
Inkscape - A briefInkscape - A brief
Inkscape - A brief
 
Corel draw
Corel drawCorel draw
Corel draw
 

Similar to PLAN601E SESSION 2 DEMO

Plan601 e session 2 demo
Plan601 e session 2 demoPlan601 e session 2 demo
Plan601 e session 2 demo
rkottam
 
Plan601E Session 2 Demo
Plan601E Session 2 DemoPlan601E Session 2 Demo
Plan601E Session 2 Demo
Michael Haggerty
 
Plan601 e session 2 demo
Plan601 e session 2 demoPlan601 e session 2 demo
Plan601 e session 2 demo
rkottam
 
Plan601 e session 2 demo
Plan601 e session 2 demoPlan601 e session 2 demo
Plan601 e session 2 demo
rkottam
 
Plan601 e session 4 demo
Plan601 e session 4 demoPlan601 e session 4 demo
Plan601 e session 4 demo
rkottam
 
Plan601 e session 3 demo
Plan601 e session 3 demoPlan601 e session 3 demo
Plan601 e session 3 demo
rkottamasu
 
Plan601E Session 4 Demo
Plan601E Session 4 DemoPlan601E Session 4 Demo
Plan601E Session 4 Demo
Michael Haggerty
 
Plan601 e session 3 demo
Plan601 e session 3 demoPlan601 e session 3 demo
Plan601 e session 3 demo
rkottam
 
Auto cad 2007-tutorial
Auto cad 2007-tutorialAuto cad 2007-tutorial
Auto cad 2007-tutorial
Syed Javeed
 
Autocad 2007 Workbook Tutorial
Autocad 2007 Workbook TutorialAutocad 2007 Workbook Tutorial
Autocad 2007 Workbook Tutorial
JhongNatz
 
1291 fa13 assign2_cube_drawings
1291 fa13 assign2_cube_drawings1291 fa13 assign2_cube_drawings
1291 fa13 assign2_cube_drawings
NYCCTfab
 
Adobe Illustrator CC 2018
Adobe Illustrator CC 2018 Adobe Illustrator CC 2018
Adobe Illustrator CC 2018
NYCCTfab
 
Adobe Illustrator CS6 Primer
Adobe Illustrator CS6 PrimerAdobe Illustrator CS6 Primer
Adobe Illustrator CS6 Primer
NYCCTfab
 
Adobe Illustrator Tutorial en Ingles para principiantes
Adobe Illustrator Tutorial en Ingles para principiantesAdobe Illustrator Tutorial en Ingles para principiantes
Adobe Illustrator Tutorial en Ingles para principiantes
neftalycontreras1408
 
Plan601E Session 3 Demo
Plan601E Session 3 DemoPlan601E Session 3 Demo
Plan601E Session 3 Demo
Michael Haggerty
 
Application Of Geometry In Scientific Computing Using C
Application Of Geometry In Scientific Computing Using CApplication Of Geometry In Scientific Computing Using C
Application Of Geometry In Scientific Computing Using C
Iwinnosasevhonken Igiehon
 
Autocad project ppt
Autocad project pptAutocad project ppt
Autocad project ppt
Sourabh Gupta
 
AutoCad 1.pptx
AutoCad 1.pptxAutoCad 1.pptx
AutoCad 1.pptx
PankajChhabra31
 
Manual autocad 2010 english
Manual autocad 2010 englishManual autocad 2010 english
Manual autocad 2010 english
Daniel - Cristian Ene
 
Intro to Adobe Illustrator
Intro to Adobe IllustratorIntro to Adobe Illustrator
Intro to Adobe Illustrator
DUSPviz
 

Similar to PLAN601E SESSION 2 DEMO (20)

Plan601 e session 2 demo
Plan601 e session 2 demoPlan601 e session 2 demo
Plan601 e session 2 demo
 
Plan601E Session 2 Demo
Plan601E Session 2 DemoPlan601E Session 2 Demo
Plan601E Session 2 Demo
 
Plan601 e session 2 demo
Plan601 e session 2 demoPlan601 e session 2 demo
Plan601 e session 2 demo
 
Plan601 e session 2 demo
Plan601 e session 2 demoPlan601 e session 2 demo
Plan601 e session 2 demo
 
Plan601 e session 4 demo
Plan601 e session 4 demoPlan601 e session 4 demo
Plan601 e session 4 demo
 
Plan601 e session 3 demo
Plan601 e session 3 demoPlan601 e session 3 demo
Plan601 e session 3 demo
 
Plan601E Session 4 Demo
Plan601E Session 4 DemoPlan601E Session 4 Demo
Plan601E Session 4 Demo
 
Plan601 e session 3 demo
Plan601 e session 3 demoPlan601 e session 3 demo
Plan601 e session 3 demo
 
Auto cad 2007-tutorial
Auto cad 2007-tutorialAuto cad 2007-tutorial
Auto cad 2007-tutorial
 
Autocad 2007 Workbook Tutorial
Autocad 2007 Workbook TutorialAutocad 2007 Workbook Tutorial
Autocad 2007 Workbook Tutorial
 
1291 fa13 assign2_cube_drawings
1291 fa13 assign2_cube_drawings1291 fa13 assign2_cube_drawings
1291 fa13 assign2_cube_drawings
 
Adobe Illustrator CC 2018
Adobe Illustrator CC 2018 Adobe Illustrator CC 2018
Adobe Illustrator CC 2018
 
Adobe Illustrator CS6 Primer
Adobe Illustrator CS6 PrimerAdobe Illustrator CS6 Primer
Adobe Illustrator CS6 Primer
 
Adobe Illustrator Tutorial en Ingles para principiantes
Adobe Illustrator Tutorial en Ingles para principiantesAdobe Illustrator Tutorial en Ingles para principiantes
Adobe Illustrator Tutorial en Ingles para principiantes
 
Plan601E Session 3 Demo
Plan601E Session 3 DemoPlan601E Session 3 Demo
Plan601E Session 3 Demo
 
Application Of Geometry In Scientific Computing Using C
Application Of Geometry In Scientific Computing Using CApplication Of Geometry In Scientific Computing Using C
Application Of Geometry In Scientific Computing Using C
 
Autocad project ppt
Autocad project pptAutocad project ppt
Autocad project ppt
 
AutoCad 1.pptx
AutoCad 1.pptxAutoCad 1.pptx
AutoCad 1.pptx
 
Manual autocad 2010 english
Manual autocad 2010 englishManual autocad 2010 english
Manual autocad 2010 english
 
Intro to Adobe Illustrator
Intro to Adobe IllustratorIntro to Adobe Illustrator
Intro to Adobe Illustrator
 

More from rkottam

Plan601 e session 1 demo
Plan601 e session 1 demoPlan601 e session 1 demo
Plan601 e session 1 demo
rkottam
 
Plan601 e session 1 lesson s2017
Plan601 e session 1 lesson s2017Plan601 e session 1 lesson s2017
Plan601 e session 1 lesson s2017
rkottam
 
Session 5 case studies
Session 5 case studiesSession 5 case studies
Session 5 case studies
rkottam
 
Plan601 e session 4 lesson2
Plan601 e session 4 lesson2Plan601 e session 4 lesson2
Plan601 e session 4 lesson2
rkottam
 
Plan601 e session 1 lesson f2016
Plan601 e session 1 lesson f2016Plan601 e session 1 lesson f2016
Plan601 e session 1 lesson f2016
rkottam
 
Plan601 e session 1 lesson f2016
Plan601 e session 1 lesson f2016Plan601 e session 1 lesson f2016
Plan601 e session 1 lesson f2016
rkottam
 
Plan601 e session 1 demo 2016
Plan601 e session 1 demo 2016Plan601 e session 1 demo 2016
Plan601 e session 1 demo 2016
rkottam
 
Plan601 e session 5 lesson
Plan601 e session 5 lessonPlan601 e session 5 lesson
Plan601 e session 5 lesson
rkottam
 
Plan601 e session 4 lesson2
Plan601 e session 4 lesson2Plan601 e session 4 lesson2
Plan601 e session 4 lesson2
rkottam
 
Session 3 lesson
Session 3 lessonSession 3 lesson
Session 3 lesson
rkottam
 
Plan601 e session 2 lesson
Plan601 e session 2 lessonPlan601 e session 2 lesson
Plan601 e session 2 lesson
rkottam
 
Session 2 case studies
Session 2 case studiesSession 2 case studies
Session 2 case studies
rkottam
 
Plan601 e session 1 lesson 20151005
Plan601 e session 1 lesson 20151005Plan601 e session 1 lesson 20151005
Plan601 e session 1 lesson 20151005
rkottam
 
Session 5 case studies
Session 5 case studiesSession 5 case studies
Session 5 case studies
rkottam
 
Plan601 e session 5 presentation alt
Plan601 e session 5 presentation altPlan601 e session 5 presentation alt
Plan601 e session 5 presentation alt
rkottam
 
Session 4 case studies
Session 4 case studiesSession 4 case studies
Session 4 case studies
rkottam
 
Session 3 case studies
Session 3 case studiesSession 3 case studies
Session 3 case studies
rkottam
 
Plan601 e session 2 lesson
Plan601 e session 2 lessonPlan601 e session 2 lesson
Plan601 e session 2 lesson
rkottam
 
Plan601 e session 1 demo 20151005
Plan601 e session 1 demo 20151005Plan601 e session 1 demo 20151005
Plan601 e session 1 demo 20151005
rkottam
 
Plan601 e session 1 lesson 20151005
Plan601 e session 1 lesson 20151005Plan601 e session 1 lesson 20151005
Plan601 e session 1 lesson 20151005
rkottam
 

More from rkottam (20)

Plan601 e session 1 demo
Plan601 e session 1 demoPlan601 e session 1 demo
Plan601 e session 1 demo
 
Plan601 e session 1 lesson s2017
Plan601 e session 1 lesson s2017Plan601 e session 1 lesson s2017
Plan601 e session 1 lesson s2017
 
Session 5 case studies
Session 5 case studiesSession 5 case studies
Session 5 case studies
 
Plan601 e session 4 lesson2
Plan601 e session 4 lesson2Plan601 e session 4 lesson2
Plan601 e session 4 lesson2
 
Plan601 e session 1 lesson f2016
Plan601 e session 1 lesson f2016Plan601 e session 1 lesson f2016
Plan601 e session 1 lesson f2016
 
Plan601 e session 1 lesson f2016
Plan601 e session 1 lesson f2016Plan601 e session 1 lesson f2016
Plan601 e session 1 lesson f2016
 
Plan601 e session 1 demo 2016
Plan601 e session 1 demo 2016Plan601 e session 1 demo 2016
Plan601 e session 1 demo 2016
 
Plan601 e session 5 lesson
Plan601 e session 5 lessonPlan601 e session 5 lesson
Plan601 e session 5 lesson
 
Plan601 e session 4 lesson2
Plan601 e session 4 lesson2Plan601 e session 4 lesson2
Plan601 e session 4 lesson2
 
Session 3 lesson
Session 3 lessonSession 3 lesson
Session 3 lesson
 
Plan601 e session 2 lesson
Plan601 e session 2 lessonPlan601 e session 2 lesson
Plan601 e session 2 lesson
 
Session 2 case studies
Session 2 case studiesSession 2 case studies
Session 2 case studies
 
Plan601 e session 1 lesson 20151005
Plan601 e session 1 lesson 20151005Plan601 e session 1 lesson 20151005
Plan601 e session 1 lesson 20151005
 
Session 5 case studies
Session 5 case studiesSession 5 case studies
Session 5 case studies
 
Plan601 e session 5 presentation alt
Plan601 e session 5 presentation altPlan601 e session 5 presentation alt
Plan601 e session 5 presentation alt
 
Session 4 case studies
Session 4 case studiesSession 4 case studies
Session 4 case studies
 
Session 3 case studies
Session 3 case studiesSession 3 case studies
Session 3 case studies
 
Plan601 e session 2 lesson
Plan601 e session 2 lessonPlan601 e session 2 lesson
Plan601 e session 2 lesson
 
Plan601 e session 1 demo 20151005
Plan601 e session 1 demo 20151005Plan601 e session 1 demo 20151005
Plan601 e session 1 demo 20151005
 
Plan601 e session 1 lesson 20151005
Plan601 e session 1 lesson 20151005Plan601 e session 1 lesson 20151005
Plan601 e session 1 lesson 20151005
 

Recently uploaded

QA or the Highway - Component Testing: Bridging the gap between frontend appl...
QA or the Highway - Component Testing: Bridging the gap between frontend appl...QA or the Highway - Component Testing: Bridging the gap between frontend appl...
QA or the Highway - Component Testing: Bridging the gap between frontend appl...
zjhamm304
 
What is an RPA CoE? Session 2 – CoE Roles
What is an RPA CoE?  Session 2 – CoE RolesWhat is an RPA CoE?  Session 2 – CoE Roles
What is an RPA CoE? Session 2 – CoE Roles
DianaGray10
 
Session 1 - Intro to Robotic Process Automation.pdf
Session 1 - Intro to Robotic Process Automation.pdfSession 1 - Intro to Robotic Process Automation.pdf
Session 1 - Intro to Robotic Process Automation.pdf
UiPathCommunity
 
"$10 thousand per minute of downtime: architecture, queues, streaming and fin...
"$10 thousand per minute of downtime: architecture, queues, streaming and fin..."$10 thousand per minute of downtime: architecture, queues, streaming and fin...
"$10 thousand per minute of downtime: architecture, queues, streaming and fin...
Fwdays
 
LF Energy Webinar: Carbon Data Specifications: Mechanisms to Improve Data Acc...
LF Energy Webinar: Carbon Data Specifications: Mechanisms to Improve Data Acc...LF Energy Webinar: Carbon Data Specifications: Mechanisms to Improve Data Acc...
LF Energy Webinar: Carbon Data Specifications: Mechanisms to Improve Data Acc...
DanBrown980551
 
inQuba Webinar Mastering Customer Journey Management with Dr Graham Hill
inQuba Webinar Mastering Customer Journey Management with Dr Graham HillinQuba Webinar Mastering Customer Journey Management with Dr Graham Hill
inQuba Webinar Mastering Customer Journey Management with Dr Graham Hill
LizaNolte
 
Getting the Most Out of ScyllaDB Monitoring: ShareChat's Tips
Getting the Most Out of ScyllaDB Monitoring: ShareChat's TipsGetting the Most Out of ScyllaDB Monitoring: ShareChat's Tips
Getting the Most Out of ScyllaDB Monitoring: ShareChat's Tips
ScyllaDB
 
"Scaling RAG Applications to serve millions of users", Kevin Goedecke
"Scaling RAG Applications to serve millions of users",  Kevin Goedecke"Scaling RAG Applications to serve millions of users",  Kevin Goedecke
"Scaling RAG Applications to serve millions of users", Kevin Goedecke
Fwdays
 
Apps Break Data
Apps Break DataApps Break Data
Apps Break Data
Ivo Velitchkov
 
Mutation Testing for Task-Oriented Chatbots
Mutation Testing for Task-Oriented ChatbotsMutation Testing for Task-Oriented Chatbots
Mutation Testing for Task-Oriented Chatbots
Pablo Gómez Abajo
 
Day 2 - Intro to UiPath Studio Fundamentals
Day 2 - Intro to UiPath Studio FundamentalsDay 2 - Intro to UiPath Studio Fundamentals
Day 2 - Intro to UiPath Studio Fundamentals
UiPathCommunity
 
Principle of conventional tomography-Bibash Shahi ppt..pptx
Principle of conventional tomography-Bibash Shahi ppt..pptxPrinciple of conventional tomography-Bibash Shahi ppt..pptx
Principle of conventional tomography-Bibash Shahi ppt..pptx
BibashShahi
 
Y-Combinator seed pitch deck template PP
Y-Combinator seed pitch deck template PPY-Combinator seed pitch deck template PP
Y-Combinator seed pitch deck template PP
c5vrf27qcz
 
ScyllaDB Tablets: Rethinking Replication
ScyllaDB Tablets: Rethinking ReplicationScyllaDB Tablets: Rethinking Replication
ScyllaDB Tablets: Rethinking Replication
ScyllaDB
 
Introducing BoxLang : A new JVM language for productivity and modularity!
Introducing BoxLang : A new JVM language for productivity and modularity!Introducing BoxLang : A new JVM language for productivity and modularity!
Introducing BoxLang : A new JVM language for productivity and modularity!
Ortus Solutions, Corp
 
A Deep Dive into ScyllaDB's Architecture
A Deep Dive into ScyllaDB's ArchitectureA Deep Dive into ScyllaDB's Architecture
A Deep Dive into ScyllaDB's Architecture
ScyllaDB
 
"Choosing proper type of scaling", Olena Syrota
"Choosing proper type of scaling", Olena Syrota"Choosing proper type of scaling", Olena Syrota
"Choosing proper type of scaling", Olena Syrota
Fwdays
 
[OReilly Superstream] Occupy the Space: A grassroots guide to engineering (an...
[OReilly Superstream] Occupy the Space: A grassroots guide to engineering (an...[OReilly Superstream] Occupy the Space: A grassroots guide to engineering (an...
[OReilly Superstream] Occupy the Space: A grassroots guide to engineering (an...
Jason Yip
 
Northern Engraving | Modern Metal Trim, Nameplates and Appliance Panels
Northern Engraving | Modern Metal Trim, Nameplates and Appliance PanelsNorthern Engraving | Modern Metal Trim, Nameplates and Appliance Panels
Northern Engraving | Modern Metal Trim, Nameplates and Appliance Panels
Northern Engraving
 
Lee Barnes - Path to Becoming an Effective Test Automation Engineer.pdf
Lee Barnes - Path to Becoming an Effective Test Automation Engineer.pdfLee Barnes - Path to Becoming an Effective Test Automation Engineer.pdf
Lee Barnes - Path to Becoming an Effective Test Automation Engineer.pdf
leebarnesutopia
 

Recently uploaded (20)

QA or the Highway - Component Testing: Bridging the gap between frontend appl...
QA or the Highway - Component Testing: Bridging the gap between frontend appl...QA or the Highway - Component Testing: Bridging the gap between frontend appl...
QA or the Highway - Component Testing: Bridging the gap between frontend appl...
 
What is an RPA CoE? Session 2 – CoE Roles
What is an RPA CoE?  Session 2 – CoE RolesWhat is an RPA CoE?  Session 2 – CoE Roles
What is an RPA CoE? Session 2 – CoE Roles
 
Session 1 - Intro to Robotic Process Automation.pdf
Session 1 - Intro to Robotic Process Automation.pdfSession 1 - Intro to Robotic Process Automation.pdf
Session 1 - Intro to Robotic Process Automation.pdf
 
"$10 thousand per minute of downtime: architecture, queues, streaming and fin...
"$10 thousand per minute of downtime: architecture, queues, streaming and fin..."$10 thousand per minute of downtime: architecture, queues, streaming and fin...
"$10 thousand per minute of downtime: architecture, queues, streaming and fin...
 
LF Energy Webinar: Carbon Data Specifications: Mechanisms to Improve Data Acc...
LF Energy Webinar: Carbon Data Specifications: Mechanisms to Improve Data Acc...LF Energy Webinar: Carbon Data Specifications: Mechanisms to Improve Data Acc...
LF Energy Webinar: Carbon Data Specifications: Mechanisms to Improve Data Acc...
 
inQuba Webinar Mastering Customer Journey Management with Dr Graham Hill
inQuba Webinar Mastering Customer Journey Management with Dr Graham HillinQuba Webinar Mastering Customer Journey Management with Dr Graham Hill
inQuba Webinar Mastering Customer Journey Management with Dr Graham Hill
 
Getting the Most Out of ScyllaDB Monitoring: ShareChat's Tips
Getting the Most Out of ScyllaDB Monitoring: ShareChat's TipsGetting the Most Out of ScyllaDB Monitoring: ShareChat's Tips
Getting the Most Out of ScyllaDB Monitoring: ShareChat's Tips
 
"Scaling RAG Applications to serve millions of users", Kevin Goedecke
"Scaling RAG Applications to serve millions of users",  Kevin Goedecke"Scaling RAG Applications to serve millions of users",  Kevin Goedecke
"Scaling RAG Applications to serve millions of users", Kevin Goedecke
 
Apps Break Data
Apps Break DataApps Break Data
Apps Break Data
 
Mutation Testing for Task-Oriented Chatbots
Mutation Testing for Task-Oriented ChatbotsMutation Testing for Task-Oriented Chatbots
Mutation Testing for Task-Oriented Chatbots
 
Day 2 - Intro to UiPath Studio Fundamentals
Day 2 - Intro to UiPath Studio FundamentalsDay 2 - Intro to UiPath Studio Fundamentals
Day 2 - Intro to UiPath Studio Fundamentals
 
Principle of conventional tomography-Bibash Shahi ppt..pptx
Principle of conventional tomography-Bibash Shahi ppt..pptxPrinciple of conventional tomography-Bibash Shahi ppt..pptx
Principle of conventional tomography-Bibash Shahi ppt..pptx
 
Y-Combinator seed pitch deck template PP
Y-Combinator seed pitch deck template PPY-Combinator seed pitch deck template PP
Y-Combinator seed pitch deck template PP
 
ScyllaDB Tablets: Rethinking Replication
ScyllaDB Tablets: Rethinking ReplicationScyllaDB Tablets: Rethinking Replication
ScyllaDB Tablets: Rethinking Replication
 
Introducing BoxLang : A new JVM language for productivity and modularity!
Introducing BoxLang : A new JVM language for productivity and modularity!Introducing BoxLang : A new JVM language for productivity and modularity!
Introducing BoxLang : A new JVM language for productivity and modularity!
 
A Deep Dive into ScyllaDB's Architecture
A Deep Dive into ScyllaDB's ArchitectureA Deep Dive into ScyllaDB's Architecture
A Deep Dive into ScyllaDB's Architecture
 
"Choosing proper type of scaling", Olena Syrota
"Choosing proper type of scaling", Olena Syrota"Choosing proper type of scaling", Olena Syrota
"Choosing proper type of scaling", Olena Syrota
 
[OReilly Superstream] Occupy the Space: A grassroots guide to engineering (an...
[OReilly Superstream] Occupy the Space: A grassroots guide to engineering (an...[OReilly Superstream] Occupy the Space: A grassroots guide to engineering (an...
[OReilly Superstream] Occupy the Space: A grassroots guide to engineering (an...
 
Northern Engraving | Modern Metal Trim, Nameplates and Appliance Panels
Northern Engraving | Modern Metal Trim, Nameplates and Appliance PanelsNorthern Engraving | Modern Metal Trim, Nameplates and Appliance Panels
Northern Engraving | Modern Metal Trim, Nameplates and Appliance Panels
 
Lee Barnes - Path to Becoming an Effective Test Automation Engineer.pdf
Lee Barnes - Path to Becoming an Effective Test Automation Engineer.pdfLee Barnes - Path to Becoming an Effective Test Automation Engineer.pdf
Lee Barnes - Path to Becoming an Effective Test Automation Engineer.pdf
 

PLAN601E SESSION 2 DEMO

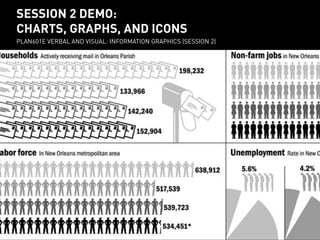
  • 1. SESSION 2 DEMO: session 2 demo: CHARTS, GRAPHS, AND ICONS charts, graphs, and icons PLAN601E VERBAL ANDInformation Graphics (session 2) VISUAL: INFORMATION GRAPHICS (SESSION 2) PLAN601E Verbal and visual:
  • 2. copy exercise files make a local copy of folder: session 2 exercise files
  • 3. charts in adobe illustrator overview of tools and panels creating pie charts and bar charts using excel data
  • 4. introduction to adobe illustrator More detail on Course Blog under ‘Resource Library’
  • 5. menus 1 creating a pie chart with adobe illustrator 1) Create a new document.
  • 6. chart tool creating a pie chart with adobe illustrator 2 2) Use the Chart Tool to make 4” x 4” pie chart.
  • 7. Let’s make two pie charts: one showing proportion of citywide population represented by CD3 and another showing the proportion of CD3 represented by your census tract. MENUS 1 3 pop. data CREATING A PIE CHART WITH ADOBE ILLUSTRATOR Steps: 1) open template. cd3 vs. [city - cd3] creating a pie chart with adobe illustrator tract vs. [cd3 - tract] 2) Paste population data into table.
  • 8. 4 object menu creating a pie chart with adobe illustrator 4) Ungroup each chart three times.
  • 9. 6 5 6 creating a pie chart with adobe illustrator 6) Create a palette. 5) Select part of chart you want to color with select tool; Use eyedropper tool to color the polygon.
  • 10. Let’s use the sort functions in Excel in order to visually organize census data based on our own study area zones. 1 find / replace creating a bar graph with adobe illustrator 1) Clean up data utilizing Find & Replace.
  • 11. Let’s use the sort functions in Excel in order to visually organize census data based on our own study area zones. area a area b area c creating a bar graph with adobe illustrator 2) Insert a column to add a letter code for each census tract’s zone
  • 12. Let’s use the sort functions in Excel in order to visually organize census data based on our own study area zones. 2 creating a bar graph with adobe illustrator 2) Insert a column and add a letter code for each census tract’s zone
  • 13. Use the sort function to organize census data based on the study area zones. sort 3 creating a bar graph with adobe illustrator 3) Sort the data based on the new column.
  • 14. Let’s generate some percentages for households where non-relatives are living. 5 formula 4 5 creating a bar graph with adobe illustrator 4) Hide extraneous columns; add a column; sum family and nonfamily HH with non-relatives; 5) Divide new column by total HH.
  • 15. 6 6 creating a bar graph with adobe illustrator 6) Use Chart Tool to create 6” x 4” bar graph.
  • 16. 7 8 creating a bar graph with adobe illustrator 7) Paste total HH into table; enter a new ‘dummy’ maximum value in the last row; 8) Make a second chart and paste total nonrelatives into table. Add the same ‘dummy’ maximum, for scale.
  • 17. 9 creating a bar graph with adobe illustrator 9 9) Build a color palette. Close table window for bar graph. Ungroup both graphs 3 times; delete all lines and labels from non-relative graph; use eyedropper to color bars with your palette.
  • 18. 10 s creating a bar graph with adobe illustrator 10) Use Align panel to overlay the two sets of bars; use the Direct Selection tool to delete the far-most right bar (our ‘dummy’ bar). Delete the horizontal tick marks along the x-axis.
  • 19. 12 14 13 stroke palette 11 creating a bar graph with adobe illustrator 11) Add color to Total HH bars; 12) Ungroup all bars; use Selection tool to create space between zones; 13) Add labels and use Rotate tool for t; 14) Extend and modify line weights of axes.
  • 20. 15 15 creating a bar graph with adobe illustrator 15) Add labels for percentages. Where text overlaps with axes, delete background lines using Scissors tool.
  • 21. 16 creating a bar graph with adobe illustrator 16) Use ‘Find Font’ to replace fonts with preferred; adjust boxes and positions accordingly.
  • 22. 18 18 17 creating a bar graph with adobe illustrator 17) Add labels for title, units, areas, key. 18) Use rectangle tool to create background shading.
  • 23. creating a bar graph with adobe illustrator 19) Remove any unnecessary lines.
  • 24. Creating an icon in adobe illustrator
  • 25. Let’s first borrow an icon from the Internet and convert a jpeg into vectors we can work with. 1 creating AN ICON with adobe illustrator 1) Download a jpeg of an icon that has clean lines and few colors and File>Place it in illustrator.
  • 26. Let’s first borrow an icon from the Internet and convert a jpeg into vectors we can work with. 3 2 creating AN ICON with adobe illustrator 2) Select Object >Live Trace>Make and Expand to have Illustrator approximate a series of vectors of the jpeg
  • 27. Let’s first borrow an icon from the Internet and convert a jpeg into vectors we can work with. 3 4 creating AN ICON with adobe illustrator 3) Ungroup; Use the Direct Selection Tool to delete extraneous vectors.
  • 28. Let’s first borrow an icon from the Internet and convert a jpeg into vectors we can work with. 4 creating AN ICON with adobe illustrator 4) Edit colors, styles, etc. You can also copy/paste the icon into InDesign.
  • 29. Another approach is to create an icon by tracing over a photograph. 5 creating AN ICON with adobe illustrator 5 5) Place a jpeg of a photo with a clear figure in Illustrator. Lock its layer.
  • 30. Another approach is to create an icon by tracing over a photograph. 6 6 creating AN ICON with adobe illustrator 6) In a new layer, use the pen tool to trace the edges of the figure.
  • 31. Another approach is to create an icon by tracing over a photograph. 7 creating AN ICON with adobe illustrator 7) Trace other important visual features.
  • 32. Another approach is to create an icon by tracing over a photograph. 8 creating AN ICON with adobe illustrator 8) Add lines if needed to describe the figure.
  • 33. Another approach is to create an icon by tracing over a photograph. 9 9 creating AN ICON with adobe illustrator 9) Use direct selection tool and color palette to color the icon.
  • 34. Another approach is to create an icon by tracing over a photograph. 10 10 creating AN ICON with adobe illustrator 10) Use direct selection tool and color palette to color the icon.
  • 35. Another approach is to create an icon by tracing over a photograph. 11 creating AN ICON with adobe illustrator 11) Select any secondary line or shape overlaid on your flat color and use Object>Path>Divide Objects Below to punch through your shapes and create new polygons.
  • 36. A third way to create an icon is to convert typographic icons to vectors. 12 12 creating AN ICON with adobe illustrator 12) Find an icon in a font that you like.
  • 37. A third way to create an icon is to convert typographic icons to vectors. 13 creating AN ICON with adobe illustrator 13) Paste character into a new text box, select box with direct selection tool, and use Type>Create Outlines.
  • 38. A third way to create an icon is to convert typographic icons to vectors. 14 creating AN ICON with adobe illustrator 14) Ungroup the vectors.
  • 39. A third way to create an icon is to convert typographic icons to vectors. 15 creating AN ICON with adobe illustrator 15) Edit colors, styles, etc. You can also copy/paste the icon into InDesign.
  • 40. You can also use icons that are available for download under Creative Commons. creating AN ICON with adobe illustrator www.thenounproject.org www.iconmonstr.com