This document provides instructions for creating different types of charts, graphs and icons using Adobe Illustrator. It demonstrates how to make pie charts and bar charts using Excel data, and provides step-by-step guidance for customizing colors, labels and other design elements. The document also outlines three approaches for creating icons - tracing images, converting typographic icons, and using Creative Commons icons. The overall purpose is to teach information graphics and data visualization techniques.


![2) Paste population data into table.
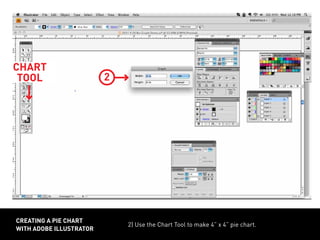
CREATING A PIE CHART
WITH ADOBE ILLUSTRATOR
POP. DATA
3
STUDY AREA vs.
[CITY - STUDY AREA]
STUDY AREA vs.
[STUDY AREA - TRACT]
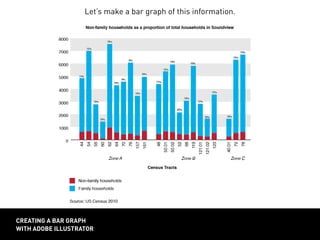
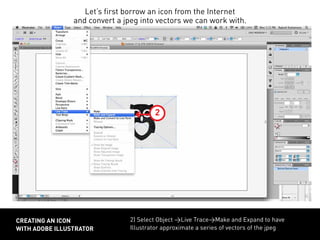
Let’s make two pie charts: one showing proportion of citywide population represented
by the study area and another showing the proportion of the study area represented
by a census tract.](https://image.slidesharecdn.com/plan601esession2demo-170417021559/85/Plan601-e-session-2-demo-7-320.jpg)