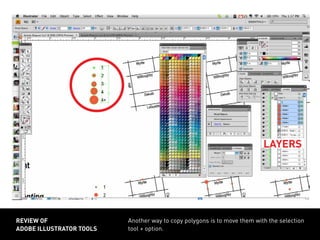
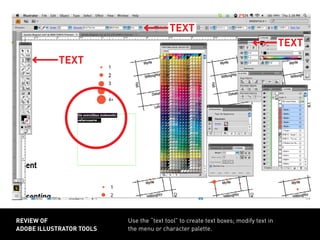
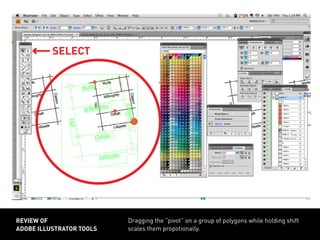
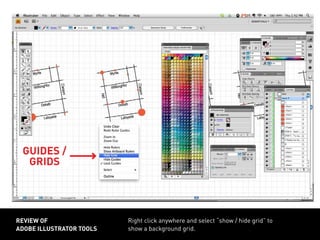
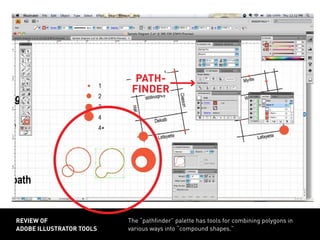
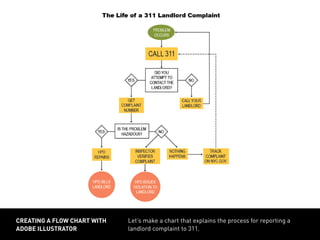
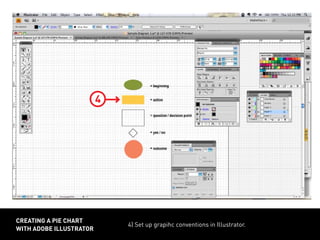
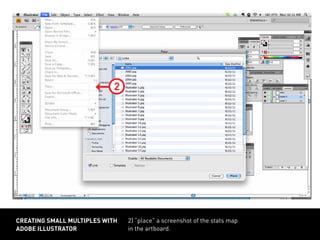
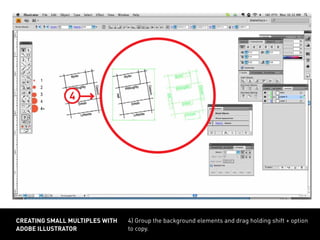
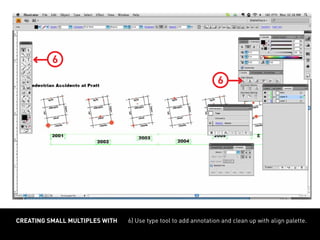
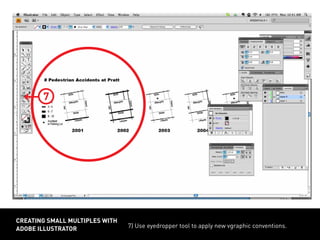
This document provides an overview of tools and techniques for creating flow charts and small multiple diagrams in Adobe Illustrator. It discusses using shape, line, text and alignment tools to construct flow charts showing processes. It also covers copying and adjusting grouped elements, applying graphic conventions through layers and the eyedropper tool to represent changing data values in small multiple diagrams over time. The goal is to practice skills for visually explaining relationships and temporal data.