Download to read offline

![H. R. Ravi, P. Naveen Kumar, S. Chandramma, C. P. Sajan, N. Pavan and H. C.
Devarajegowda
http://www.iaeme.com/IJECET/index.asp 2 editor@iaeme.com
Cite this Article: Ravi, H. R., Kumar, P. N., Chandramma, S., Sajan, C. P.,
Pavan, N. and Devarajegowda, H. C. Synthesis Characterisation and
Application of Novel Composite Mn6+
: ZnO Nanocrystals. International
Journal of Electronics and Communication Engineering & Technology, 6(6),
2015, pp. 01-08.
http://www.iaeme.com/IJECET/issues.asp?JTypeIJECET&VType=6&IType=6
_____________________________________________________________________
1. INTRODUCTION
The properties of ZnO make it an attractive candidate for UV light-emitters, varistors,
transparent high power electronics, surface acoustic wave devices, piezoelectric Trans
ducers, gas sensing, window material for flat panel displays, and more efficient solar
cells [1–12]. Recently, a lot of studies have been concentrated on the degradation of
toxic organic compounds in waste water via photocatalysis of various semiconductors
[13]. Especially, TiO2 with anatase phase has been most widely investigated due to its
photocatalytic activity and chemical stability. However, it is generally known that
TiO2 can barely absorb visible light due to its wide band-gap energy (3.2 eV) and this
is one of the most acceptable serious obstacles associated with its further application
[14]. As a contrast ZnO, a kind of semiconductor that has the similar band gap as
TiO2, is not thoroughly investigated. However, the greatest advantage of ZnO is that it
absorb large fraction of solar spectrum and more light quanta than TiO2 [17].
There is also interest in developing the use of ion implantation of ZnO for device
doping and isolation [8], as well as investigating the effectiveness of different
transition metals for magnetic doping, model by Dietl et al [18, 19]. The Mn–Zn–O
system has attracted much attention because of the controversial magnetic properties
reported, but their basic origins remain unclear. Both the existence and absence of FM
have been reported in Mn-doped ZnO thin films. However, in the present article the
authors report the hydrothermal synthesis of Mn doped ZnO under mild PT condition
and their application in the photocatalytic degradation of textile effluent to know the
photodegradation efficiency of the synthisised compound.
2. MATERIALS AND METHODS
In the synthesis of Mn6+
: ZnO a known amount of commercially available ZnO was
taken in the in a Teflon liner to which MnO3 was doped from 1 to 10 % respectively.
The chemical ingredients were weighed in stoichiometric proportions and a required
amount of suitable mineralizer (double distilled water) was added into this teflon liner
maintaining 40% of % fill. The teflon liner was then placed inside the autoclave. The
autoclave was then placed inside the oven and the temperature of the oven was set to
150°C for 40 hrs. After the experimental run, the autoclave was quenched and the
sample was taken out. The sample inside the liner was separated from the solution and
washed with the double distilled water, and then ultrasonicated. The product extracted
was centrifuged to remove undesired components and dried at a temperature of 35–
40°C in a dust free environment.
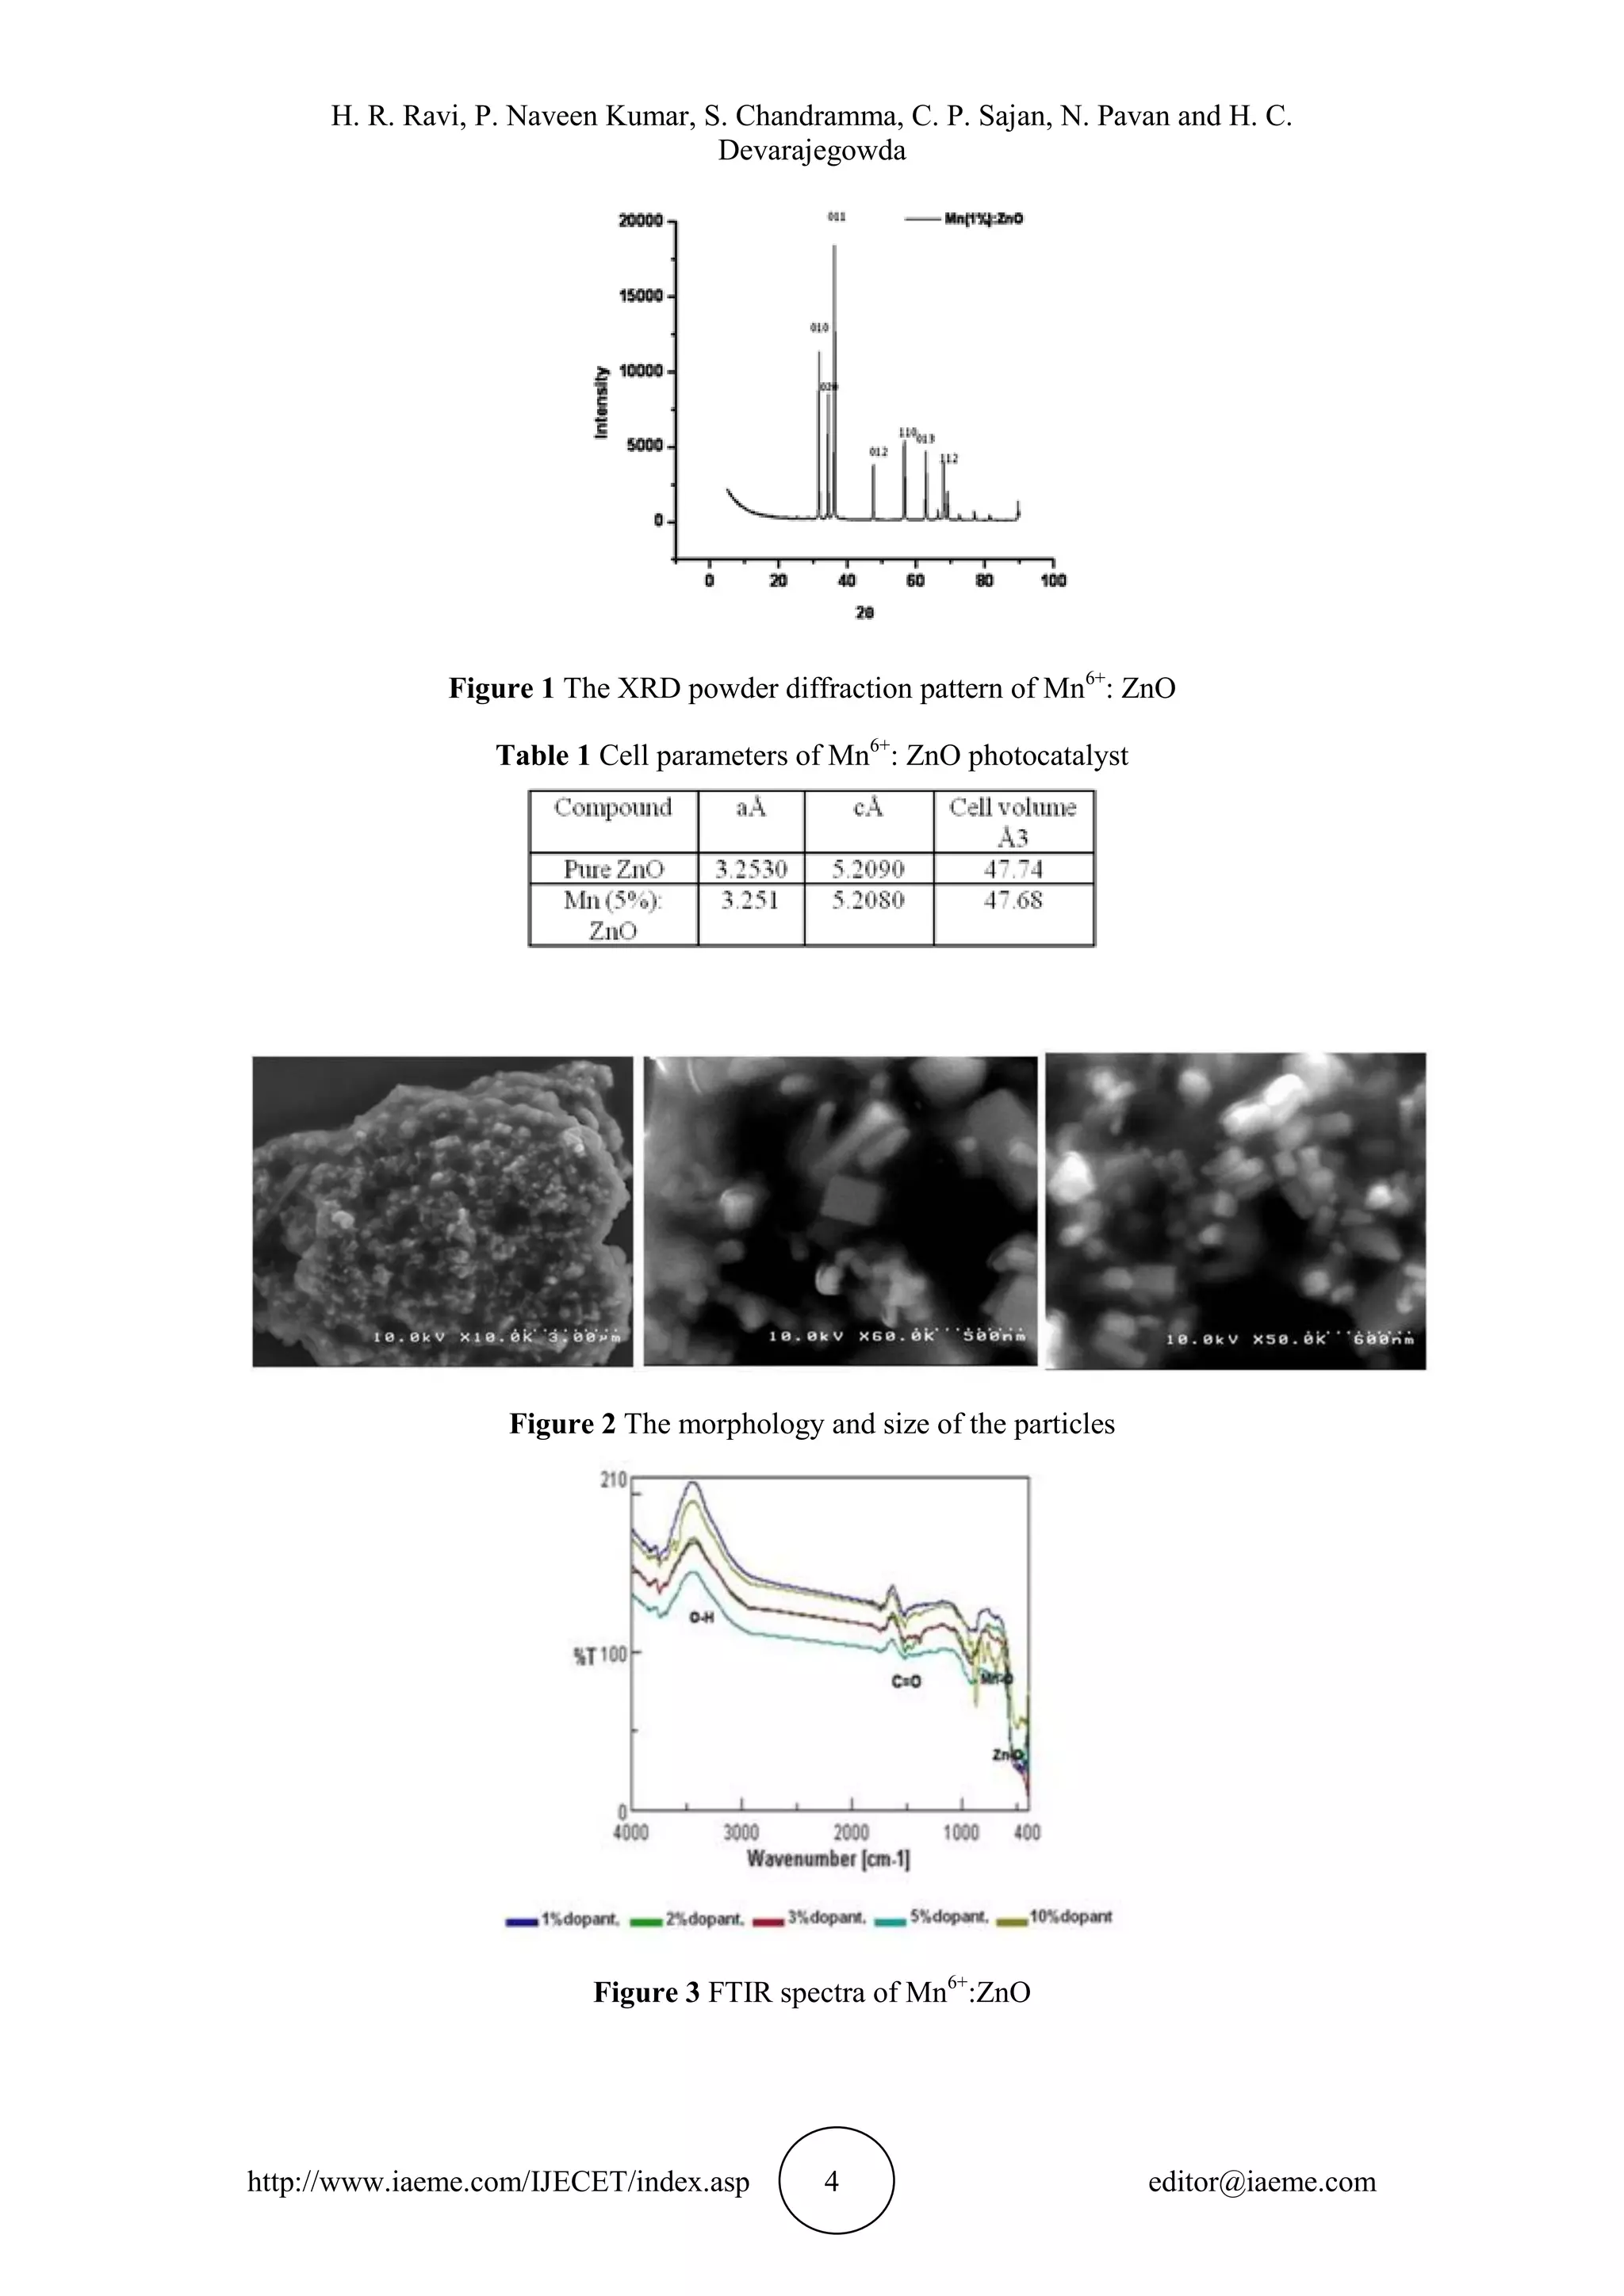
The synthesized Mn6+
: ZnO was characterised using a high resolution SEM. The
XRD pattern was obtained using MXP3, MAC Science Co., Ltd, Tokyo, Japan, with
Cu Kα radiation (wavelength =0.154 nm). The scanning range was 10–80 °C (2θ).
The crystallinity [15, 16] of the compound was identified by comparison with JCPDS
files (PCPDF WIN-2.01). The FTIR result was obtained using JASCO-460 Plus,
Japan. The DLS study was carried out in order to know the population of the crystal](https://image.slidesharecdn.com/ijecet0606001-150820075128-lva1-app6892/75/Ijecet-06-06_001-2-2048.jpg)


![Synthesis Characterisation and Application of Novel Composite Mn6+
: ZnO Nanocrystals
http://www.iaeme.com/IJECET/index.asp 7 editor@iaeme.com
Table 2 Effect of Photocatalytic degradation efficiency (ŋ) and Decolorization (%T) on
Textile effluent under UV using Mn6+
: ZnO
Time in
Hrs
10 mg 20 mg 30 mg
COD ŋ %T COD ŋ %T COD ŋ %T
1 248 3.125 45.2 240 6.25 47.1 232 9.37 49.2
2 232 9.375 49.1 216 15.62 51.3 200 21.87 56.8
3 200 21.87 56.8 184 28.12 60.4 160 37.5 62.3
4 176 31.25 58.5 128 50 71.6 112 56.25 75.8
5 144 43.75 67.3 88 65.6 84 64 75.0 87
Table 3 Effect of Photocatalytic degradation efficiency (ŋ) and Decolorization (%T) on
Textile effluent under sunlight using Mn6+
:ZnO.
Time in
Hrs
10 mg 20 mg 30 mg
COD ŋ %T COD ŋ %T COD ŋ %T
1 232 9.37 49.2 216 15.62 51 208 18.75 53.1
2 216 15.62 51.4 184 28.125 55.4 168 34.37 61.4
3 168 34.37 61.4 136 46.875 69.3 120 53.12 72.5
4 128 50.00 71.2 96 62.25 84.4 72 71.87 84.5
5 88 65.62 85.2 56 78.12 89.7 32 87.5 94.4
4. CONCLUSION
The synthesis of Mn6+
: ZnO was achieved under mild hydrothermal conditions. The
crystallinity, crystal structure and surface morphology were revealed by XRD, SEM
and FTIR. The XRD result of the synthesized compound reveals that the doping of
manganese has decreased the cell volume of the ZnO particles. The DLS study gives
the population density of the synthesized compound, the results of the DLS clearly
reveals that among the crystals synthesized 70 % of the crystals are in the range of
8.229.85 nm size. The decrease in crystal size increases the surface area thereby
enhancing the photodegradation efficiency of the compound. The photo-catalytic
degradation of textile effluent using the prepared composite materials is an efficient
and environmentally benign technique, because it facilitates the complete
mineralization of the complex organics into simpler non-toxic products. The study of
various kinetic parameters like initial concentration of the organics, catalyst amount,
%T and COD test has helped in finding out the optimum reaction conditions.
Moreover the use of sunlight as the source of illumination in the photodegradation
reaction could be a safe and highly cost effective source. The textile effluent was
treated successfully using the prepared compound. The decrease in the COD values
from 256 to 64 demonstrated the destruction of the organics present in the effluent
and increase in the % transmittance. COD reduces and degradation efficiency
increases as the time increases. The proposed degradation mechanisms showed that
the final products of the degradation are less toxic and environmental friendly.
REFERENCE
[1] Hayashi, H., Ishizaka, A., Haemori, M. and Koinuma, H. Appl. Phys. Lett. 82,
2003, pp. 1365.
[2] Sharma, P., Sreenivas, K. and Rao, K. V. J. Appl. Phys. 93, 2003, pp. 3963.](https://image.slidesharecdn.com/ijecet0606001-150820075128-lva1-app6892/75/Ijecet-06-06_001-7-2048.jpg)
![H. R. Ravi, P. Naveen Kumar, S. Chandramma, C. P. Sajan, N. Pavan and H. C.
Devarajegowda
http://www.iaeme.com/IJECET/index.asp 8 editor@iaeme.com
[3] Horwitz, J. S., Kim, W. H., Makinen, A. J., Kafafi, Z. H. and Chrisey, D. B. Thin
Solid Films, 420–421, 2002, pp. 539.
[4] Look, D. C., Mater. Sci. Eng., B 80, 2001, pp. 383.
[5] Wraback, M., Shen, H., Liang, S., Gorla, C. R. and Lu, Y. Appl. Phys. Lett. 74,
1999, pp. 507.
[6] Look, D. C., Hemsky, J. W. and Sizelove, J. R. Phys. Rev. Lett. 82, 1999, pp.
2552.
[7] Auret, F. D., Goodman, S. A., Hayes, M., Legodi, M. J., van Laar-hoven, H. A.
and Look, D. C. Appl. Phys. Lett., 80, 2002, pp. 956.
[8] Kucheyev, S. O., Bradley, J. E., Williams, J. S., Jagerdish, C. and Swain, M. V.
Appl. Phys. Lett., 80, 2002, pp. 956.
[9] Wraback, M., Shen, H., Liang, S., Gorla, C. R. and Lu, Y. Appl. Phys. Lett. 76,
1999, pp. 507.
[10] Aoki, T., Look, D. C. and Hatanaka, Y. Appl. Phys. Lett. 76, 2000, pp. 3257.
[11] Gorla, C. R., Emanetoglu, N. W., Liang, S., Mayo, W. E., Lu, Y., Wra-back, M.
and Shen, H. J. Appl. Phys., 85, 1999, pp. 2595.
[12] Krishnamoorthy, S., Iliadis, A. A., Inumpudi, A., Choopun, S., Vispute, R. D. and
Venkatesan, T. Solid-State Electron, 46, 2002, pp. 1631.
[13] Mrowetz, M. and Selli, E. J. Photoch. Photobio., A 180, 2006, pp. 15.
[14] Sakthivel, S., Janczarek, M., Kisch, H. J. Phys. Chem., B 108, 2004, pp. 19384.
[15] Sharma, P. and Gupta, N. Nanocrystalline Silicon Thin Film Transistor (NC-SI:H
TFTS)-A Device For Display Panels. International journal of Electronics and
Communication Engineering &Technology (IJECET), 4(7), 2013, pp. 115–127.
[16] Dixit, S. and Manohar, R. Gamma Radiation-Induced Transformational Change
In Ir Spectrum of EBHA Nematic Liquid Crystal. International Journal of
Advanced Research in Engineering & Technology (IJARET), 6(3), 2015, pp. 1–6.
[17] Sakthivel, S., Neppolian, B., Shankar, M. V., Arabindoo, B., Palanichamy, M.
and Murugesan, V. Sol. Energy Mater. Sol. C 77, 2003, pp. 65–82.
[18] Dietl, T., Ohno, H., Matsukura, F., Cibert, J. and Ferrand, D. Science, 287, 2000,
pp. 1019.
[19] Dietl, T. Semicond. Sci. Technol. 17, 2002, pp. 377.](https://image.slidesharecdn.com/ijecet0606001-150820075128-lva1-app6892/75/Ijecet-06-06_001-8-2048.jpg)

The document summarizes the synthesis, characterization, and application of novel Mn6+ doped ZnO nanocrystals as photocatalysts. Key findings include: 1) Mn6+:ZnO nanocrystals were synthesized via a hydrothermal method and characterized using XRD, SEM, FTIR and DLS. XRD showed the crystals had a hexagonal structure and FTIR confirmed the presence of Mn and Zn-O bonds. 2) The nanocrystals effectively degraded textile effluent under solar and UV light, with 30 mg of catalyst achieving 87.5% degradation within 5 hours as measured by COD reduction and increased light transmission. 3)


![Seller Deck - Presentation [Concert L2].PPTX](https://cdn.slidesharecdn.com/ss_thumbnails/sellerdeck-presentationconcertl2-251219171156-24982daf-thumbnail.jpg?width=640&height=640&fit=bounds)


