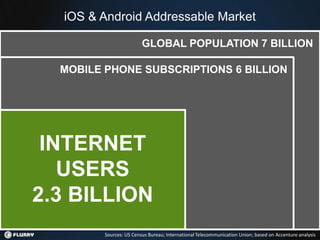
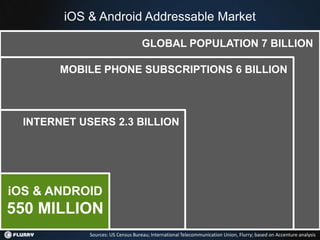
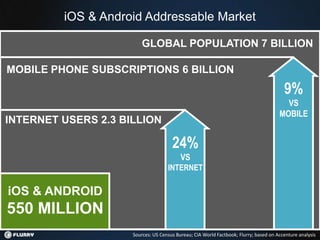
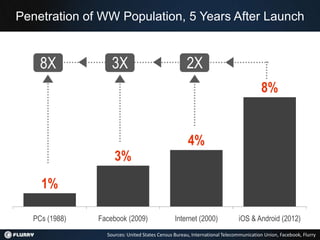
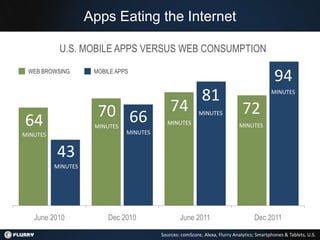
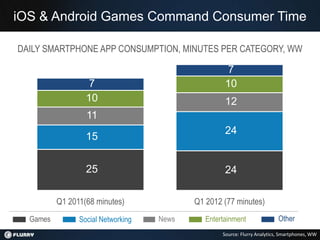
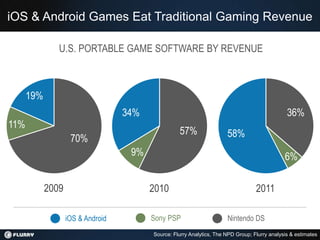
Keep Your IP. Hold on to Your Hat.


Peter Farago                @FlurryMobile
VP Marketing               GAP@flurry.com
App Measurement & Advertising Platform

Flurry Analytics
Better apps on iOS, Android, BB, WP, HTML5
 App Developers:                  70,000
 Live Applications:              190,000
 Devices per month:                540M
 Sessions per month:                 38B
 Events per month:                  400B

AppCircle Ad Network
Acquisition & Monetization: iOS, Android
 App Developers:                   6,200
 Devices per month:                250M
 Daily Completed Views                3M
“Software is Eating the World” Andreessen in WSJ
iOS & Android Addressable Market


  GLOBAL
POPULATION
 7 BILLION
                  Sources: United States Census Bureau, based on Accenture analysis
iOS & Android Addressable Market

                        GLOBAL POPULATION 7 BILLION


MOBILE PHONE
SUBSCRIPTIONS
  6 BILLION
        Sources: US Census Bureau; International Telecommunication Union; based on Accenture analysis
iOS & Android Addressable Market

                         GLOBAL POPULATION 7 BILLION

  MOBILE PHONE SUBSCRIPTIONS 6 BILLION


 INTERNET
   USERS
2.3 BILLION
         Sources: US Census Bureau; International Telecommunication Union; based on Accenture analysis
iOS & Android Addressable Market

                                    GLOBAL POPULATION 7 BILLION

        MOBILE PHONE SUBSCRIPTIONS 6 BILLION


  INTERNET USERS 2.3 BILLION


iOS & ANDROID
550 MILLION
             Sources: US Census Bureau; International Telecommunication Union, Flurry; based on Accenture analysis
iOS & Android Addressable Market

                         GLOBAL POPULATION 7 BILLION

MOBILE PHONE SUBSCRIPTIONS 6 BILLION
                                                                                        9%
                                                                                        VS
                                                                                      MOBILE
INTERNET USERS 2.3 BILLION

                                      24%
                                          VS
                                    INTERNET

iOS & ANDROID
550 MILLION
                     Sources: US Census Bureau; CIA World Factbook; Flurry; based on Accenture analysis
Penetration of WW Population, 5 Years After Launch


     8X             3X                               2X
                                                                                      8%


                                                      4%
                     3%
     1%

   PCs (1988)   Facebook (2009)                 Internet (2000)             iOS & Android (2012)
                  Sources: United States Census Bureau, International Telecommunication Union, Facebook, Flurry
Apps Eating the Internet

           U.S. MOBILE APPS VERSUS WEB CONSUMPTION

 WEB BROWSING        MOBILE APPS
                                                                                             94
                                                           81                              MINUTES


                      70 66                  74           MINUTES             72
64                   MINUTES
                               MINUTES
                                           MINUTES                          MINUTES
MINUTES


          43
          MINUTES


   June 2010             Dec 2010                June 2011                         Dec 2011

                                         Sources: comScore, Alexa, Flurry Analytics; Smartphones & Tablets, U.S.
iOS & Android Games Command Consumer Time

DAILY SMARTPHONE APP CONSUMPTION, MINUTES PER CATEGORY, WW

                                                     7
                   7                                10
                  10                                12
                  11
                                                    24
                  15


                  25                                24

          Q1 2011(68 minutes)              Q1 2012 (77 minutes)
  Games         Social Networking   News      Entertainment                Other
                                                   Source: Flurry Analytics, Smartphones, WW
iOS & Android Games Eat Traditional Gaming Revenue

               U.S. PORTABLE GAME SOFTWARE BY REVENUE


      19%
                                   34%                                                          36%
11%
                                                   57%                 58%
                    70%
                                    9%                                                         6%

            2009                         2010                                      2011

                   iOS & Android         Sony PSP                      Nintendo DS
                                         Source: Flurry Analytics, The NPD Group; Flurry analysis & estimates
Indies Dominate on iOS & Android

  INDIE VS. ESTABLISHED GAME SESSIONS ON iOS & ANDROID, WW


               40%                                                         32%
                                             44%
60%                         56%
                                                         68%


   Q1 2010                         Q1 2011                      Q1 2012

 Independent iOS & Android Game Developers     Game Companies from other Platforms
                                                                     Source: Flurry Analytics
Business Model: App Store Top 25 Grossing
  UNITED KINGDOM             FRANCE                     GERMANY
                                4%
           16%
                                                                   24%


    84%                     96%                      76%


   UNITED STATES              CHINA                        TOTAL

           8%                     12%                           13%


     92%                    88%                       87%


            IN APP PURCHASE PRICING     PREMIUM PRICING
                                          Source: iTunes App Store, May 2012, Flurry analysis
Apps vs. Games: App Store Top 25 Grossing
  UNITED KINGDOM           FRANCE                       GERMANY


            28%                                     40%
                                    36%
                     64%                                            60%
   72%


   UNITED STATES           CHINA                           TOTAL

          12%                 12%
                                                                     30%

                                                    70%
    88%               88%


                   GAMES        APPLICATIONS
                                          Source: iTunes App Store, May 2012, Flurry analysis
Gen Y Pays

                  TIME SPENT BY DEMOGRAPHIC
18%
                                            Males (53%)   Females (47%)
16%
                  17%           17%
14%                     15%
12%
                                      12%
10%         11%
      11%
8%

6%
                                              7% 7%
4%

2%                                                           2% 1%
0%
      13 – 17      18 – 24       25 – 34        35 – 54          55+
Gen X Pays

      MOBILE FREE-TO-PLAY GAMES: MONEY SPENT BY DEMOGRAPHIC

30%
                               29%         Males (58%)   Females (42%)
25%


20%
                                     20%
15%
                                             16%
10%
                                                   12%
                 9%
5%    3% 2%            7%
                                                            1% 1%
0%
      13 – 17     18 – 24       25 – 34        35 – 54         55+
                                                              Source: Flurry Analytics
Women Thrifty. Men Binge.
      MOBILE FREE-TO-PLAY GAMES: TRANSACTION SIZE BY DEMOGRAPHIC

$16
                                          $16.4
                          $15.5
        Males ($15.6)
$14                                                       $15.2           $14.8
        Females ($11.9)

$12
                                  $12.0           $12.0           $12.5
      $11.8
$10
                                                                                  $10.4
$8
              $8.2
$6

$4

$2

$0
        13 – 17             18 – 24         25 – 34         35 – 54          55+
                                                                            Source: Flurry Analytics
Sessions per Category, Smartphones vs. Tablets

                            Smartphones                                          Tablets


          Games                           50%              Games                                       58%

Social Networking                22%            Social Networking               14%

   Entertainment       6%                          Entertainment              11%

         Lifestyle    5%                                   Utilities      3%

          Utilities   4%                                     News        2%

           News       2%                                    Books        2%

            Other          11%                               Other           10%


                                                 Source: Flurry Analytics, Q1 2012; 160,500 apps, 97 Billion Sessions
Engagement Comparison, Smartphones vs. Tablets


                                        Source: Flurry Analytics
Time of Day Usage, Smartphones vs. Tablets


                                      Source: Flurry Analytics
Gender by Category, Smartphones vs. Tablets


                                       Source: Flurry Analytics
Age Distribution, Smartphones vs. Tablets

Average Age
Smartphones:                                        41%
                 27
Tablets:         38


           21%            20%                 22%
                                    20%
                                                                    17%
 13%                                                          14%
                  9%
                                                                             3%


     13 - 17          18 - 24             25 - 34     35 - 54          55+

                            Smartphones             Tablets

                                                                     Source: Flurry Analytics
Top 6 Successful Game Types


ENDLESS PASS TIME   NURTURING & COLLECTING   BUILDING & SIMULATION


   SOCIAL RPG           GAMER’S GAME            POKER / CASINO
Endless Pass Time
                    Examples                                      Age Distribution
                                                  30%
                                                  25%
                                                  20%
                                                  15%
                                                  10%
                                                   5%

      Angry Birds            Fruit Ninja           0%
                                                         13-17    18-24   25-34   35-54     55+


            Key Genre Attributes
•   Intuitive, simple puzzle/arcade mechanics
                                                                 58%                   42%
•   Leverages h/w (touch, accelerometer)
                                                DAU                               1,000,000
•   Cute, often original IP; mass-mkt appeal
                                                Monthly Revenue                      $500,000
•   Infinite replay value; lots of power-ups
                                                Investment (minor)                   $100,000
•   May have social leaderboards
                                                Investment (major)                   $400,000
Nurturing & Collecting
                   Examples                                       Age Distribution
                                                  35%
                                                  30%
                                                  25%
                                                  20%
                                                  15%
                                                  10%
                                                   5%
      Dragonvale          Dream Pethouse           0%
                                                         13-17    18-24   25-34   35-54        55+


            Key Genre Attributes
•   Nurturing (tamagotchi) gameplay
                                                                 41%                   59%
•   Avatar / dress-up style content
                                                DAU                                  300,000
•   Endless variety of virtual goods
                                                Monthly Revenue                      $900,000
•   Strong social / show-your-friends sharing
                                                Investment (minor)                   $100,000
•   Often w/ underlying econ sim mechanics
                                                Investment (major)                   $400,000
Building & Simulation
                  Examples                                      Age Distribution
                                                40%
                                                35%
                                                30%
                                                25%
                                                20%
                                                15%
                                                10%
                                                 5%
    Smurfs’ Village     Kingdoms of Camelot      0%
                                                       13-17    18-24   25-34   35-54        55+


            Key Genre Attributes
•   Building & simulation gameplay
                                                               49%                   51%
•   “Empire” expansion / leveling up
                                              DAU                                  400,000
•   Content / power-up unlocks
                                              Monthly Revenue                   $1,200,000
•   Has both virtual currency & goods
                                              Investment (minor)                   $100,000
•   Light social collaboration & sharing
                                              Investment (major)                   $500,000
Social RPG
                   Examples                                    Age Distribution
                                               40%
                                               35%
                                               30%
                                               25%
                                               20%
                                               15%
                                               10%
                                                5%
      Crime City         Original Gangstaz      0%
                                                      13-17    18-24   25-34   35-54        55+


           Key Genre Attributes
•   Text-based RPG mechanic
                                                              79%                   21%
•   Player-vs-player gameplay
                                             DAU                                  150,000
•   Energy / HP depletion
                                             Monthly Revenue                      $600,000
•   Clan / team dimension + message / chat
                                             Investment (minor)                   $100,000
•   Mission-based & level progression
                                             Investment (major)                   $400,000
Gamer’s Game
                   Examples                                       Age Distribution
                                                  50%

                                                  40%

                                                  30%

                                                  20%

                                                  10%

    Infinity Blade II       Real Racing 2          0%
                                                         13-17    18-24   25-34   35-54        55+


            Key Genre Attributes
•   Platform-leading graphics
                                                                 91%                    9%
•   Strong physics engine / middle-ware
                                                DAU                                   50,000
•   Sports / battle / racing style sub-genres
                                                Monthly Revenue                      $400,000
•   Defined win-lose outcomes
                                                Investment (minor)                   $100,000
•   Premium pricing model, often $4.99+
                                                Investment (major)                   $400,000
Texas Poker / Casino
                    Examples                                     Age Distribution
                                                 40%
                                                 35%
                                                 30%
                                                 25%
                                                 20%
                                                 15%
                                                 10%
                                                  5%
      Zynga Poker          Card Ace: Casino       0%
                                                        13-17    18-24   25-34   35-54        55+


           Key Genre Attributes
•   Synchronous, Online Multi-player
                                                                68%                   32%
•   Private + public tables, chat enabled
                                               DAU                                  200,000
•   Texas Poker dominates, inherently social
                                               Monthly Revenue                   $1,000,000
•   Blend of competition + social
                                               Investment (minor)                   $100,000
•   Acquiring chips = perfect freemium model
                                               Investment (major)                   $400,000
Flurry Services


    Analytics: Increase Your App Engagement and Retention
1   •   Free and powerful. Leading app analytics (iOS, Android, WP, BB, J2ME, HTML5)
    •   Understand and segment app audiences to maximize engagement and revenue


    AppCircle: Build & Grow Your App Audience
2   • Acquire users with high-quality app recommendations and videos (iOS, Android)
    • Win-back your best users to build the most loyal and best monetizing audience


    AppSpot: Maximize Your App Audience Revenue
3   •   2X revenue, reduce cost with free ad serving and mediation, yield-optimized ads
    •   Max eCPMs with mediation and yield optimization leveraging Flurry’s big data set
    •   Max eCPMs selling direct, segmented parts of your audience to top advertisers
Thank You!


Peter Farago                 @FlurryMobile
VP Marketing                GAP@flurry.com

Peter Farago

  • 1.
    Keep Your IP.Hold on to Your Hat. Peter Farago @FlurryMobile VP Marketing GAP@flurry.com
  • 2.
    App Measurement &Advertising Platform Flurry Analytics Better apps on iOS, Android, BB, WP, HTML5 App Developers: 70,000 Live Applications: 190,000 Devices per month: 540M Sessions per month: 38B Events per month: 400B AppCircle Ad Network Acquisition & Monetization: iOS, Android App Developers: 6,200 Devices per month: 250M Daily Completed Views 3M
  • 3.
    “Software is Eatingthe World” Andreessen in WSJ
  • 4.
    iOS & AndroidAddressable Market GLOBAL POPULATION 7 BILLION Sources: United States Census Bureau, based on Accenture analysis
  • 5.
    iOS & AndroidAddressable Market GLOBAL POPULATION 7 BILLION MOBILE PHONE SUBSCRIPTIONS 6 BILLION Sources: US Census Bureau; International Telecommunication Union; based on Accenture analysis
  • 6.
    iOS & AndroidAddressable Market GLOBAL POPULATION 7 BILLION MOBILE PHONE SUBSCRIPTIONS 6 BILLION INTERNET USERS 2.3 BILLION Sources: US Census Bureau; International Telecommunication Union; based on Accenture analysis
  • 7.
    iOS & AndroidAddressable Market GLOBAL POPULATION 7 BILLION MOBILE PHONE SUBSCRIPTIONS 6 BILLION INTERNET USERS 2.3 BILLION iOS & ANDROID 550 MILLION Sources: US Census Bureau; International Telecommunication Union, Flurry; based on Accenture analysis
  • 8.
    iOS & AndroidAddressable Market GLOBAL POPULATION 7 BILLION MOBILE PHONE SUBSCRIPTIONS 6 BILLION 9% VS MOBILE INTERNET USERS 2.3 BILLION 24% VS INTERNET iOS & ANDROID 550 MILLION Sources: US Census Bureau; CIA World Factbook; Flurry; based on Accenture analysis
  • 9.
    Penetration of WWPopulation, 5 Years After Launch 8X 3X 2X 8% 4% 3% 1% PCs (1988) Facebook (2009) Internet (2000) iOS & Android (2012) Sources: United States Census Bureau, International Telecommunication Union, Facebook, Flurry
  • 10.
    Apps Eating theInternet U.S. MOBILE APPS VERSUS WEB CONSUMPTION WEB BROWSING MOBILE APPS 94 81 MINUTES 70 66 74 MINUTES 72 64 MINUTES MINUTES MINUTES MINUTES MINUTES 43 MINUTES June 2010 Dec 2010 June 2011 Dec 2011 Sources: comScore, Alexa, Flurry Analytics; Smartphones & Tablets, U.S.
  • 11.
    iOS & AndroidGames Command Consumer Time DAILY SMARTPHONE APP CONSUMPTION, MINUTES PER CATEGORY, WW 7 7 10 10 12 11 24 15 25 24 Q1 2011(68 minutes) Q1 2012 (77 minutes) Games Social Networking News Entertainment Other Source: Flurry Analytics, Smartphones, WW
  • 12.
    iOS & AndroidGames Eat Traditional Gaming Revenue U.S. PORTABLE GAME SOFTWARE BY REVENUE 19% 34% 36% 11% 57% 58% 70% 9% 6% 2009 2010 2011 iOS & Android Sony PSP Nintendo DS Source: Flurry Analytics, The NPD Group; Flurry analysis & estimates
  • 13.
    Indies Dominate oniOS & Android INDIE VS. ESTABLISHED GAME SESSIONS ON iOS & ANDROID, WW 40% 32% 44% 60% 56% 68% Q1 2010 Q1 2011 Q1 2012 Independent iOS & Android Game Developers Game Companies from other Platforms Source: Flurry Analytics
  • 14.
    Business Model: AppStore Top 25 Grossing UNITED KINGDOM FRANCE GERMANY 4% 16% 24% 84% 96% 76% UNITED STATES CHINA TOTAL 8% 12% 13% 92% 88% 87% IN APP PURCHASE PRICING PREMIUM PRICING Source: iTunes App Store, May 2012, Flurry analysis
  • 15.
    Apps vs. Games:App Store Top 25 Grossing UNITED KINGDOM FRANCE GERMANY 28% 40% 36% 64% 60% 72% UNITED STATES CHINA TOTAL 12% 12% 30% 70% 88% 88% GAMES APPLICATIONS Source: iTunes App Store, May 2012, Flurry analysis
  • 16.
    Gen Y Pays TIME SPENT BY DEMOGRAPHIC 18% Males (53%) Females (47%) 16% 17% 17% 14% 15% 12% 12% 10% 11% 11% 8% 6% 7% 7% 4% 2% 2% 1% 0% 13 – 17 18 – 24 25 – 34 35 – 54 55+
  • 17.
    Gen X Pays MOBILE FREE-TO-PLAY GAMES: MONEY SPENT BY DEMOGRAPHIC 30% 29% Males (58%) Females (42%) 25% 20% 20% 15% 16% 10% 12% 9% 5% 3% 2% 7% 1% 1% 0% 13 – 17 18 – 24 25 – 34 35 – 54 55+ Source: Flurry Analytics
  • 18.
    Women Thrifty. MenBinge. MOBILE FREE-TO-PLAY GAMES: TRANSACTION SIZE BY DEMOGRAPHIC $16 $16.4 $15.5 Males ($15.6) $14 $15.2 $14.8 Females ($11.9) $12 $12.0 $12.0 $12.5 $11.8 $10 $10.4 $8 $8.2 $6 $4 $2 $0 13 – 17 18 – 24 25 – 34 35 – 54 55+ Source: Flurry Analytics
  • 19.
    Sessions per Category,Smartphones vs. Tablets Smartphones Tablets Games 50% Games 58% Social Networking 22% Social Networking 14% Entertainment 6% Entertainment 11% Lifestyle 5% Utilities 3% Utilities 4% News 2% News 2% Books 2% Other 11% Other 10% Source: Flurry Analytics, Q1 2012; 160,500 apps, 97 Billion Sessions
  • 20.
    Engagement Comparison, Smartphonesvs. Tablets Source: Flurry Analytics
  • 21.
    Time of DayUsage, Smartphones vs. Tablets Source: Flurry Analytics
  • 22.
    Gender by Category,Smartphones vs. Tablets Source: Flurry Analytics
  • 23.
    Age Distribution, Smartphonesvs. Tablets Average Age Smartphones: 41% 27 Tablets: 38 21% 20% 22% 20% 17% 13% 14% 9% 3% 13 - 17 18 - 24 25 - 34 35 - 54 55+ Smartphones Tablets Source: Flurry Analytics
  • 24.
    Top 6 SuccessfulGame Types ENDLESS PASS TIME NURTURING & COLLECTING BUILDING & SIMULATION SOCIAL RPG GAMER’S GAME POKER / CASINO
  • 25.
    Endless Pass Time Examples Age Distribution 30% 25% 20% 15% 10% 5% Angry Birds Fruit Ninja 0% 13-17 18-24 25-34 35-54 55+ Key Genre Attributes • Intuitive, simple puzzle/arcade mechanics 58% 42% • Leverages h/w (touch, accelerometer) DAU 1,000,000 • Cute, often original IP; mass-mkt appeal Monthly Revenue $500,000 • Infinite replay value; lots of power-ups Investment (minor) $100,000 • May have social leaderboards Investment (major) $400,000
  • 26.
    Nurturing & Collecting Examples Age Distribution 35% 30% 25% 20% 15% 10% 5% Dragonvale Dream Pethouse 0% 13-17 18-24 25-34 35-54 55+ Key Genre Attributes • Nurturing (tamagotchi) gameplay 41% 59% • Avatar / dress-up style content DAU 300,000 • Endless variety of virtual goods Monthly Revenue $900,000 • Strong social / show-your-friends sharing Investment (minor) $100,000 • Often w/ underlying econ sim mechanics Investment (major) $400,000
  • 27.
    Building & Simulation Examples Age Distribution 40% 35% 30% 25% 20% 15% 10% 5% Smurfs’ Village Kingdoms of Camelot 0% 13-17 18-24 25-34 35-54 55+ Key Genre Attributes • Building & simulation gameplay 49% 51% • “Empire” expansion / leveling up DAU 400,000 • Content / power-up unlocks Monthly Revenue $1,200,000 • Has both virtual currency & goods Investment (minor) $100,000 • Light social collaboration & sharing Investment (major) $500,000
  • 28.
    Social RPG Examples Age Distribution 40% 35% 30% 25% 20% 15% 10% 5% Crime City Original Gangstaz 0% 13-17 18-24 25-34 35-54 55+ Key Genre Attributes • Text-based RPG mechanic 79% 21% • Player-vs-player gameplay DAU 150,000 • Energy / HP depletion Monthly Revenue $600,000 • Clan / team dimension + message / chat Investment (minor) $100,000 • Mission-based & level progression Investment (major) $400,000
  • 29.
    Gamer’s Game Examples Age Distribution 50% 40% 30% 20% 10% Infinity Blade II Real Racing 2 0% 13-17 18-24 25-34 35-54 55+ Key Genre Attributes • Platform-leading graphics 91% 9% • Strong physics engine / middle-ware DAU 50,000 • Sports / battle / racing style sub-genres Monthly Revenue $400,000 • Defined win-lose outcomes Investment (minor) $100,000 • Premium pricing model, often $4.99+ Investment (major) $400,000
  • 30.
    Texas Poker /Casino Examples Age Distribution 40% 35% 30% 25% 20% 15% 10% 5% Zynga Poker Card Ace: Casino 0% 13-17 18-24 25-34 35-54 55+ Key Genre Attributes • Synchronous, Online Multi-player 68% 32% • Private + public tables, chat enabled DAU 200,000 • Texas Poker dominates, inherently social Monthly Revenue $1,000,000 • Blend of competition + social Investment (minor) $100,000 • Acquiring chips = perfect freemium model Investment (major) $400,000
  • 31.
    Flurry Services Analytics: Increase Your App Engagement and Retention 1 • Free and powerful. Leading app analytics (iOS, Android, WP, BB, J2ME, HTML5) • Understand and segment app audiences to maximize engagement and revenue AppCircle: Build & Grow Your App Audience 2 • Acquire users with high-quality app recommendations and videos (iOS, Android) • Win-back your best users to build the most loyal and best monetizing audience AppSpot: Maximize Your App Audience Revenue 3 • 2X revenue, reduce cost with free ad serving and mediation, yield-optimized ads • Max eCPMs with mediation and yield optimization leveraging Flurry’s big data set • Max eCPMs selling direct, segmented parts of your audience to top advertisers
  • 32.
    Thank You! Peter Farago @FlurryMobile VP Marketing GAP@flurry.com

Editor's Notes

  • #4 Andreessen wrote that every sector is being disrupted by software.But the truth is that APPS are eating software. They are the deliver mechanism of software today, and growing faster than anything any of us have ever seen.Read and reference the WSJ article, “Why Software is Eating the World” by Marc Andreessen, August 11, 2011.
  • #8 VS. TAM, iOS & Android only ¼ PENETRATED. LOTS OF GROWTH LEFT.TOTAL ADDRESSABLE MARKET OF AFFLUENT ADULTS (TAM)ADULT = 15 – 64 YEAR OLDS (INTERNATIONAL MONETARY FUND)AFFLUENT = MIDDLE-CLASS AND ABOVE
  • #9 VS. TAM, iOS & Android only ¼ PENETRATED. LOTS OF GROWTH LEFT.TOTAL ADDRESSABLE MARKET OF AFFLUENT ADULTS (TAM)ADULT = 15 – 64 YEAR OLDS (INTERNATIONAL MONETARY FUND)AFFLUENT = MIDDLE-CLASS AND ABOVE
  • #11 Jan 2012 – 36hrs online according to comscore. Europe: Feb 2012 – 28.2hrs online according to comscore.
  • #12 … but they are challenged for the first time by other categories. With more competition for the consumer’s time, games companies must work harder and smarter to retain and monetize the users they do acquire.
  • #13 Games are a disruptive force in the total gaming category, decimating the portable (aka handheld) category, traditionally dominated by Nintendo and Sony.
  • #18 Men lead women in spending, with the greatest difference occurring in the 25 – 34 year old age group.  For freemium games, spending is concentrated between the ages of 25 - 54, with men in this age range representing nearly half (45%) of spending and women representing another third (32%).