Download as PDF, PPTX


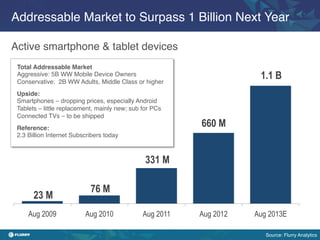
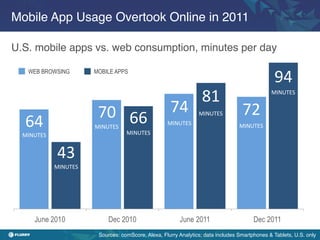
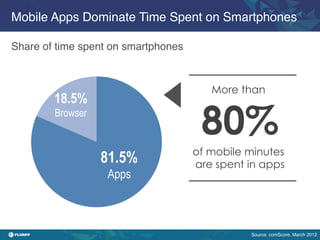

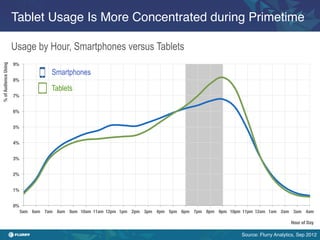
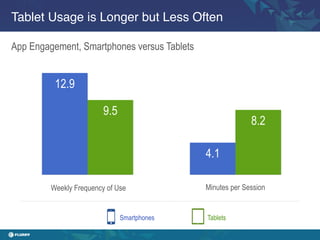
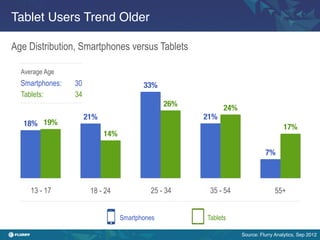
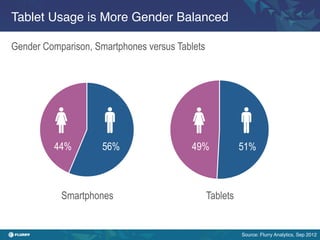
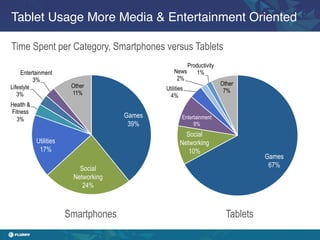
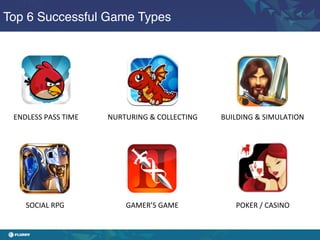


This document discusses the growth of the mobile games market and analyzes usage trends across smartphones, tablets, and platforms. Some key points: - The mobile games market is growing rapidly, surpassing 1 billion users next year, and apps are disrupting industries globally. Tablet usage is more concentrated during primetime and older users. - The top successful game types are endless pass time, social RPGs, and "gamer's games" featuring high-end graphics. Flurry Services help developers increase engagement, acquire users, and maximize monetization. - Tablet usage is longer per session but less frequent than smartphones. Entertainment dominates tablet time spent versus a mix of categories on smartphones.


![Getting Started with Apache Spark: Big Data Made Simple [Free Meetup]](https://cdn.slidesharecdn.com/ss_thumbnails/apachesparkgettingstarted-260203175547-8361bcc3-thumbnail.jpg?width=640&height=640&fit=bounds)


