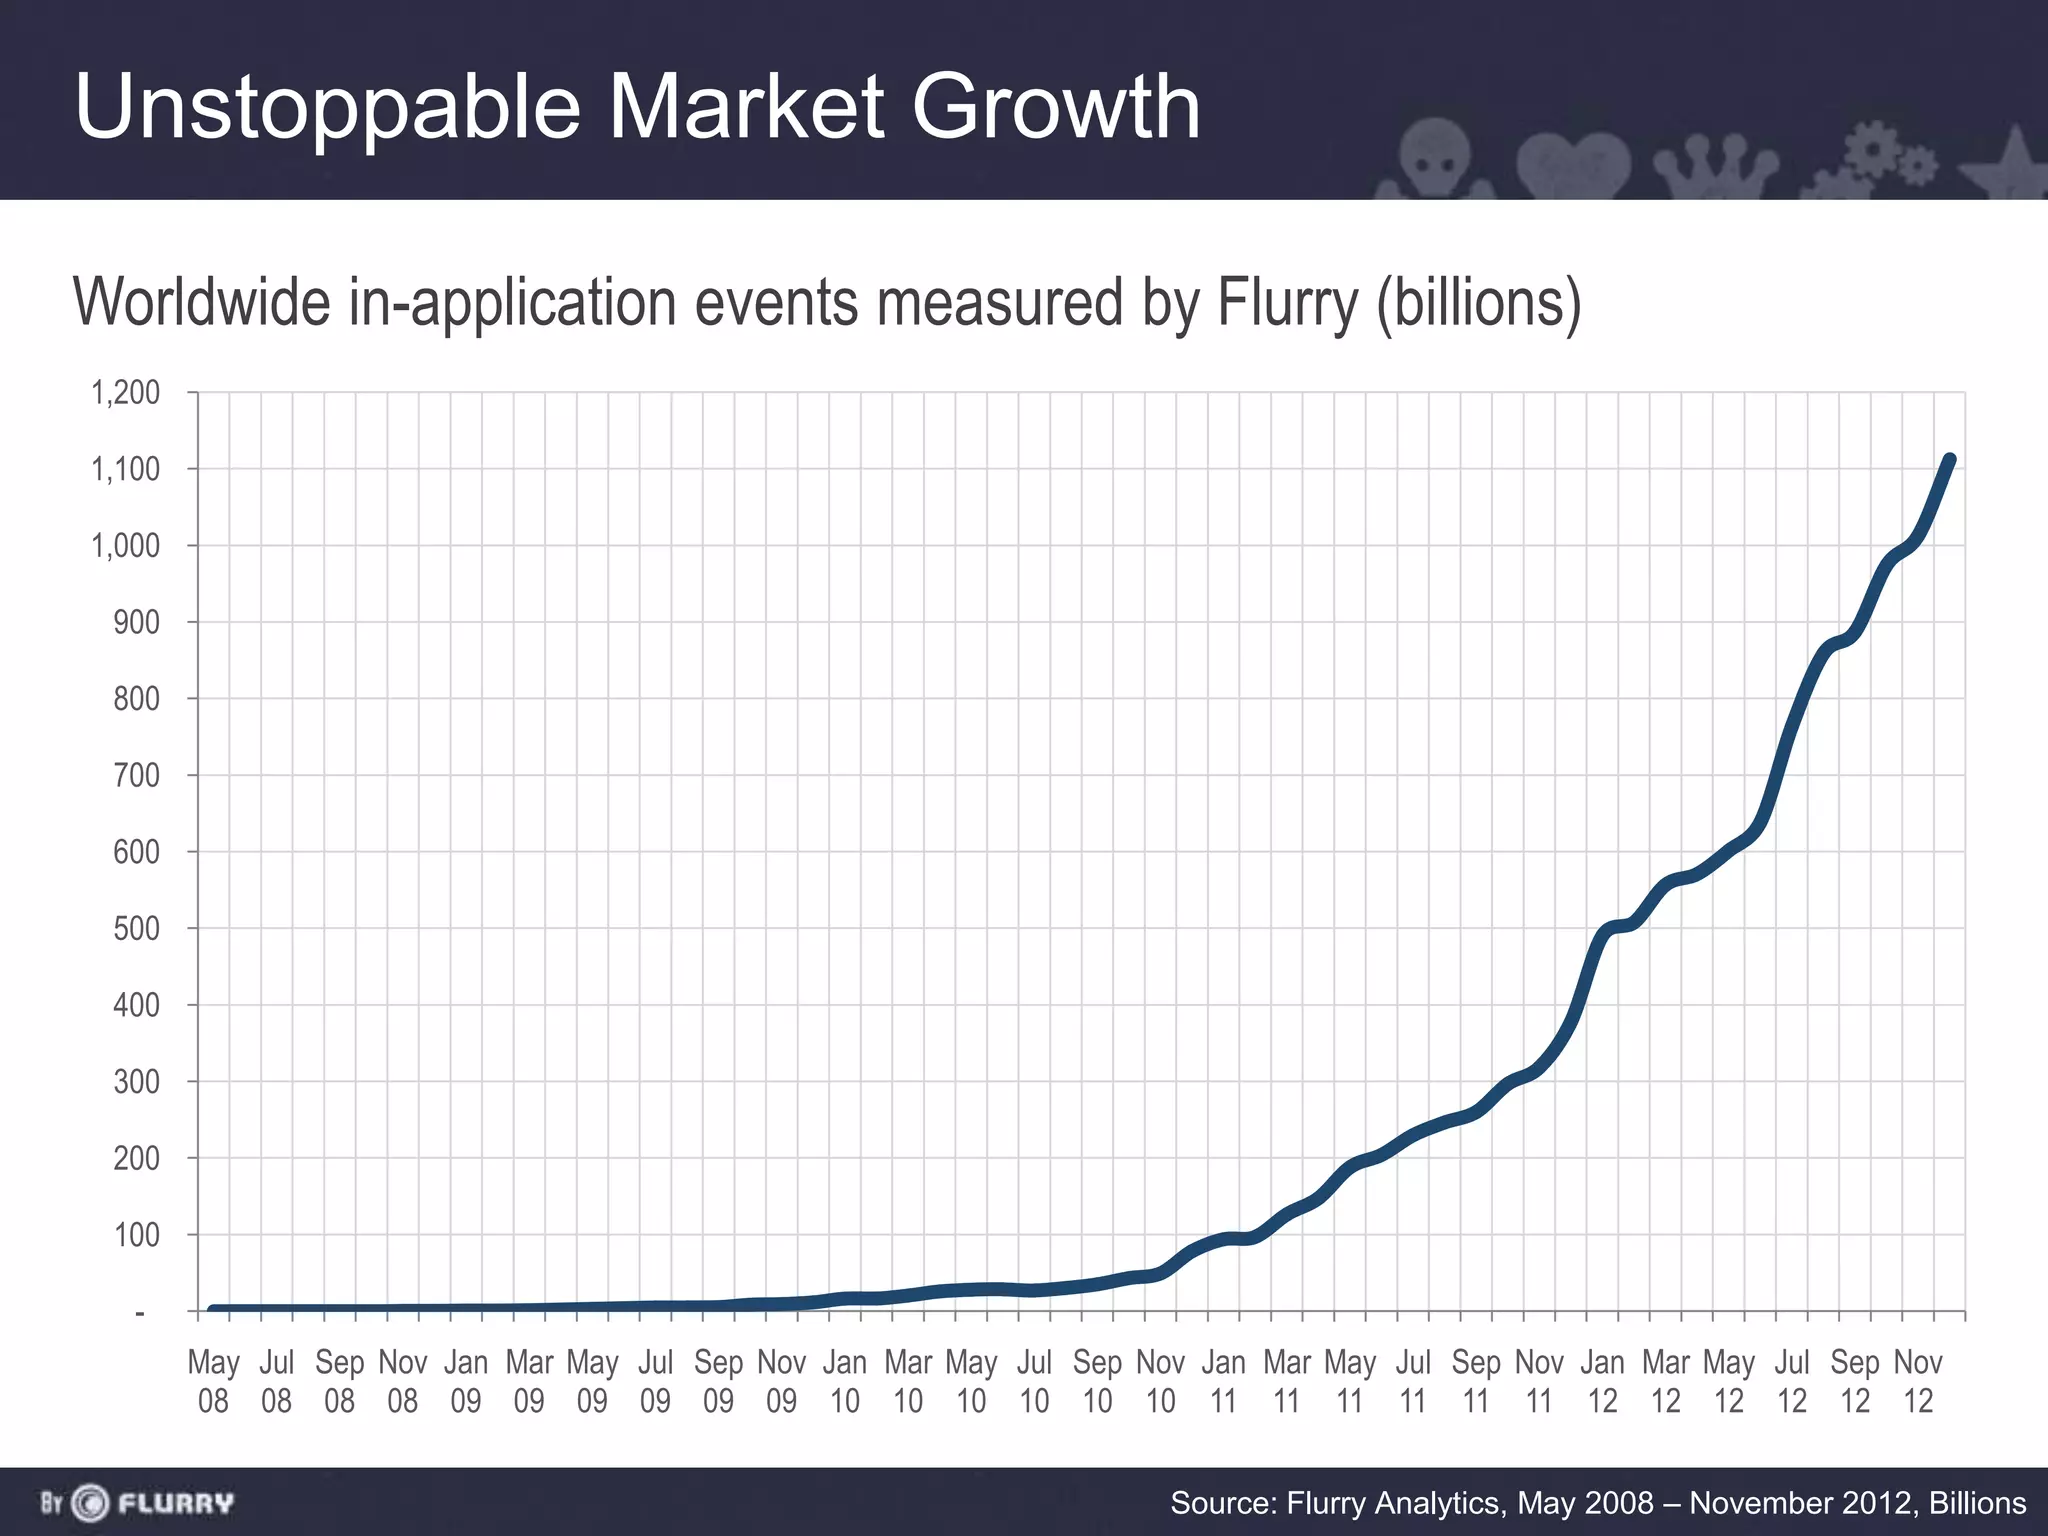
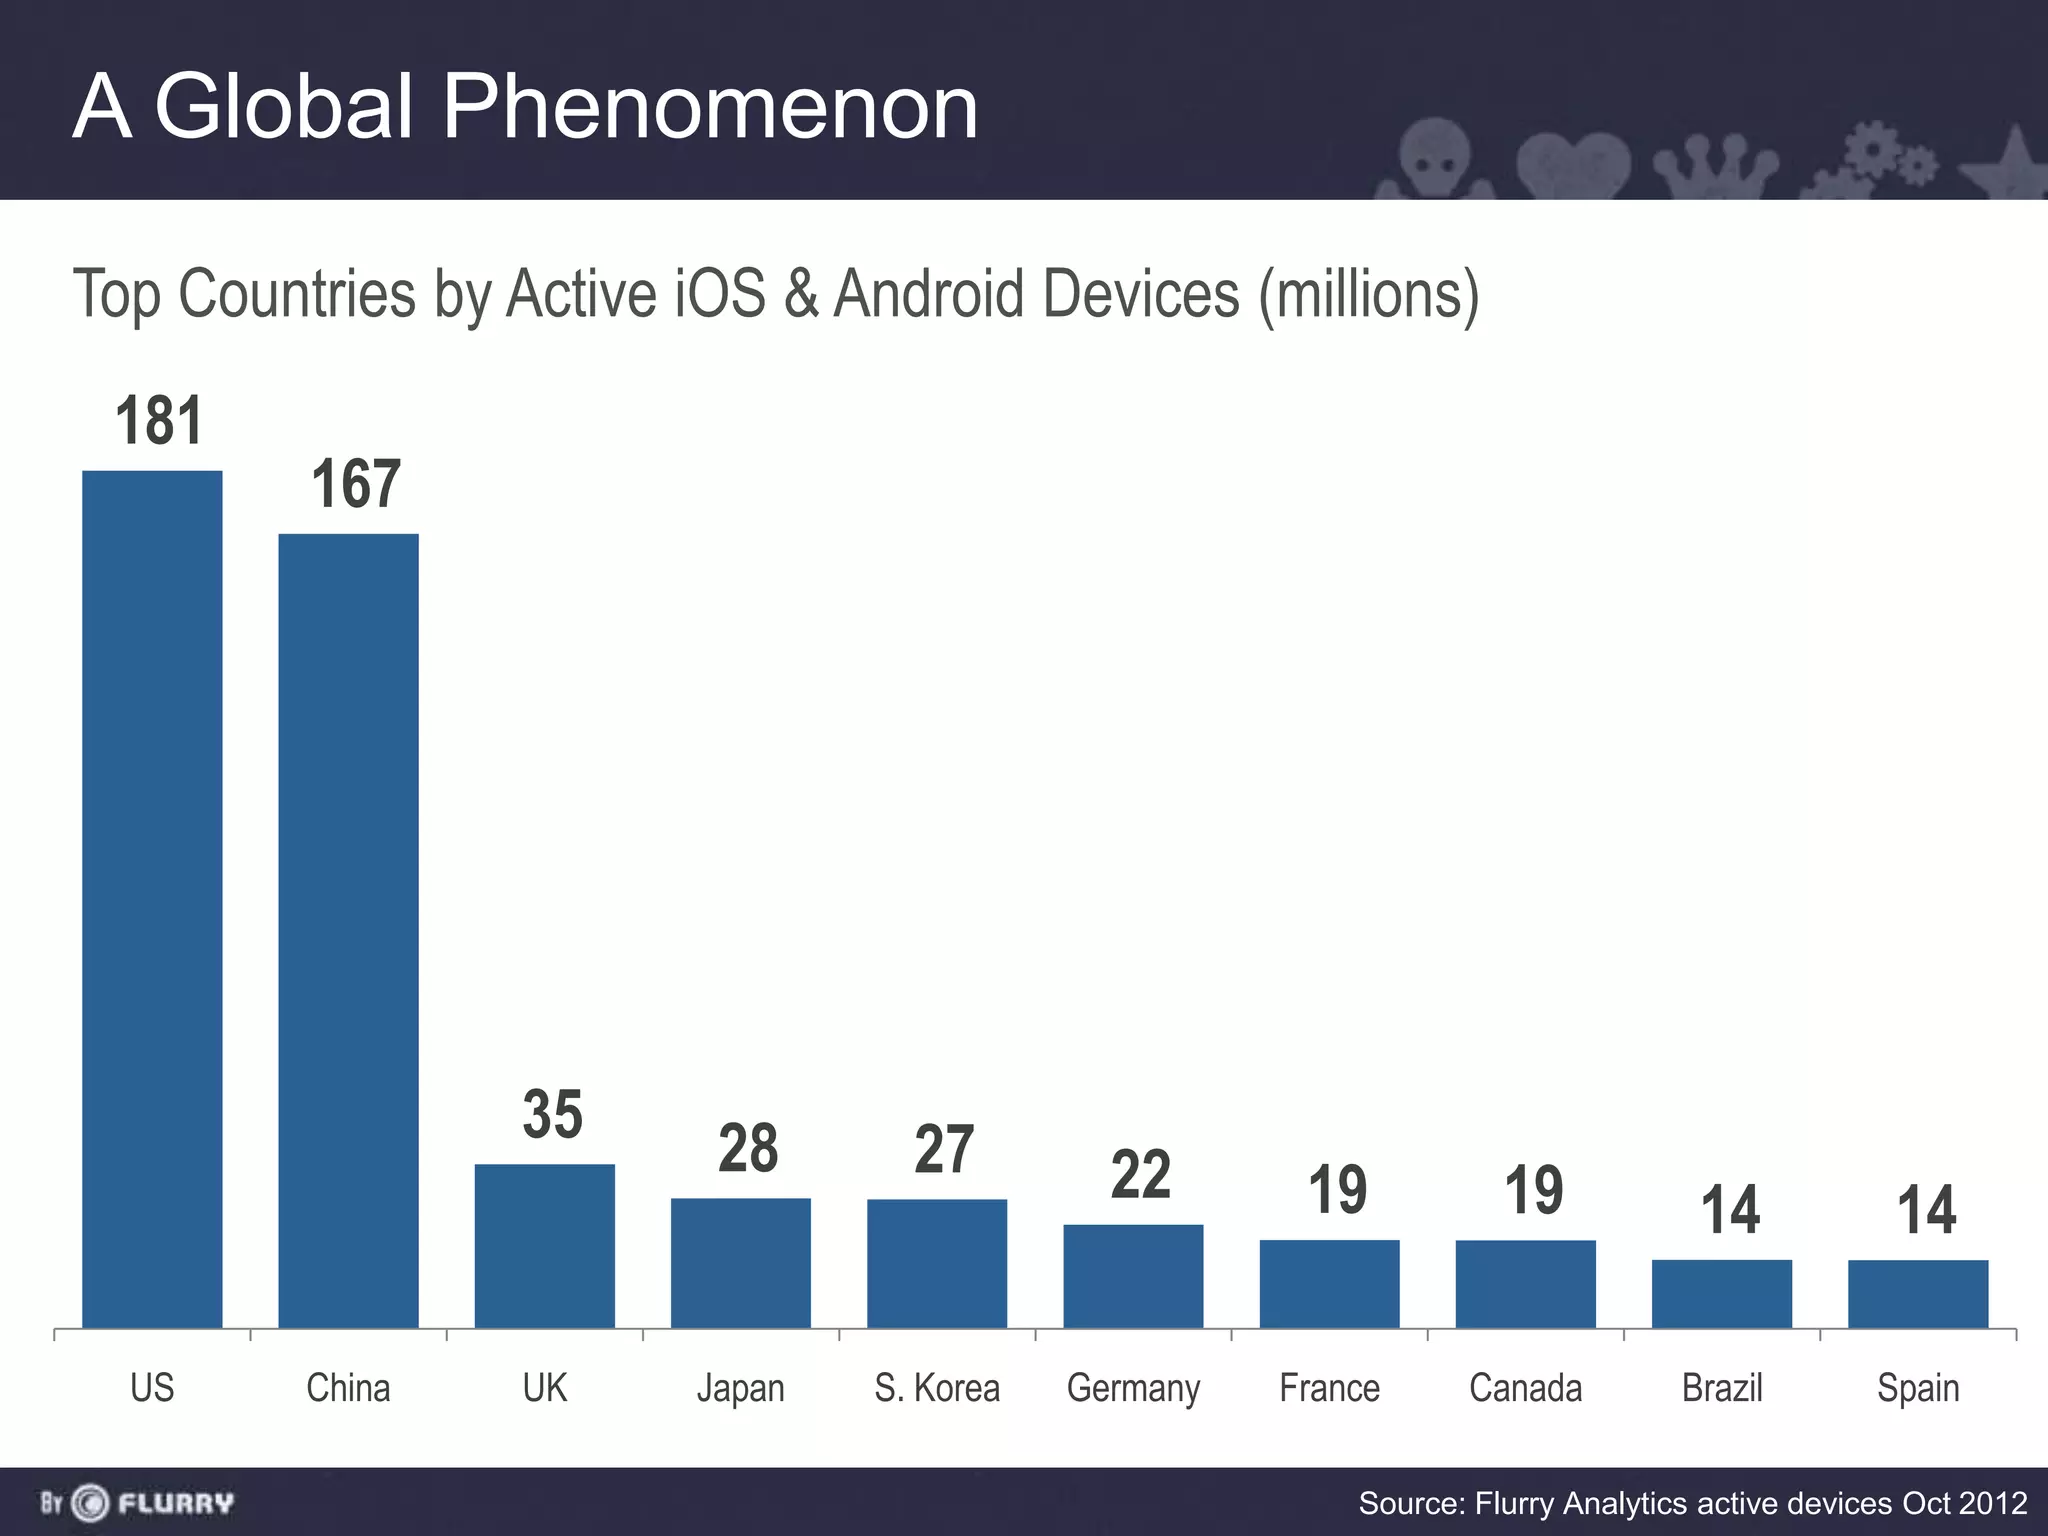
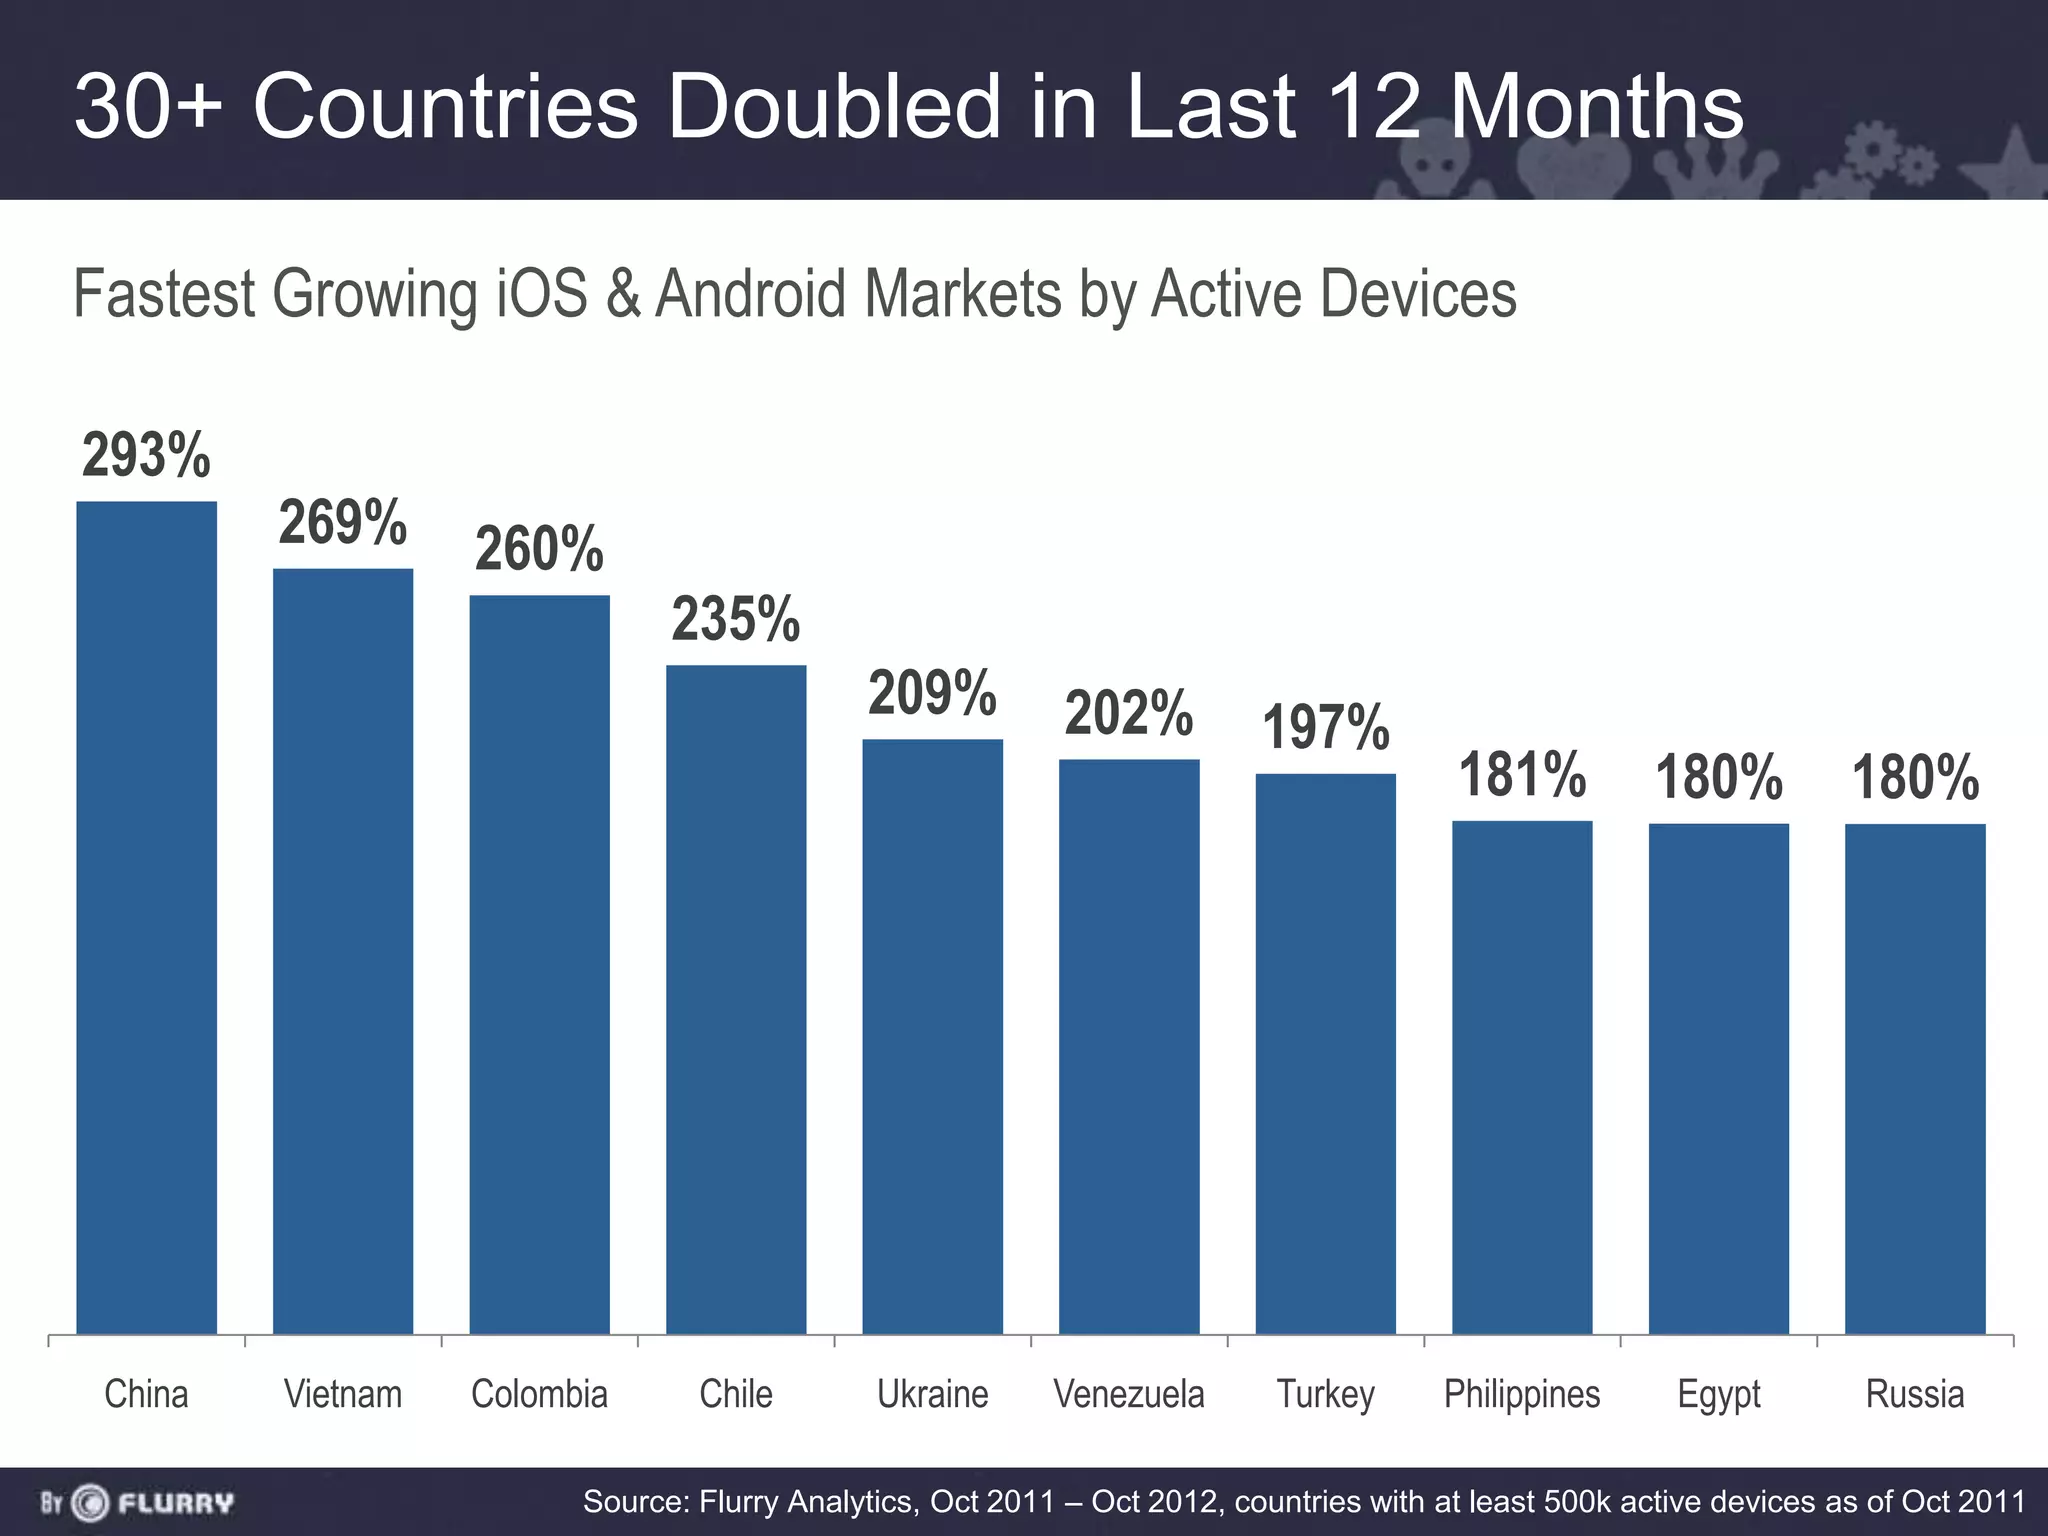
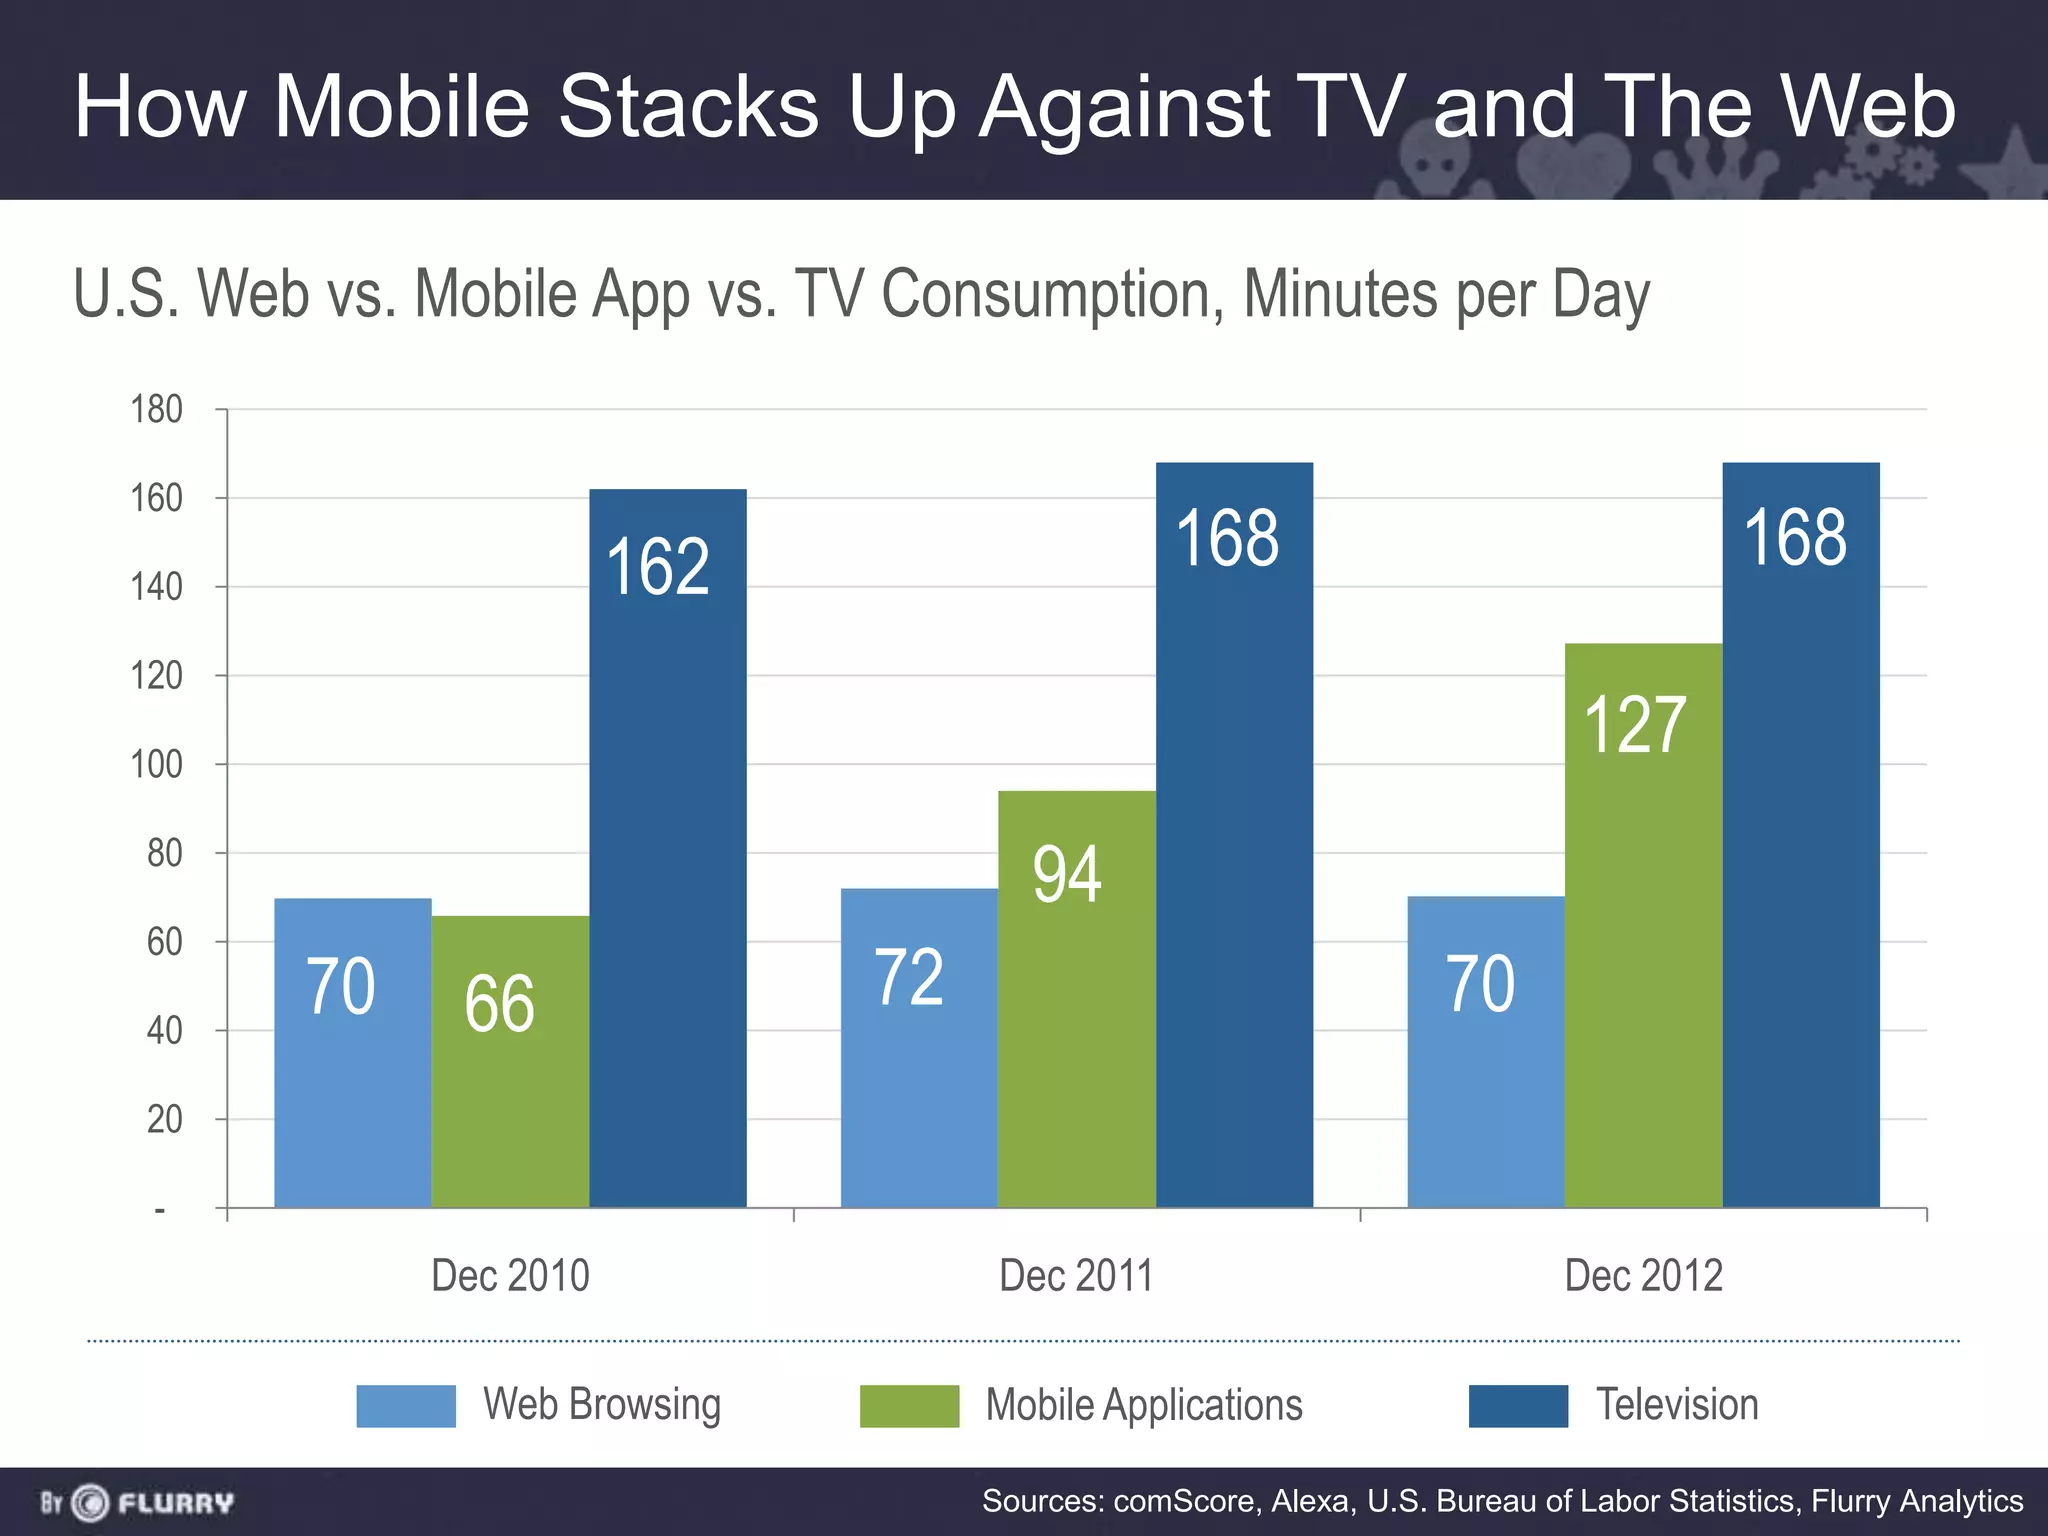
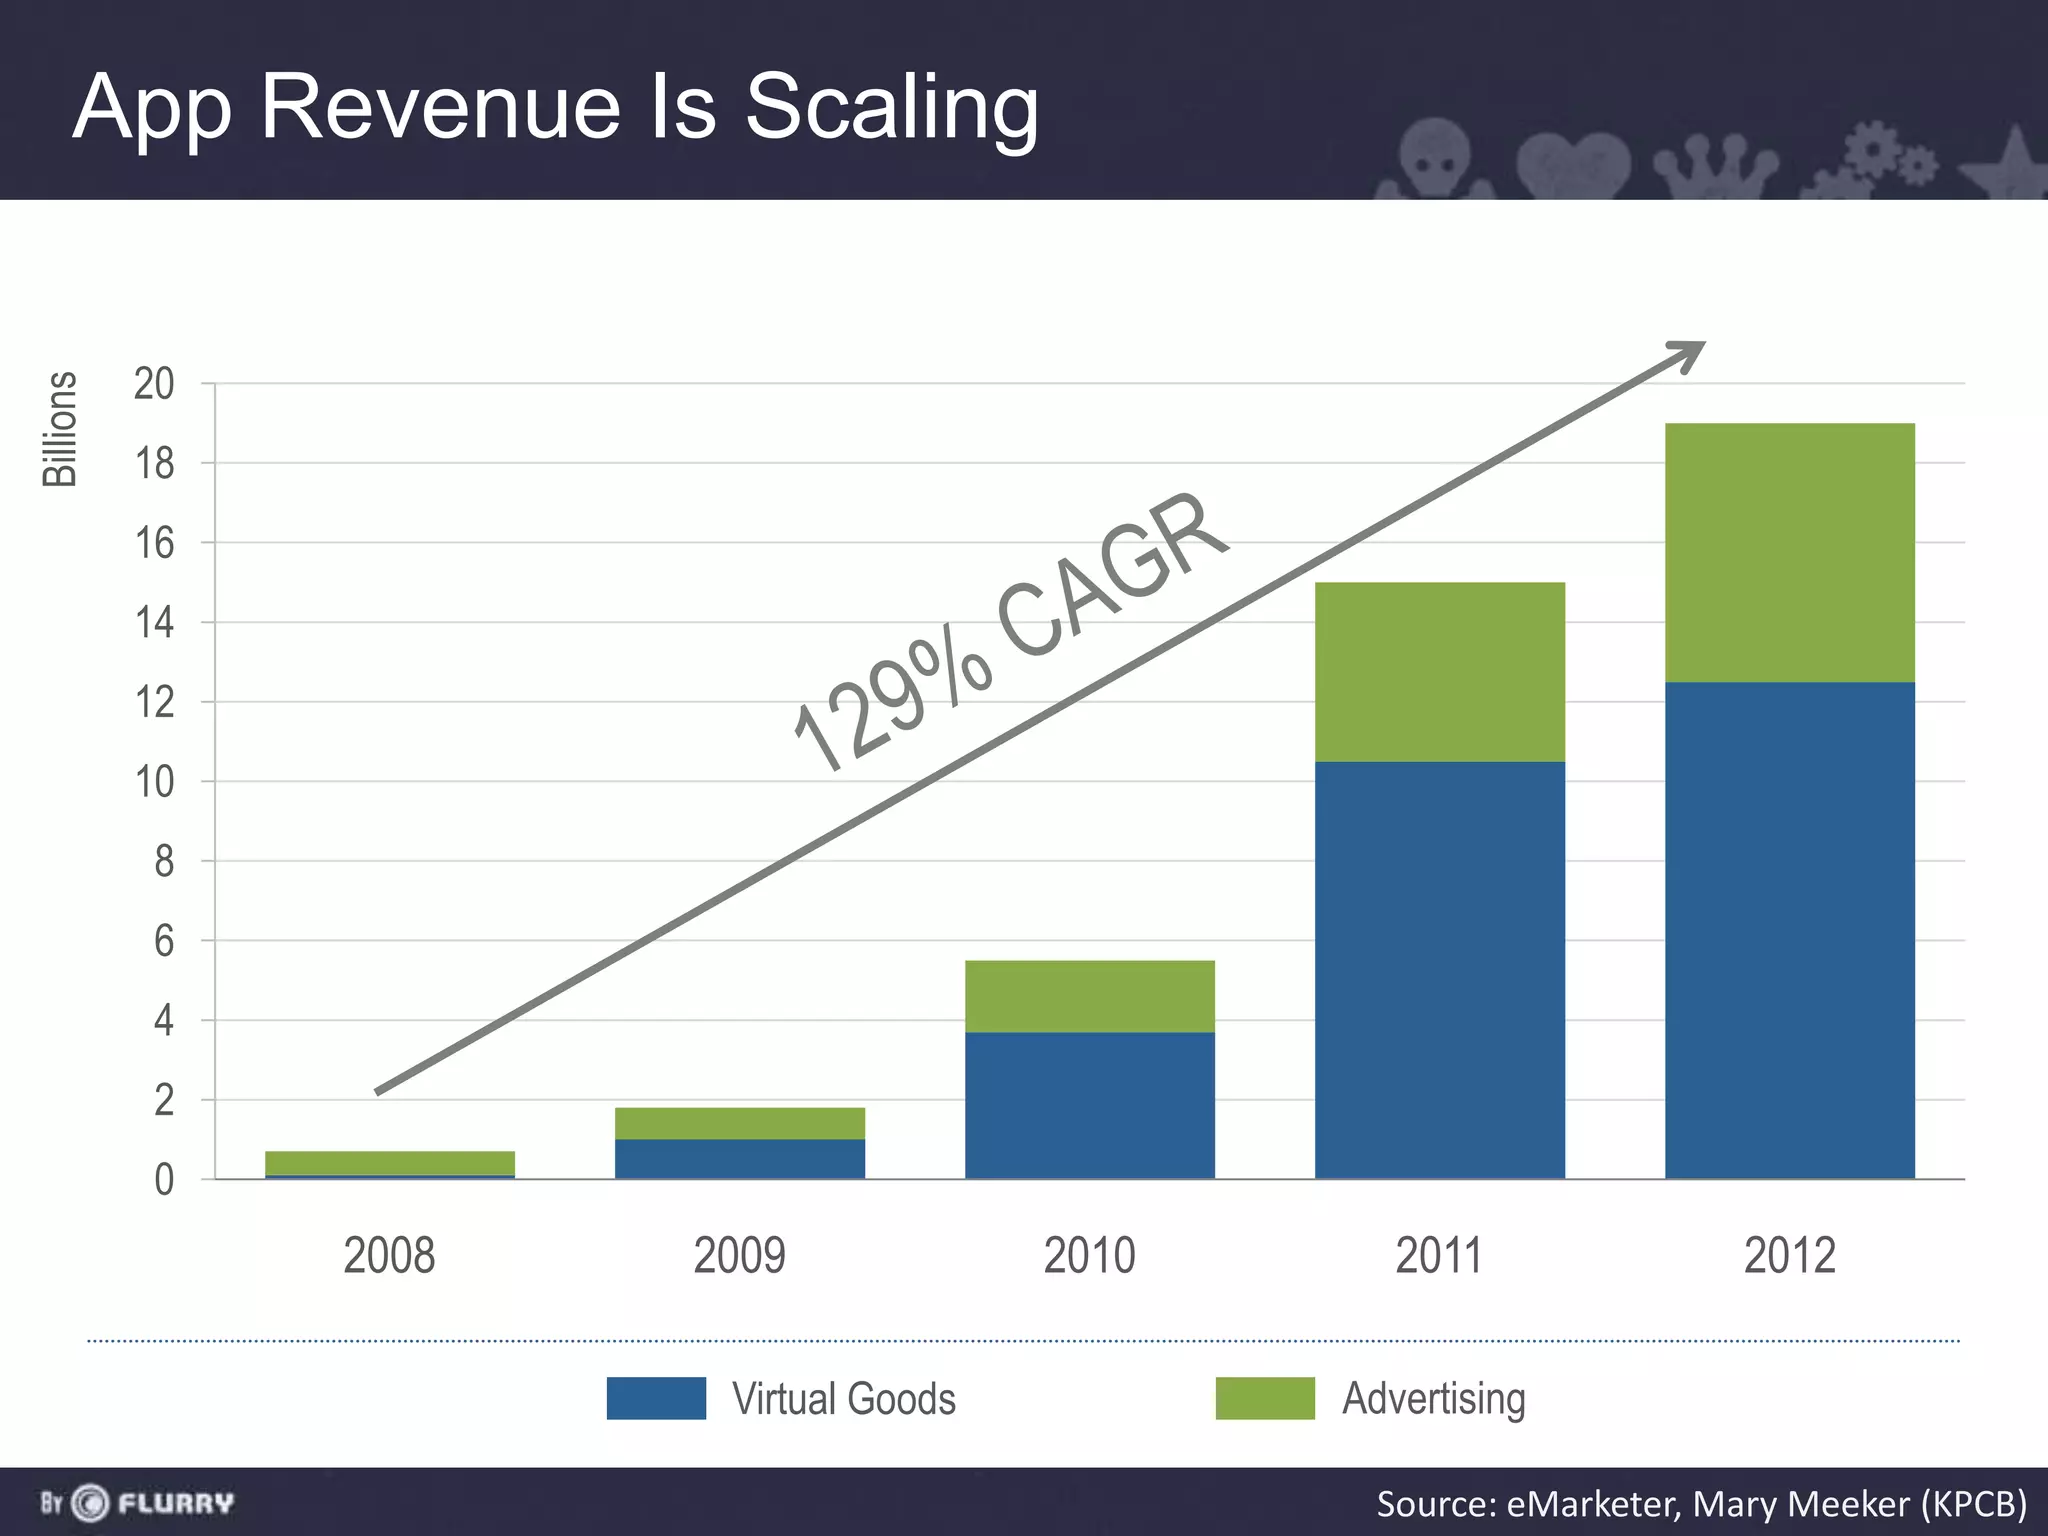
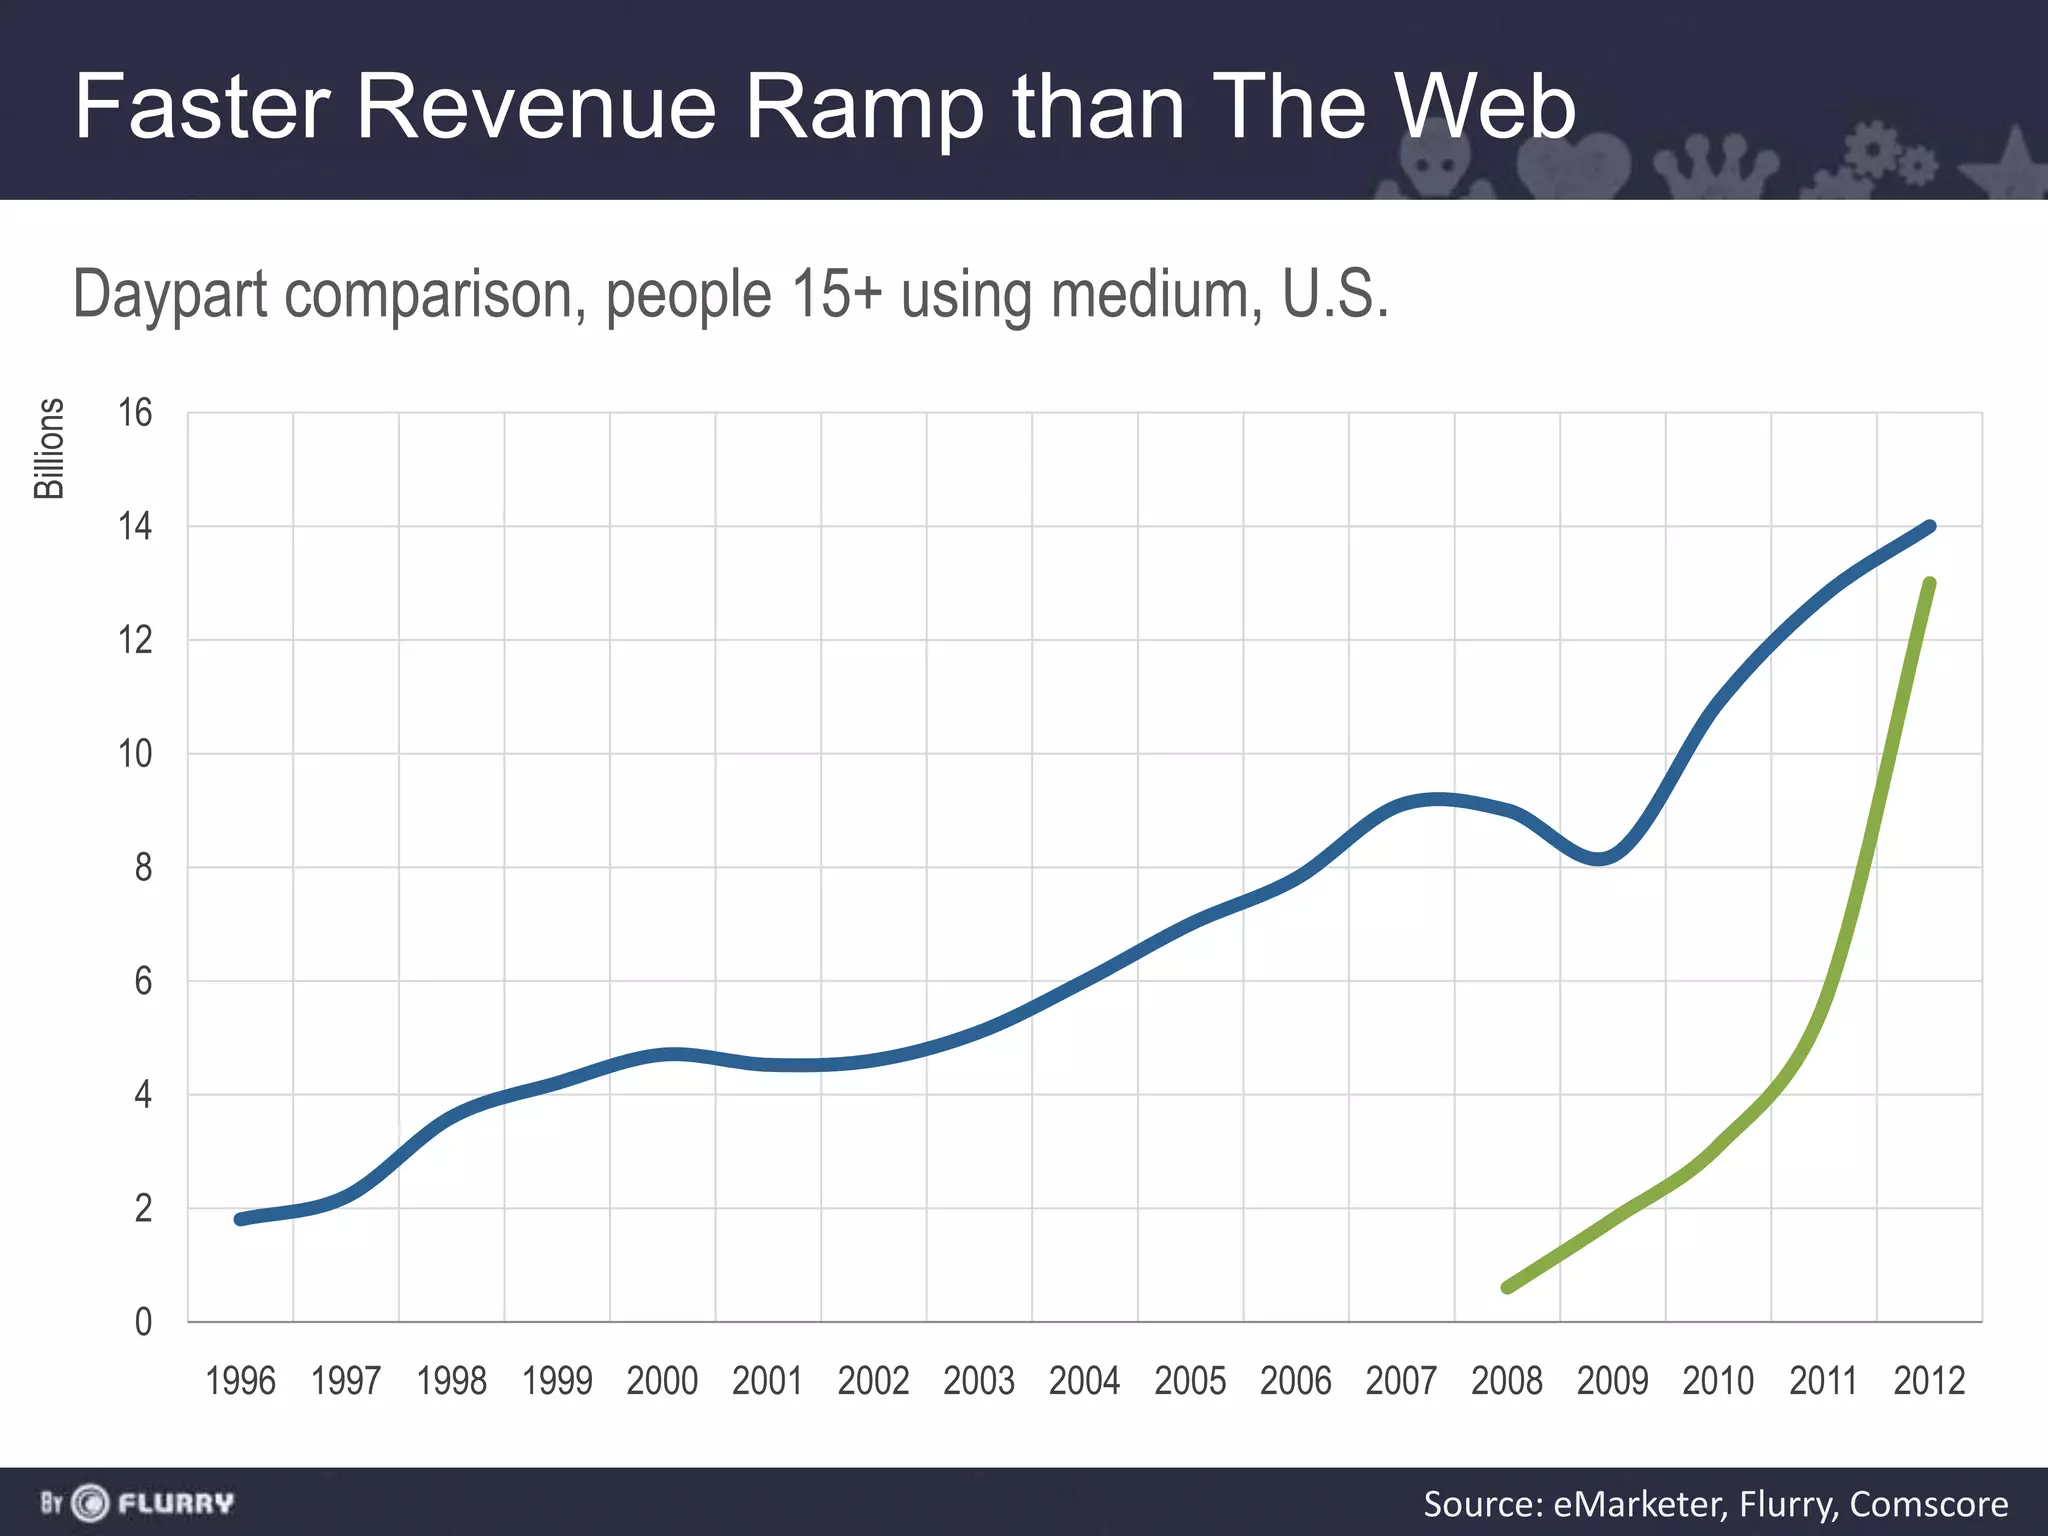
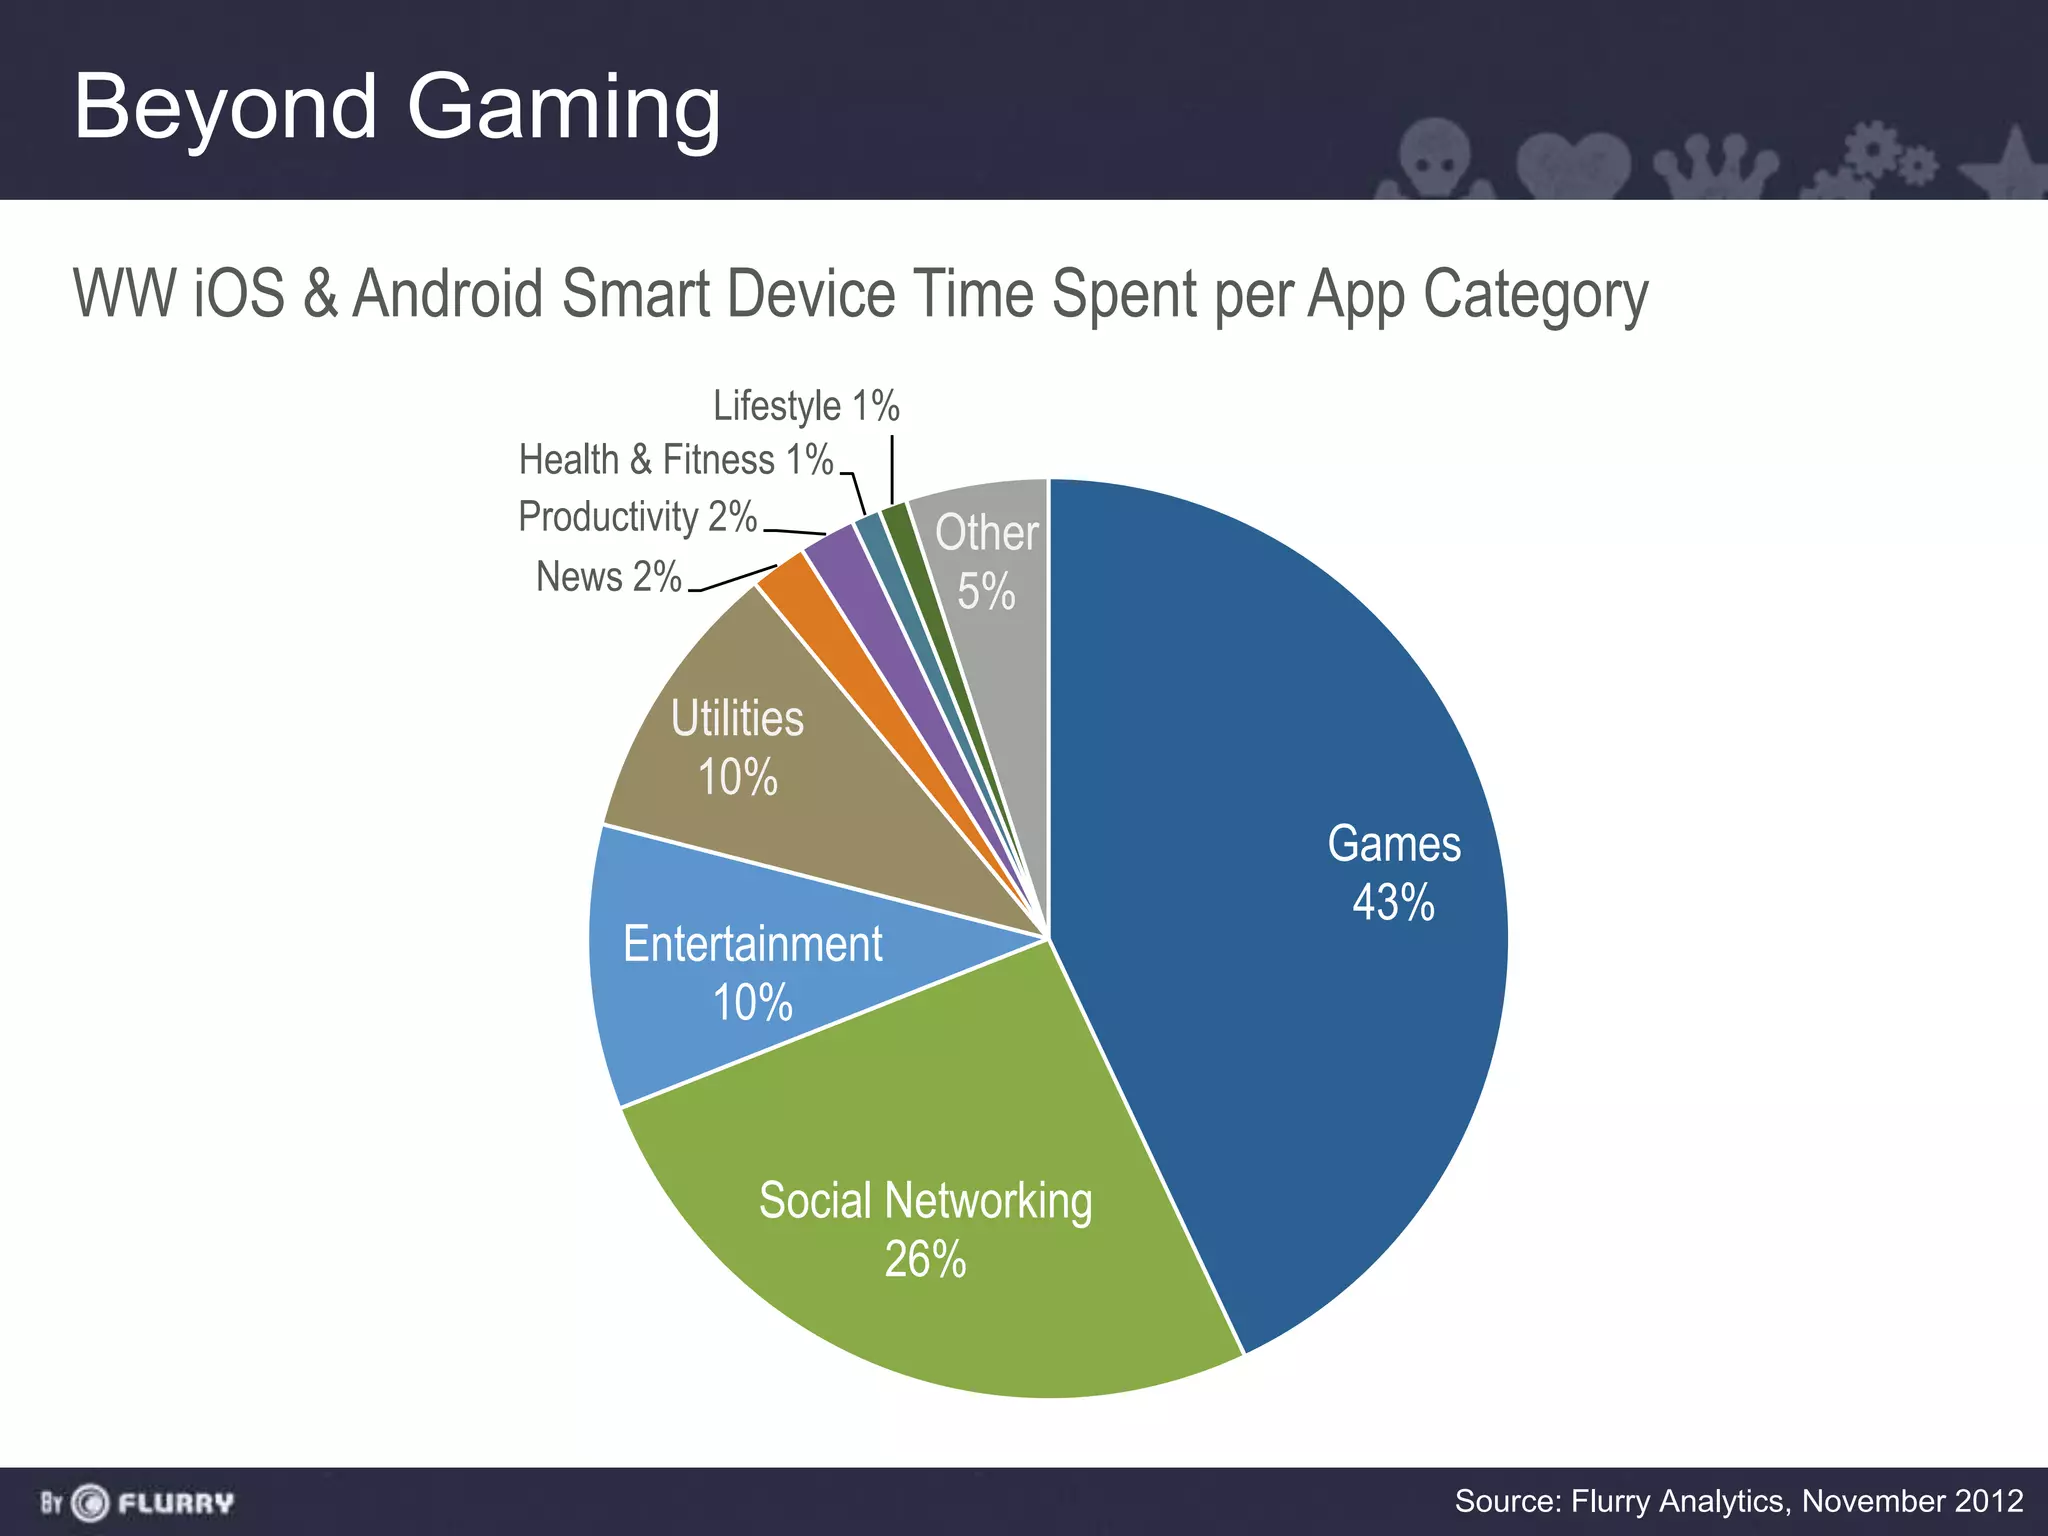
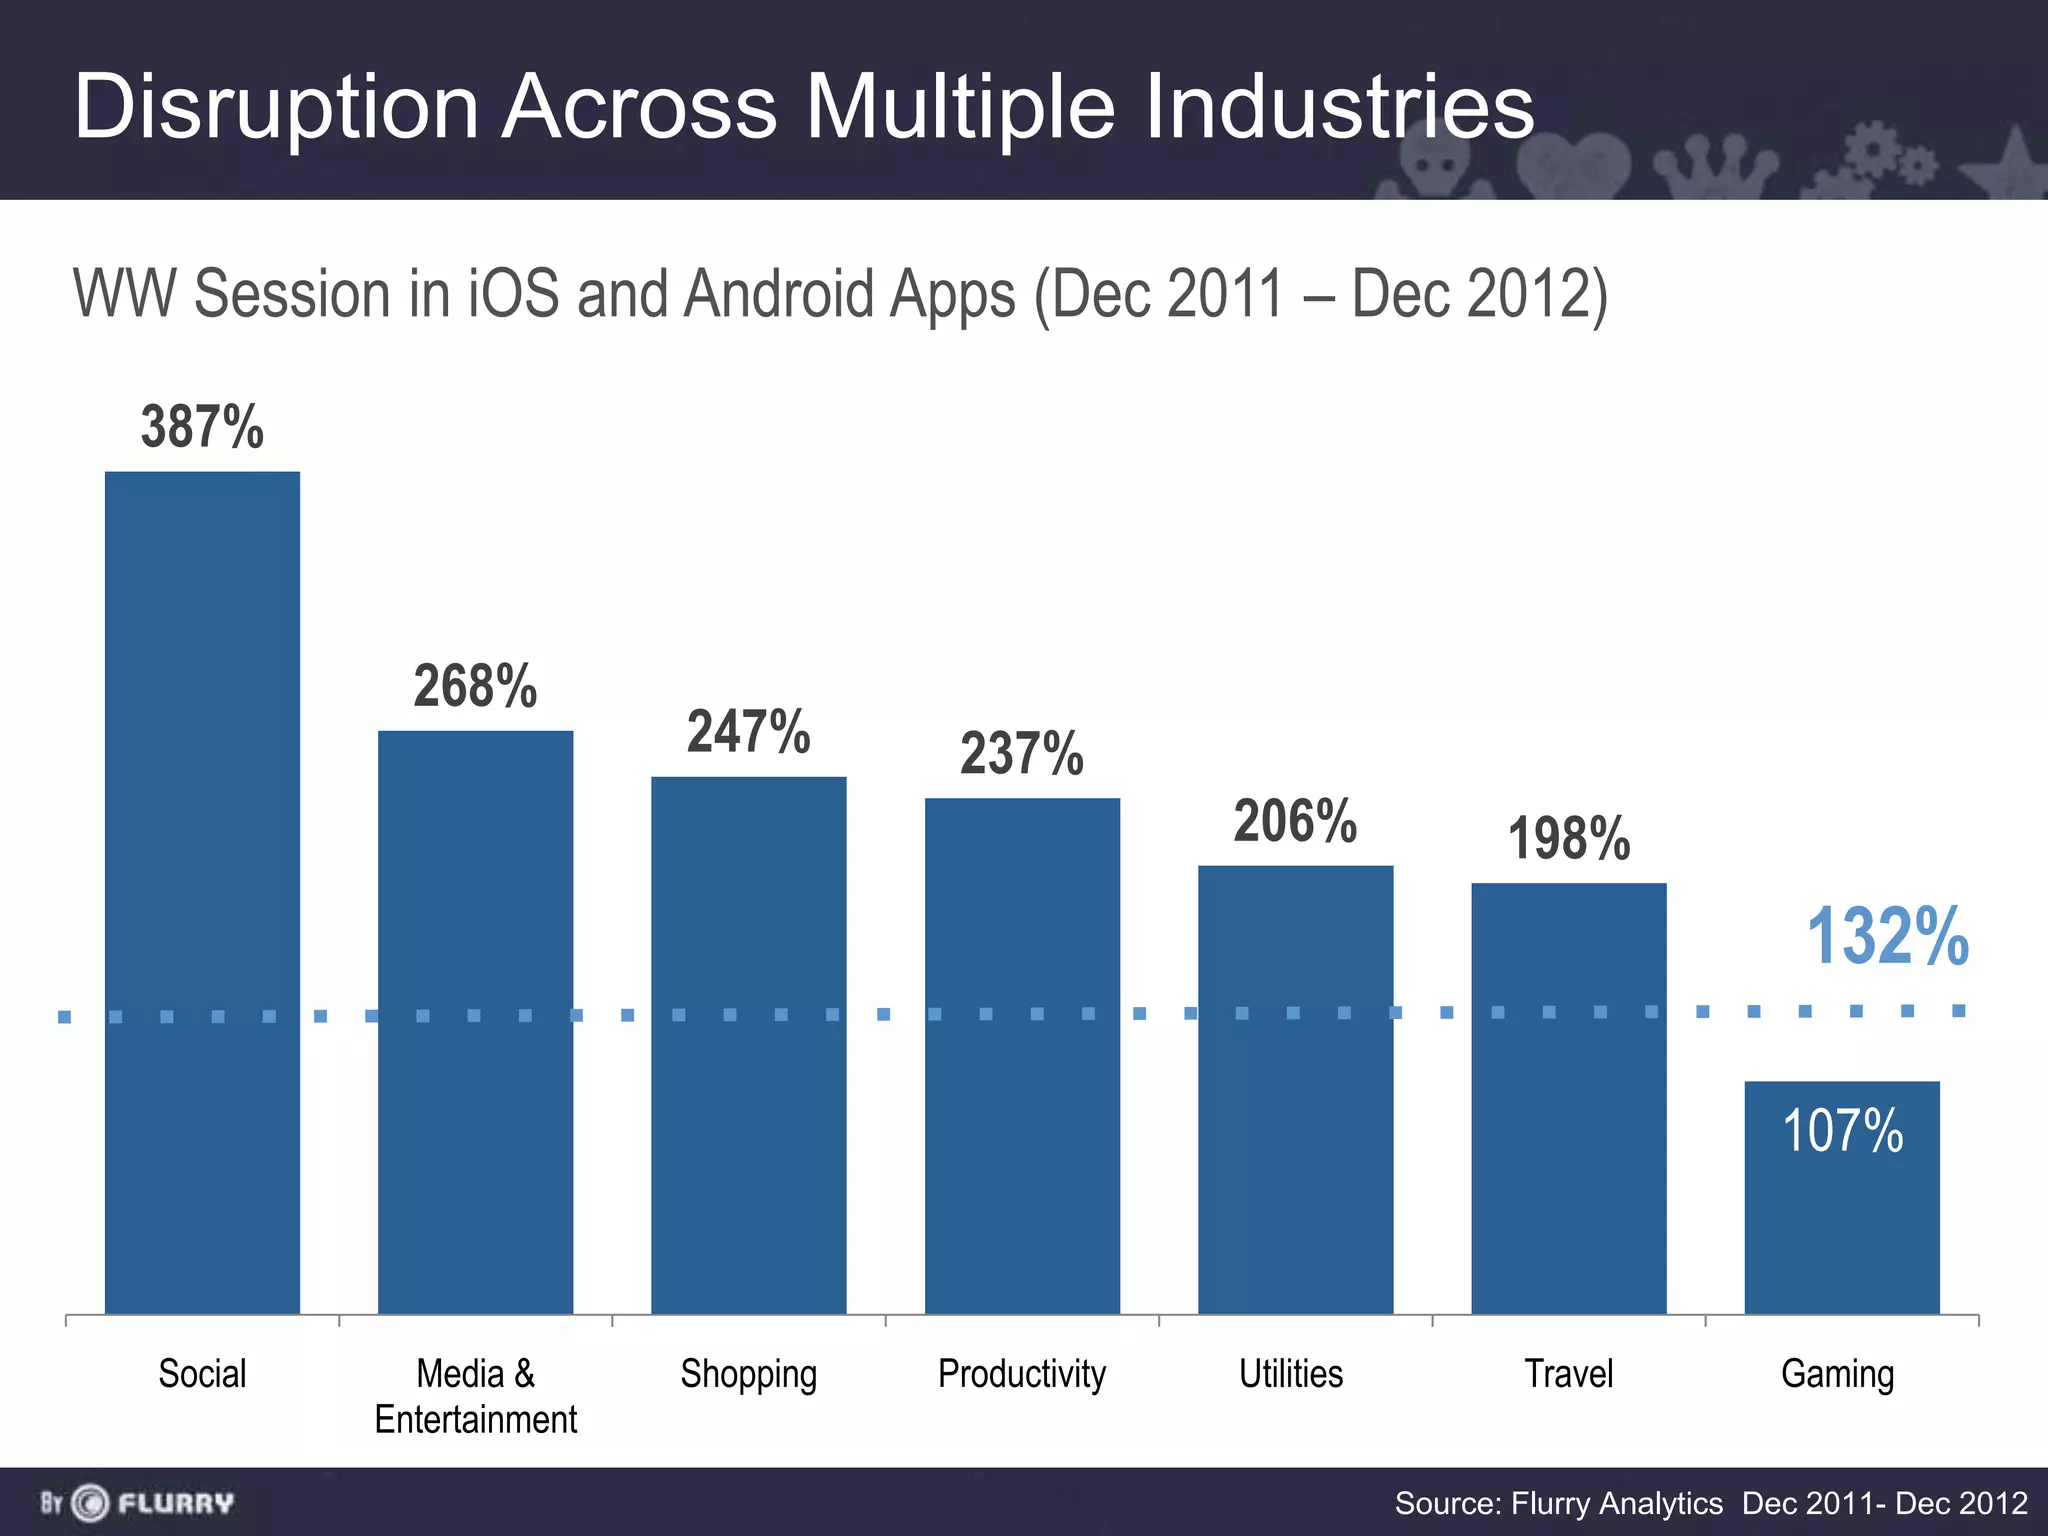
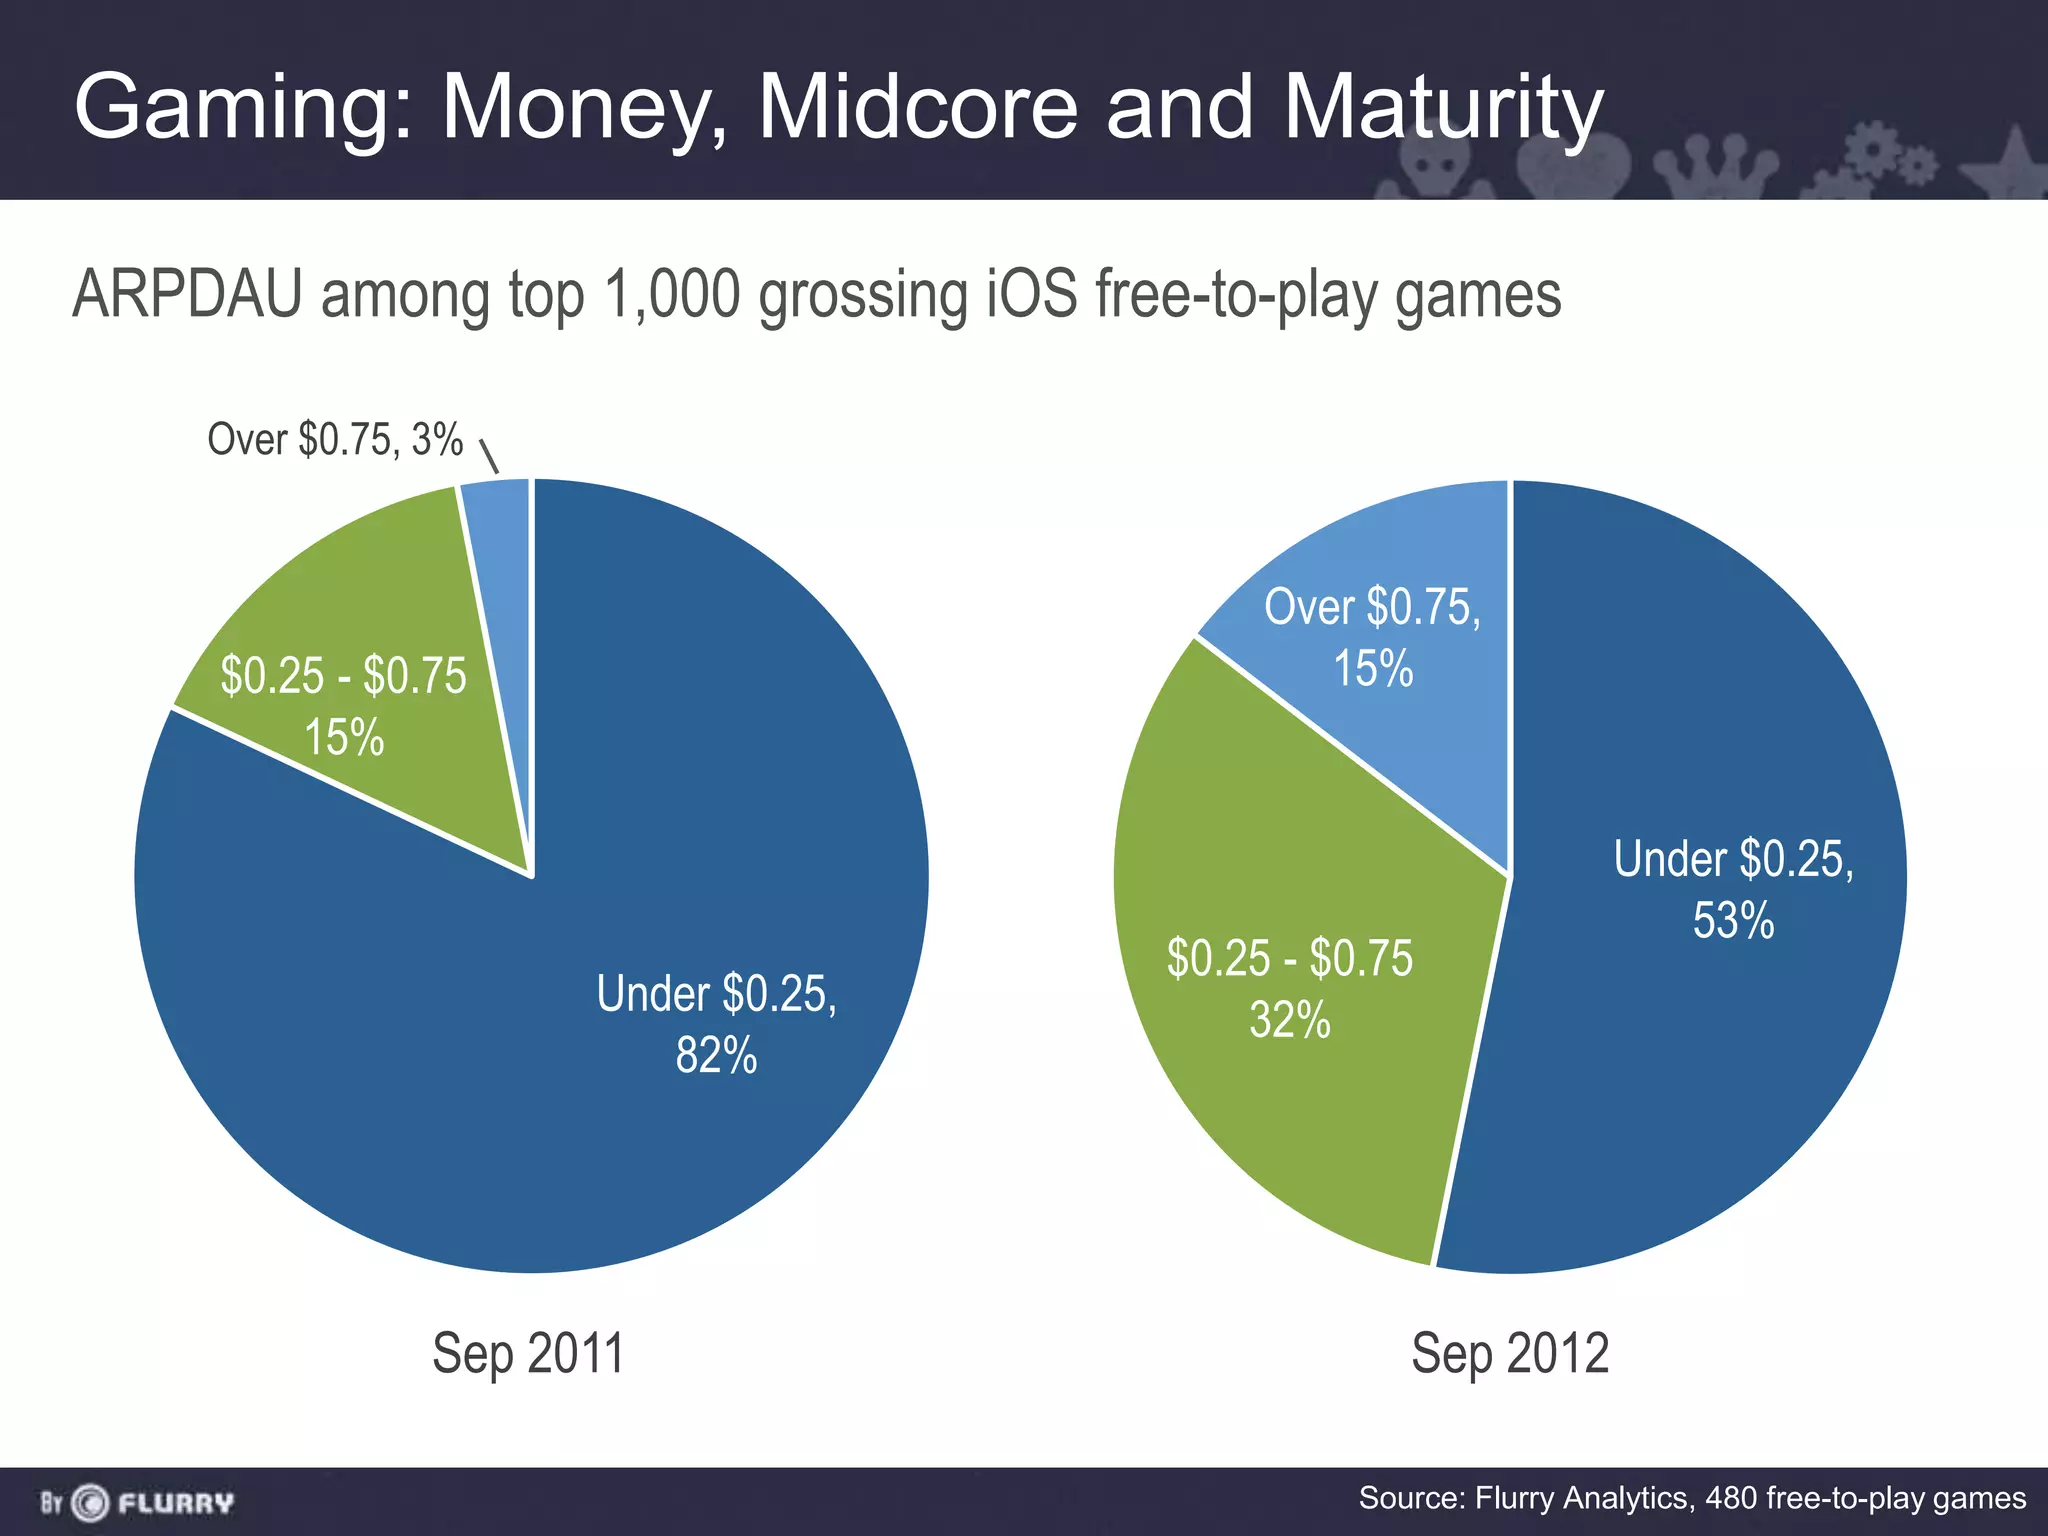
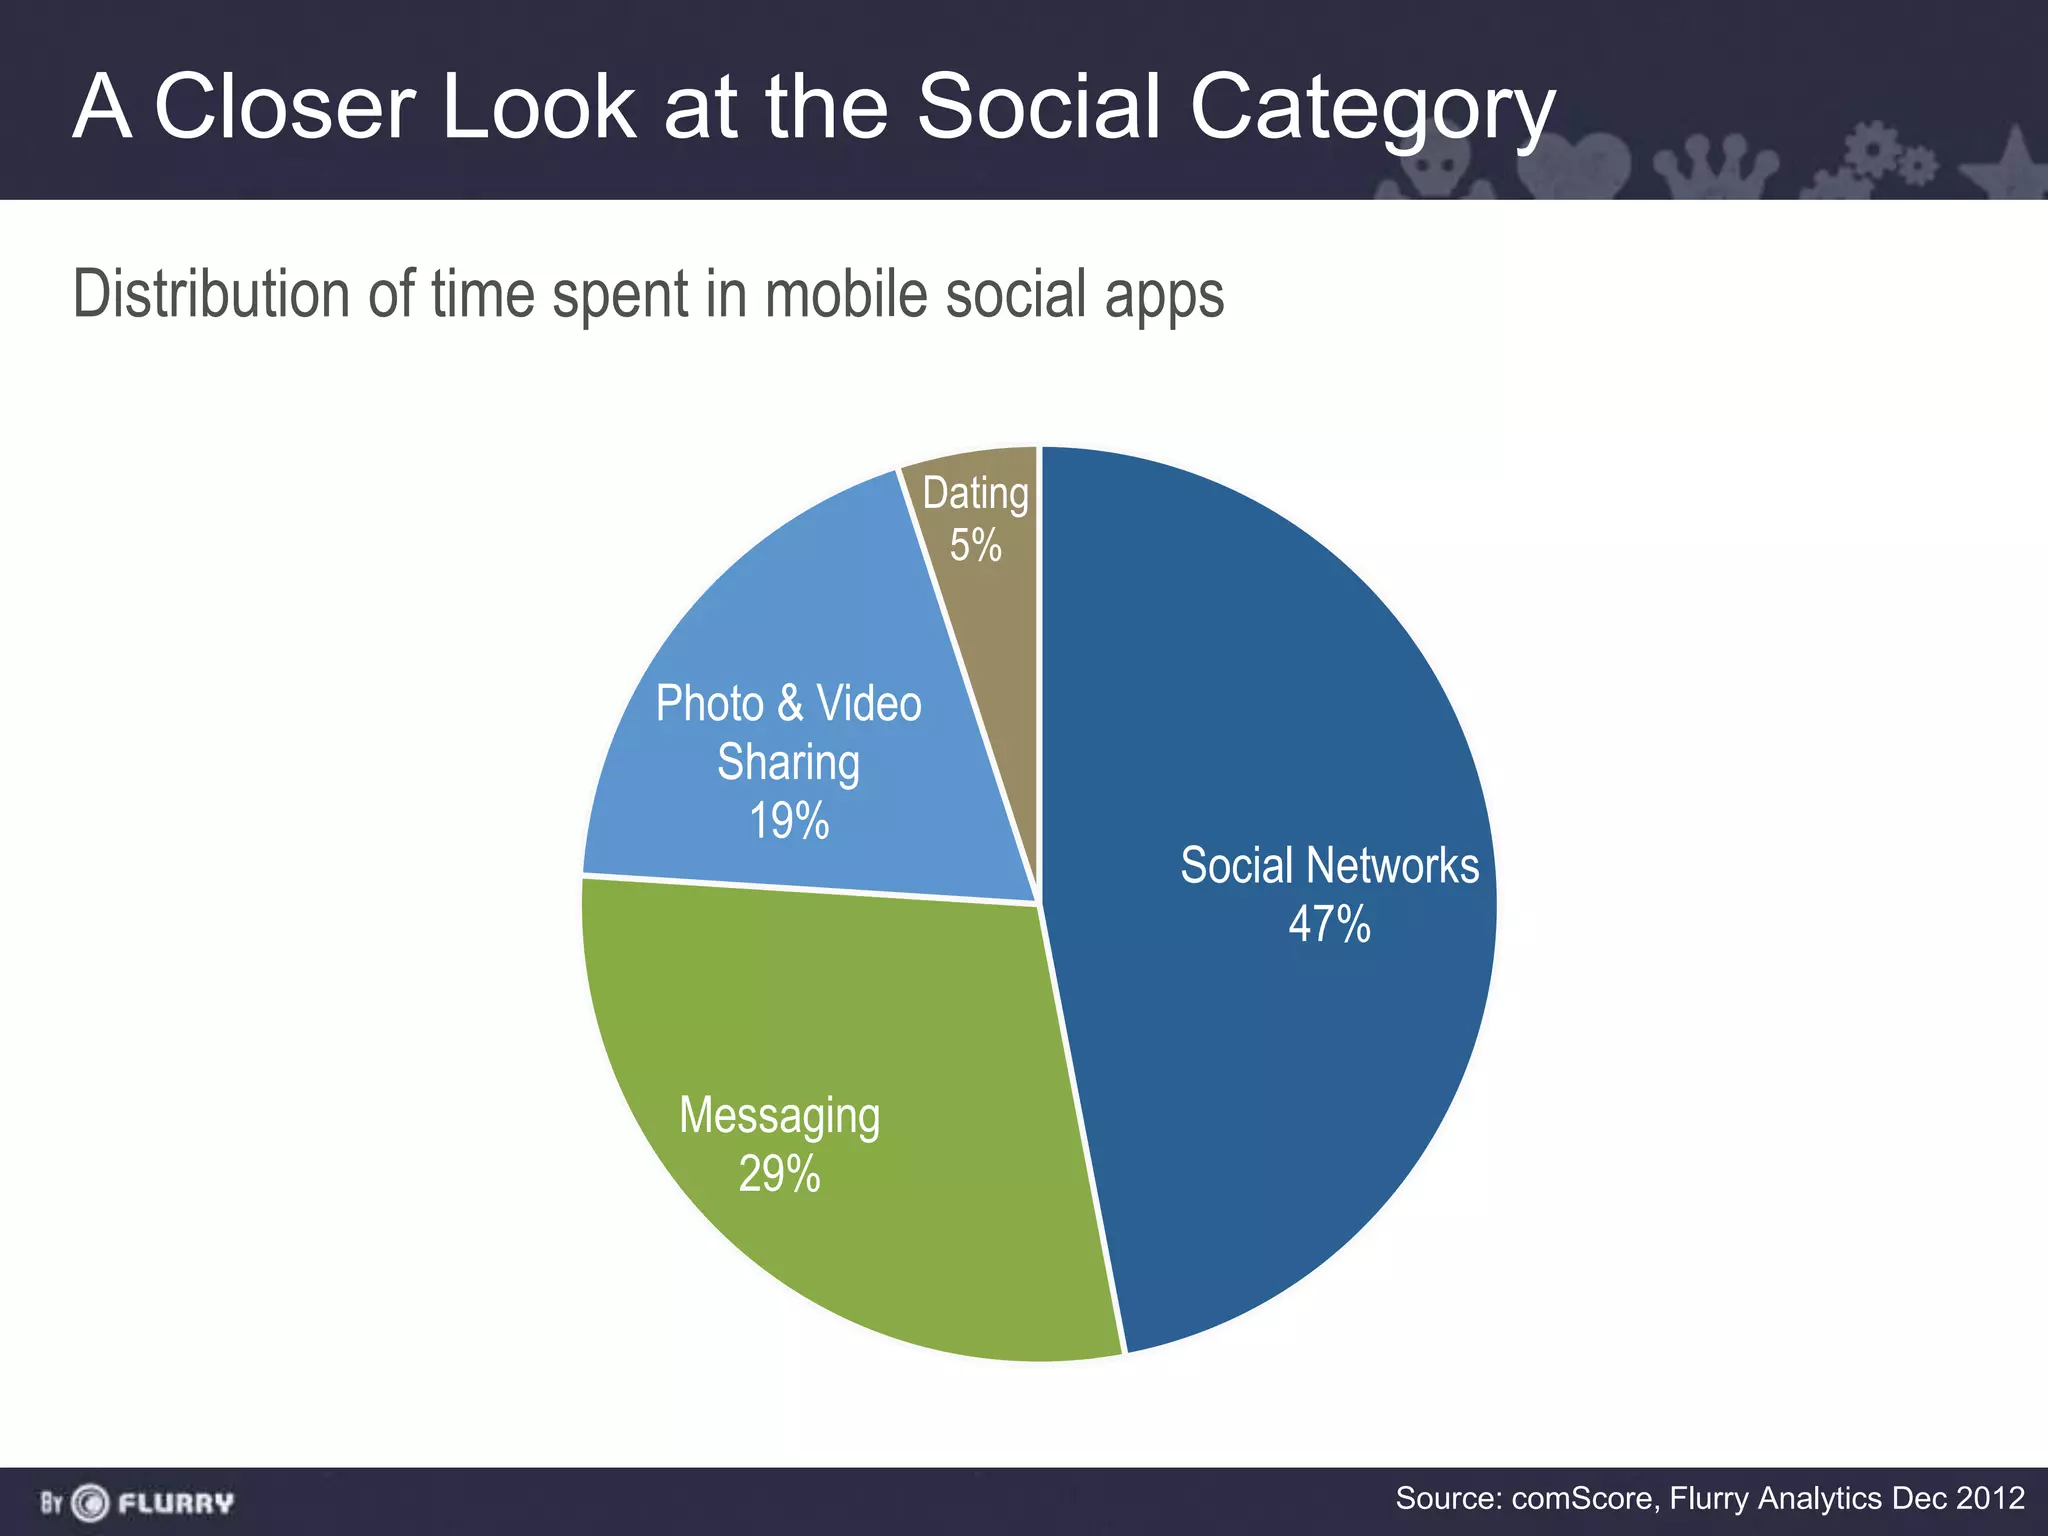
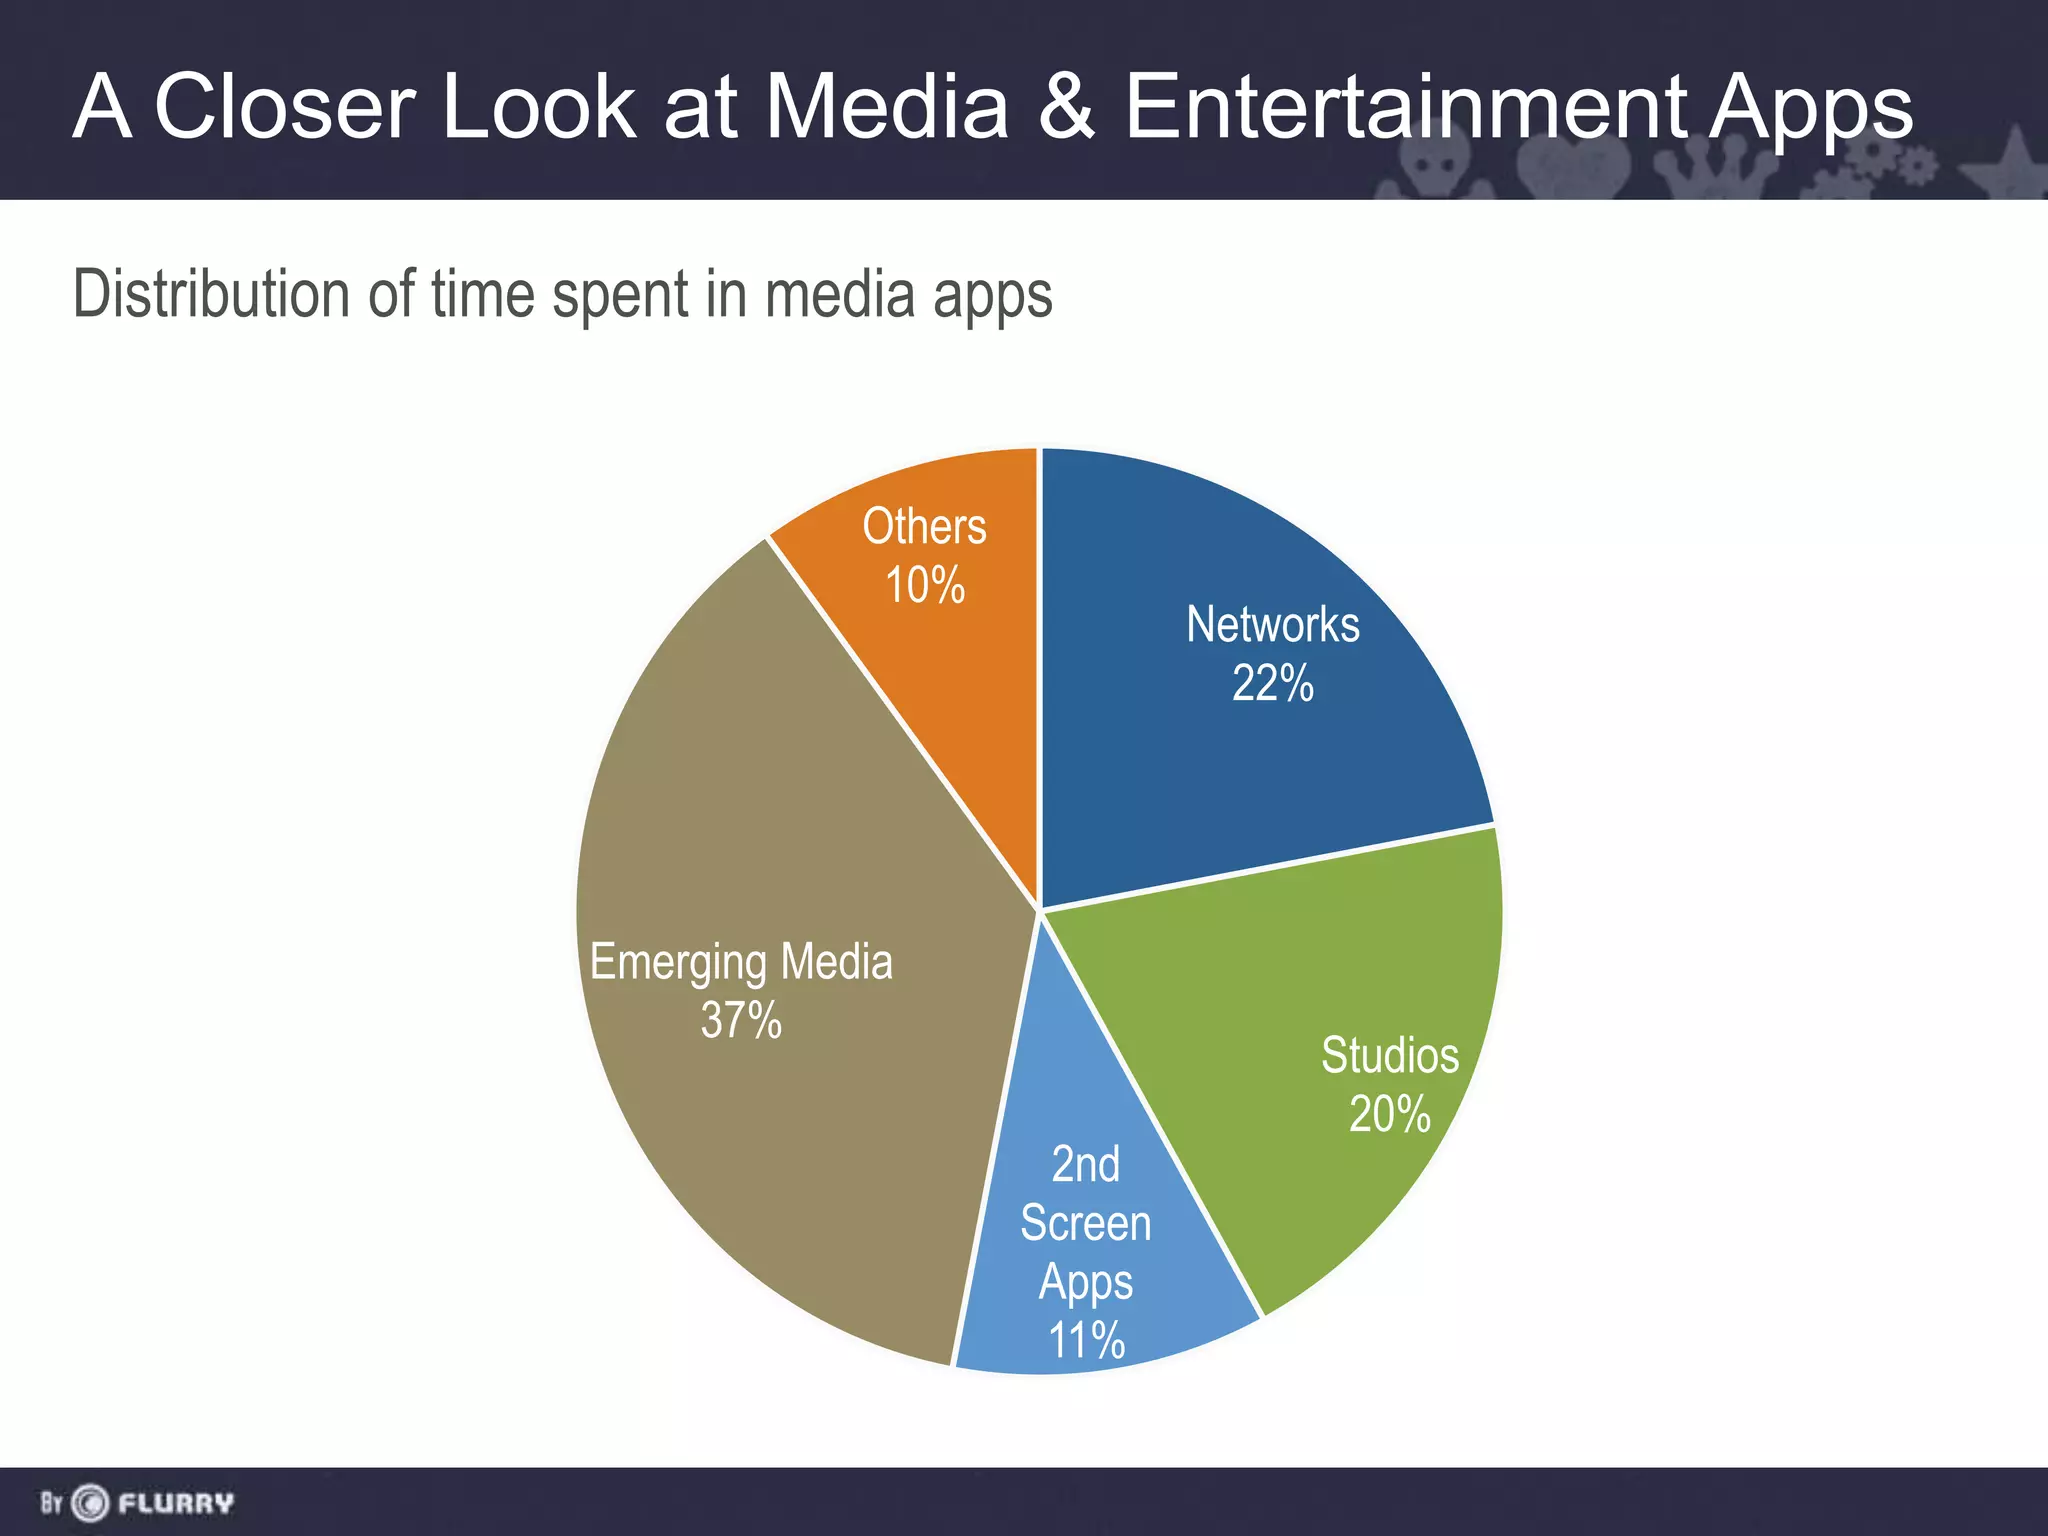
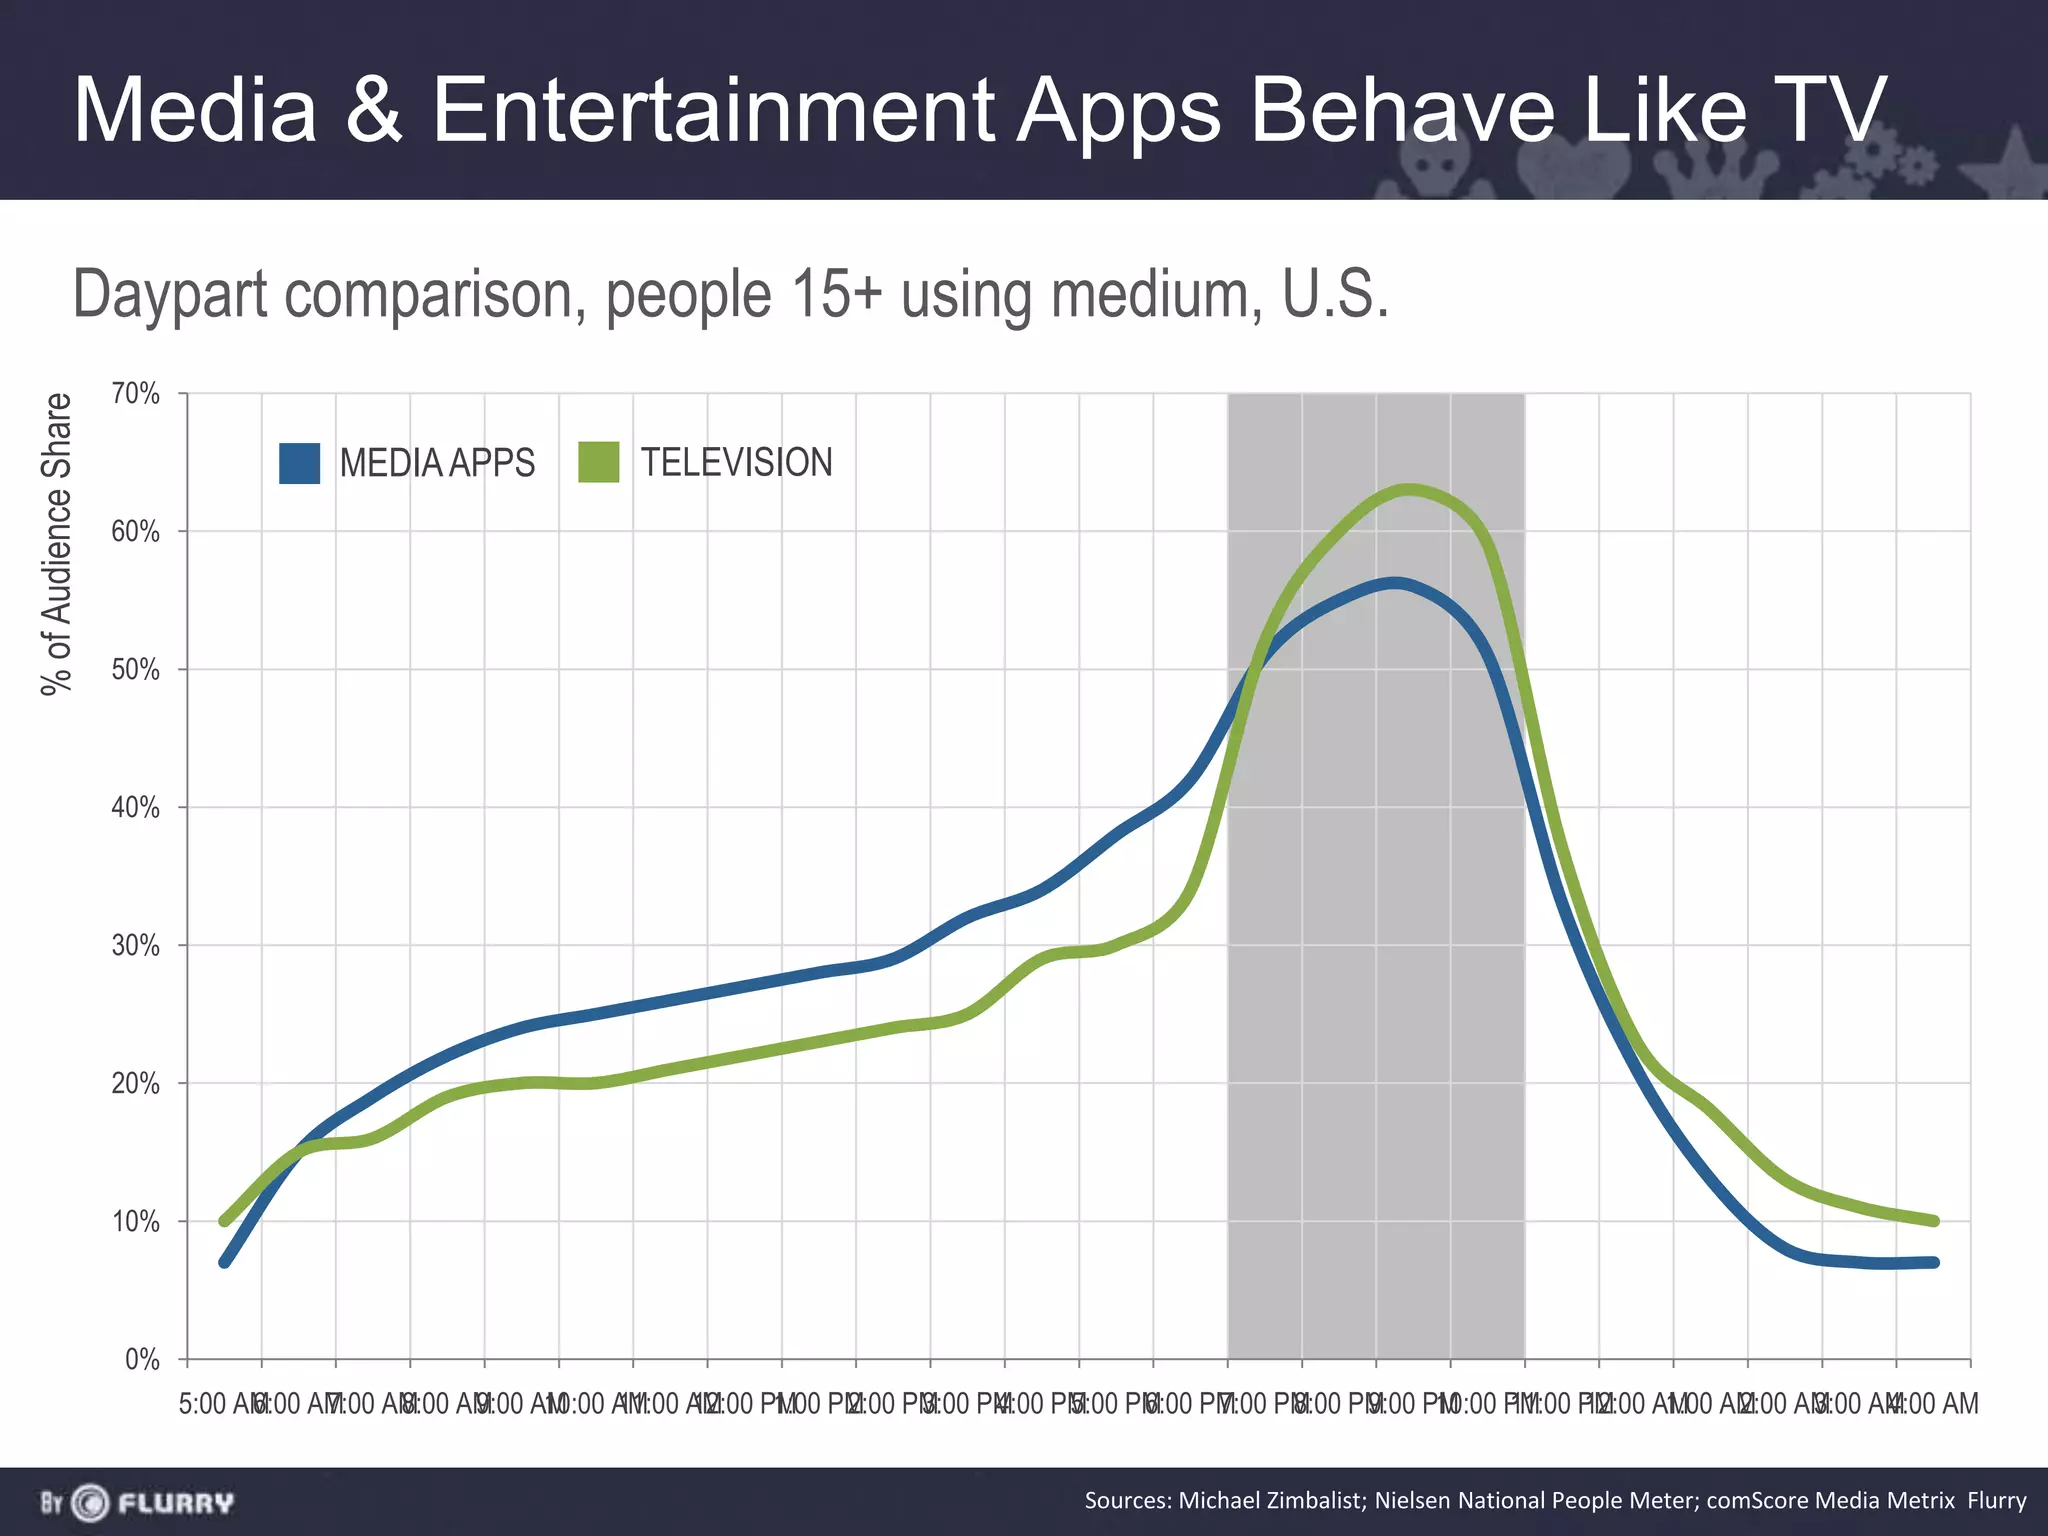
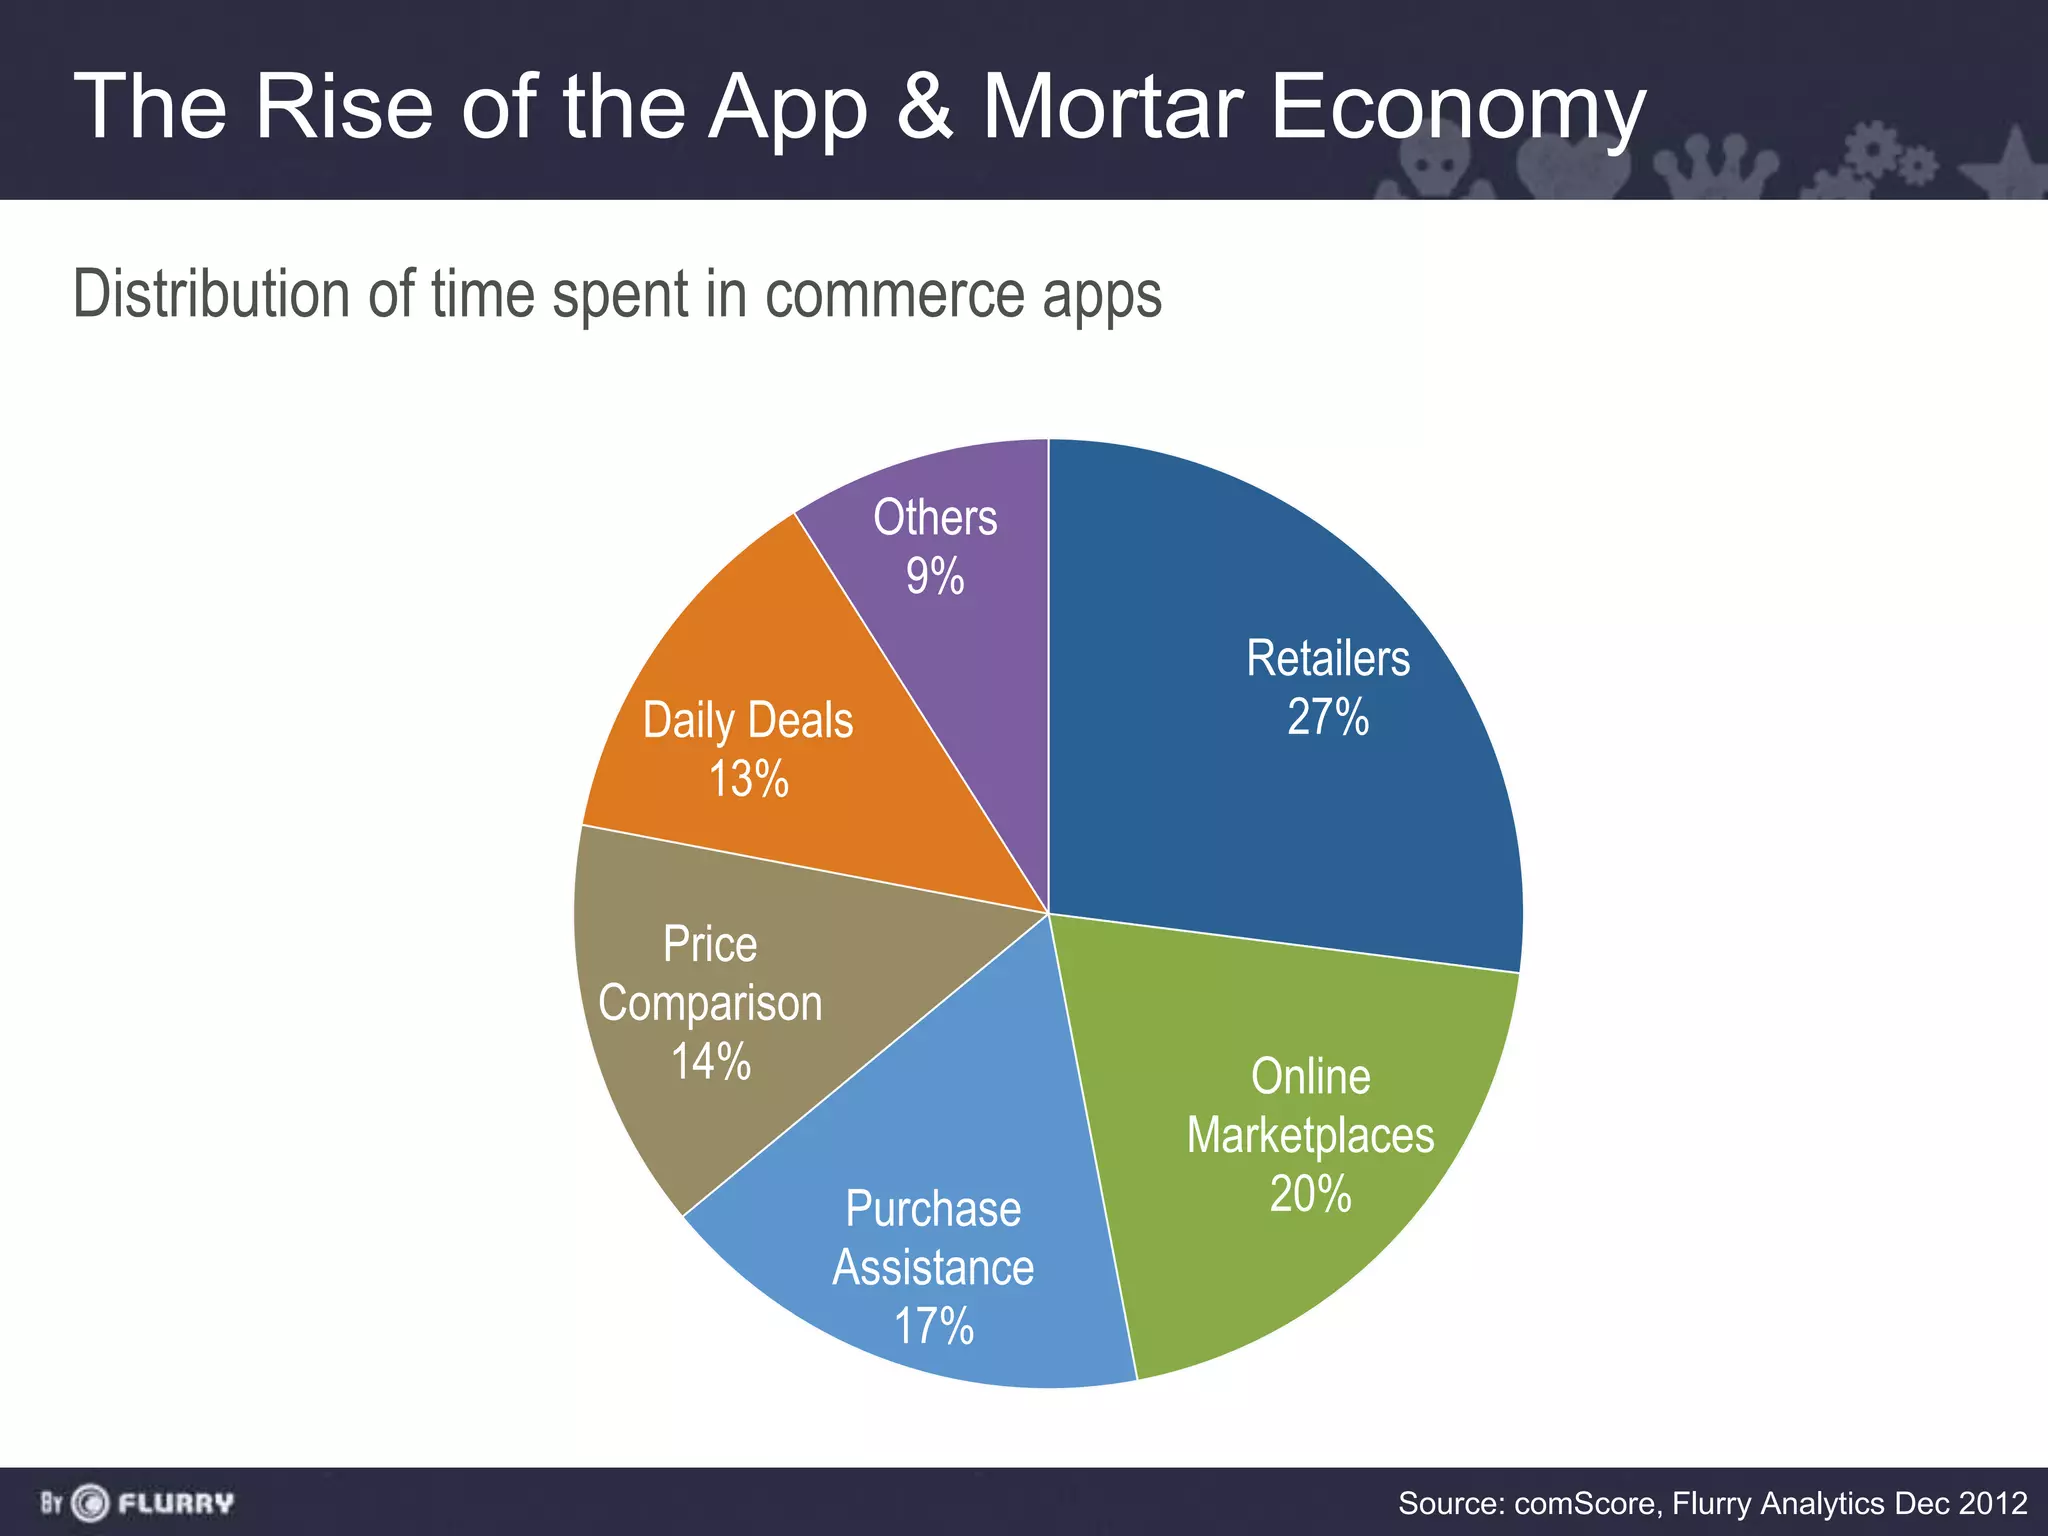
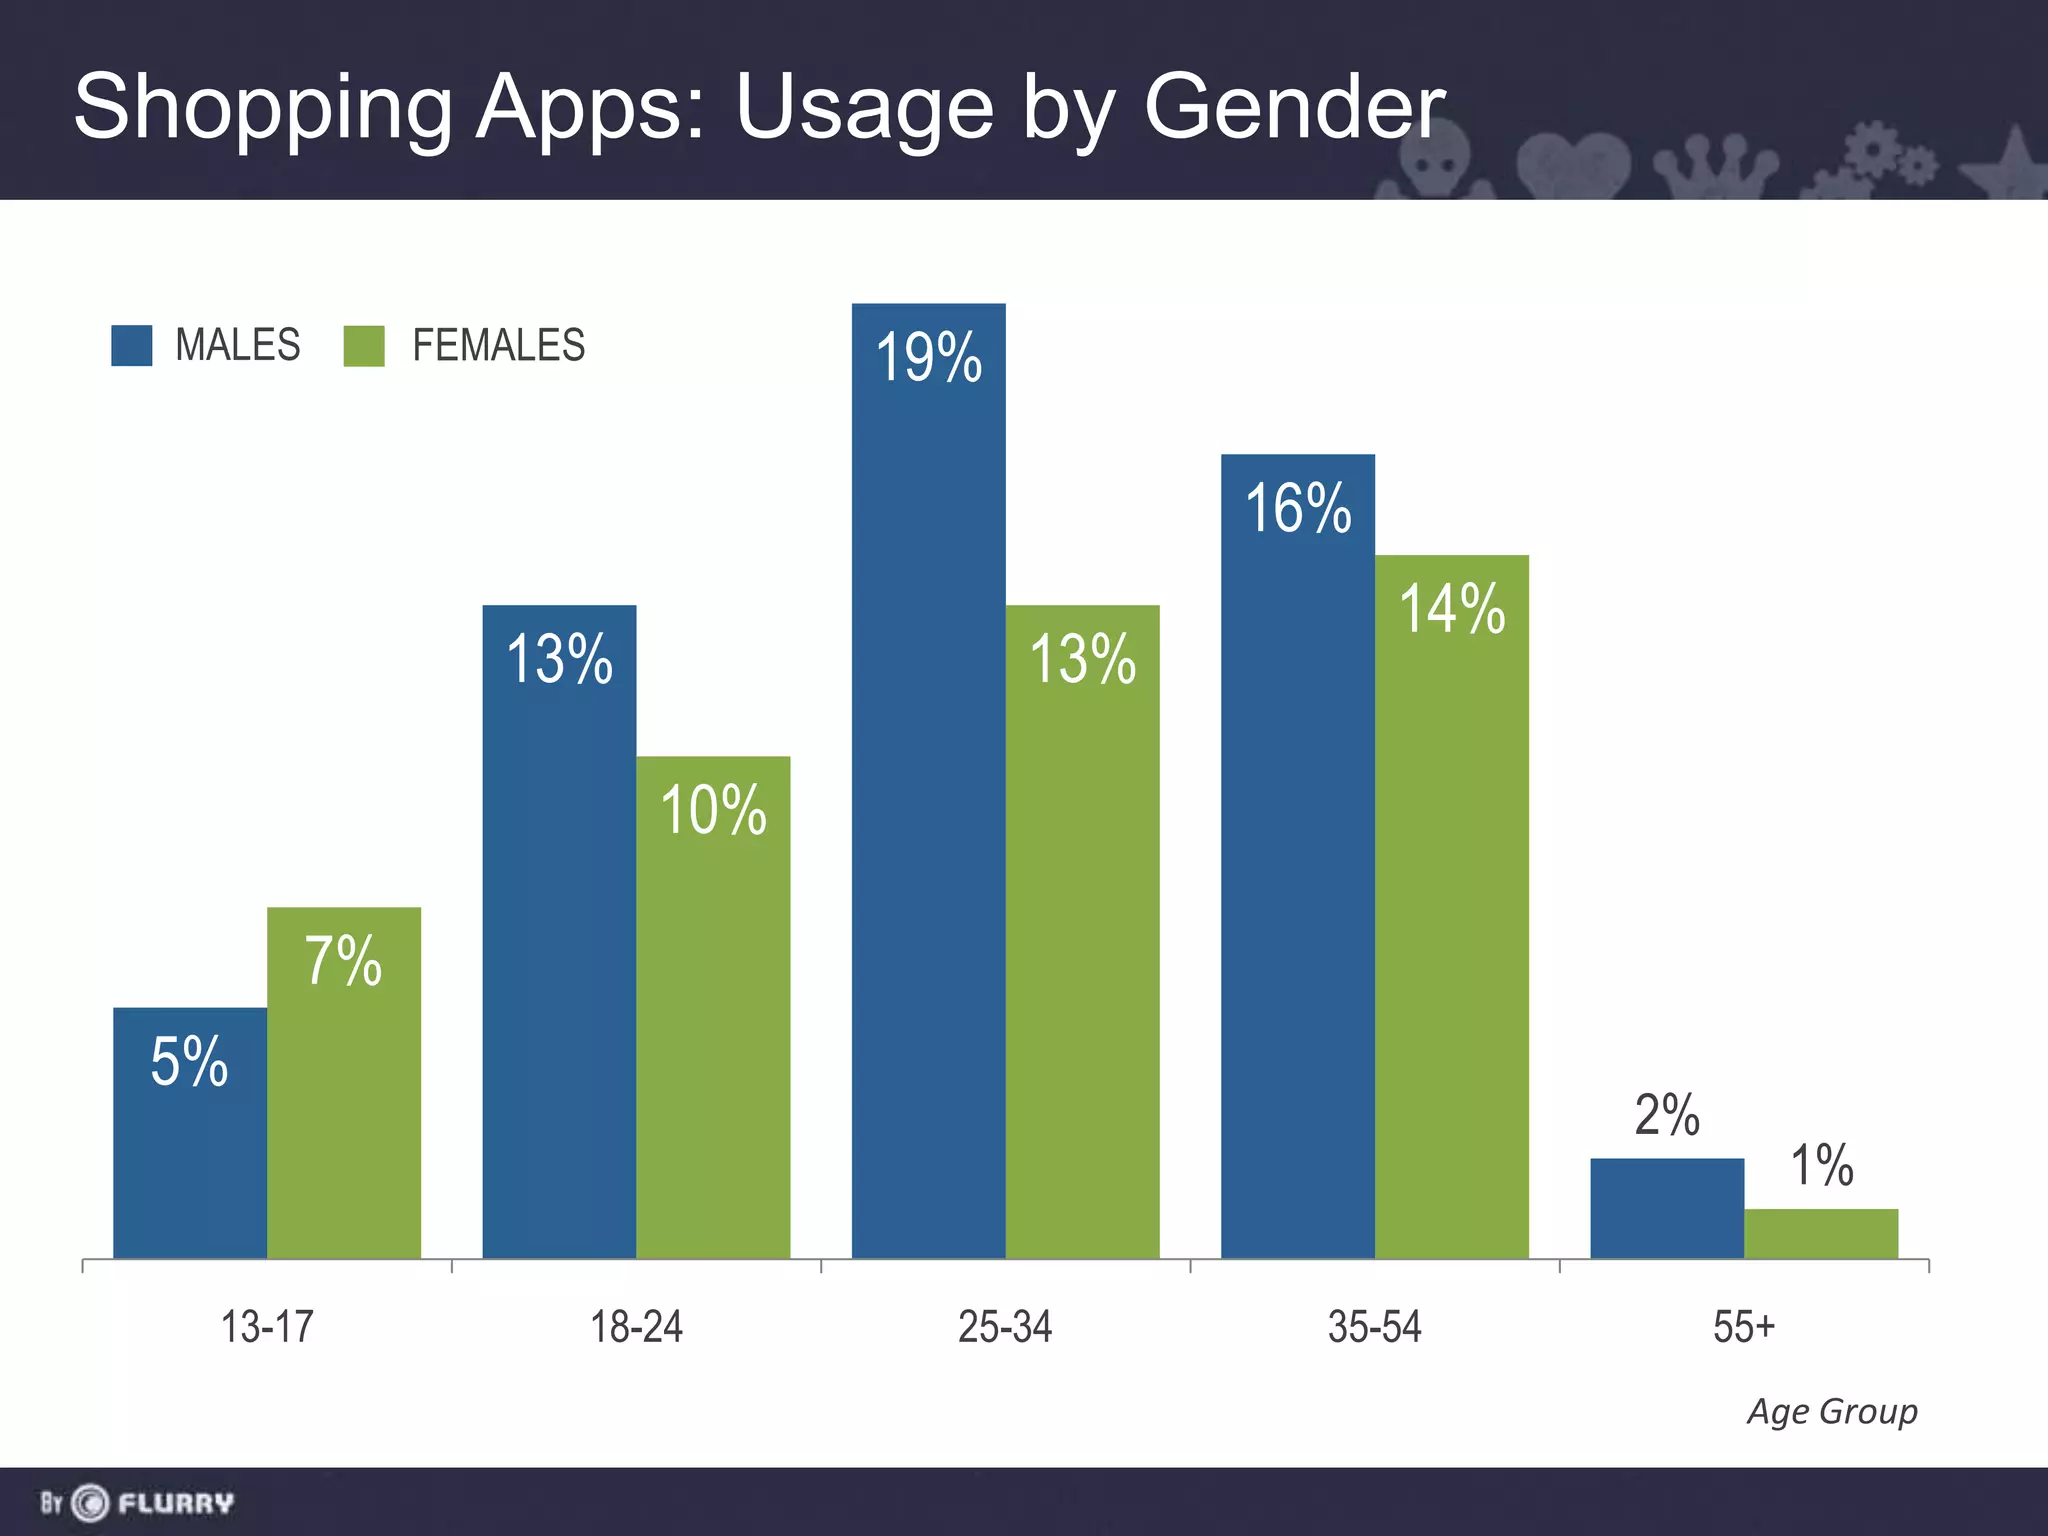
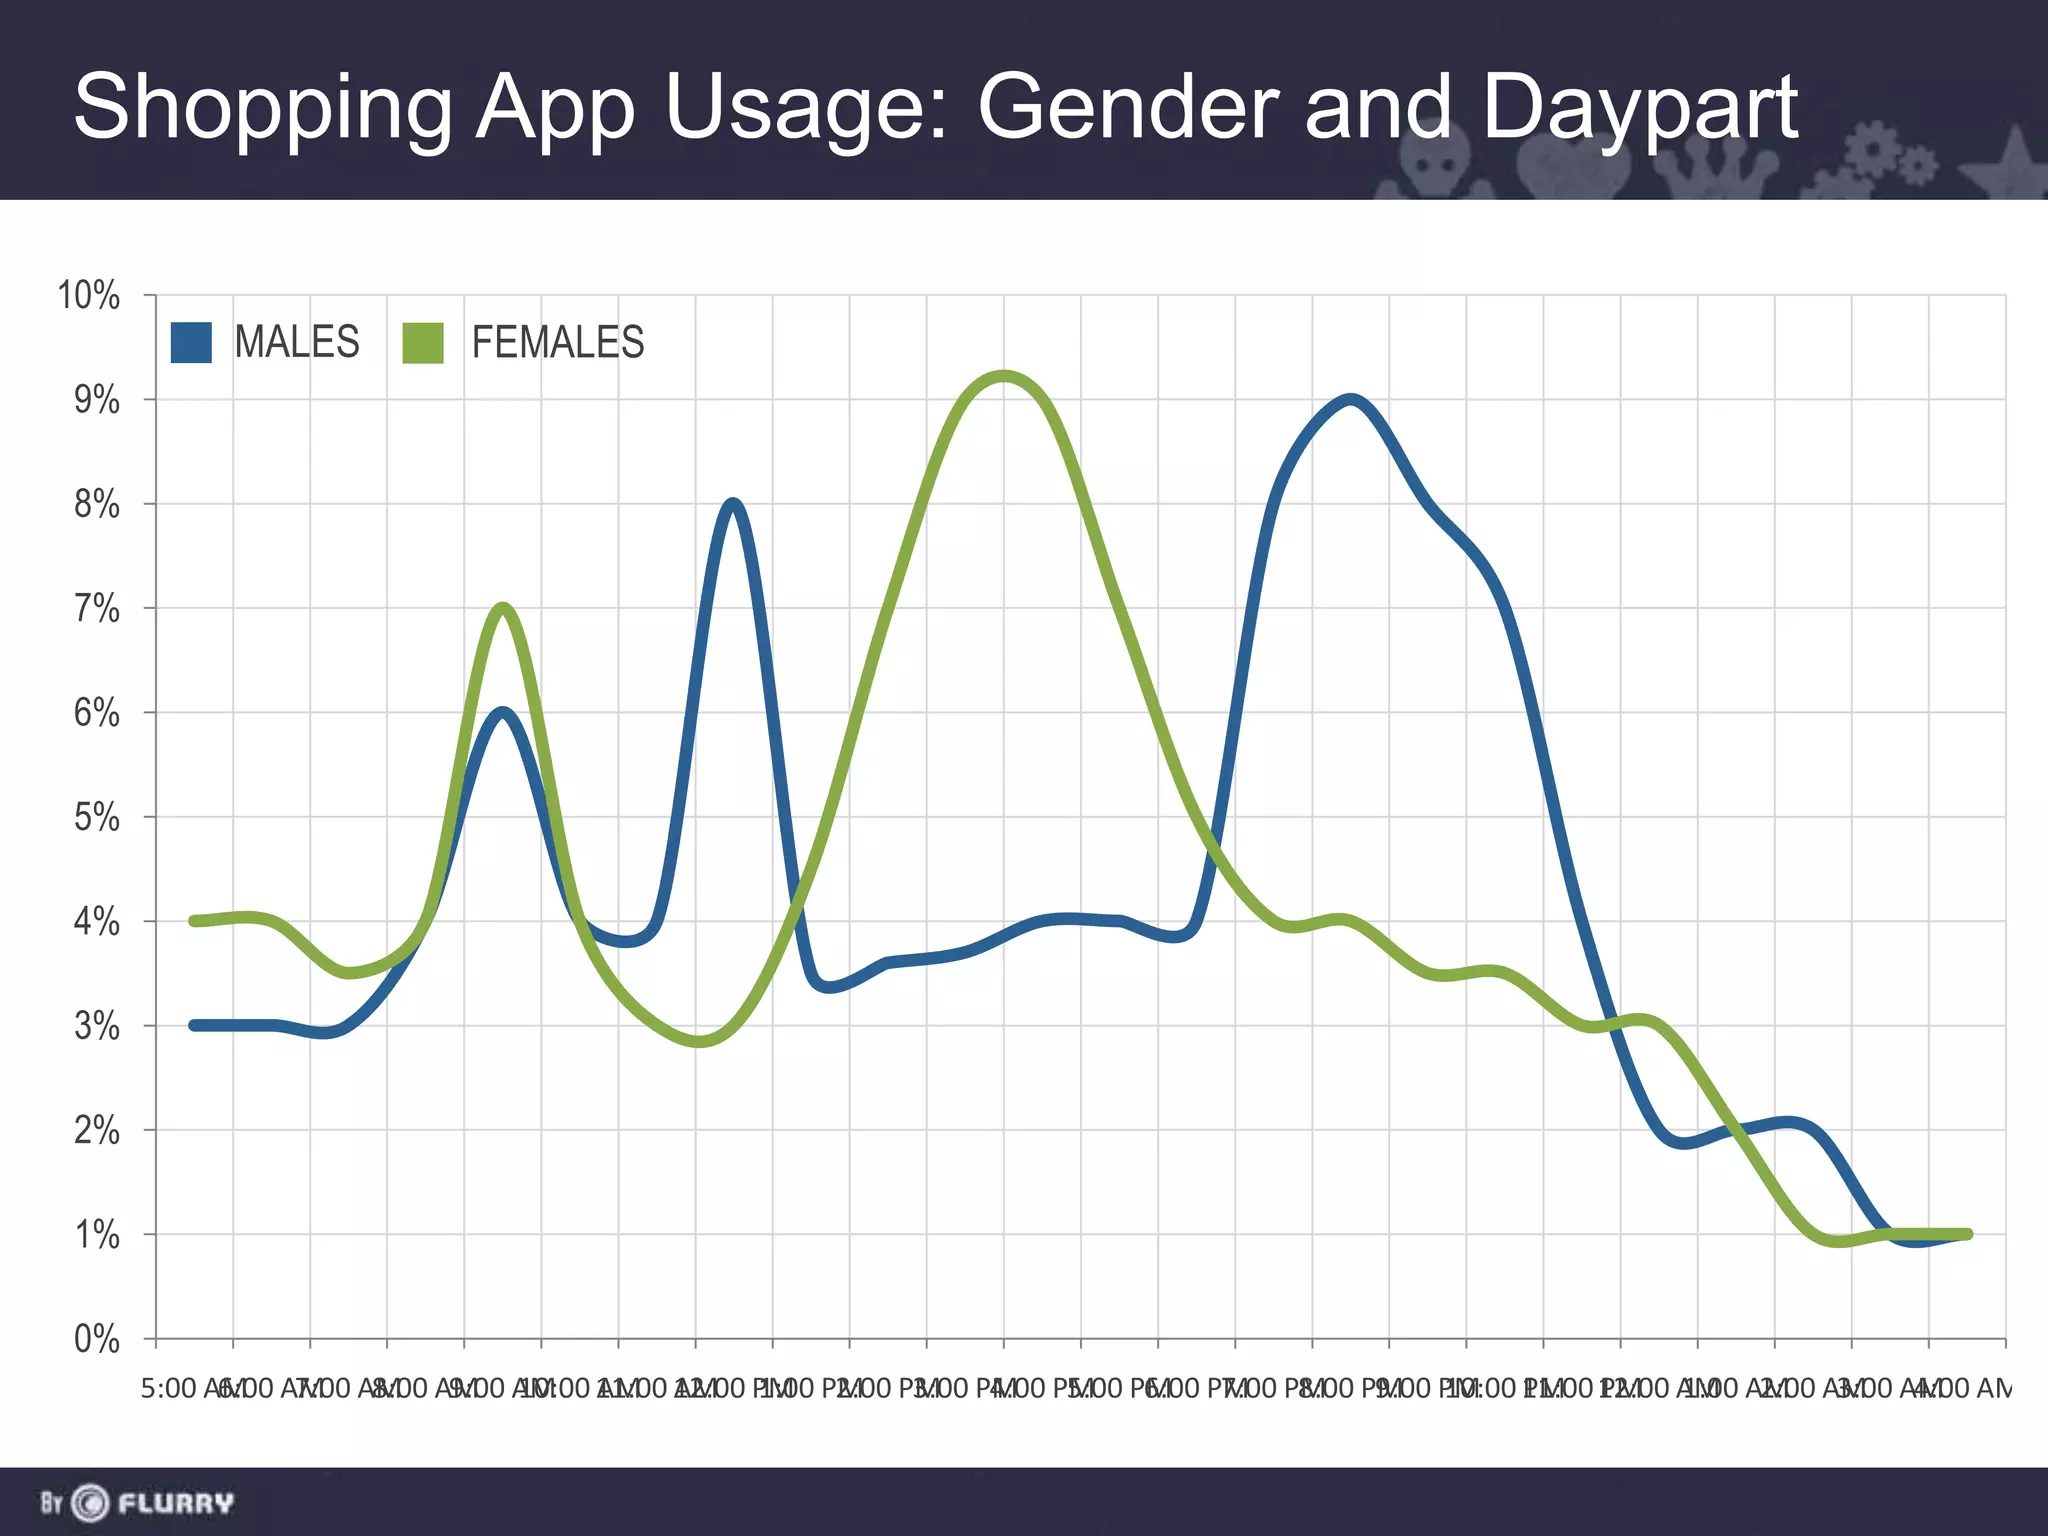
Unstoppable Market Growth

Worldwide in-application events measured by Flurry (billions)
1,200

1,100

1,000

 900

 800

 700

 600

 500

 400

 300

 200

 100

   -
        May Jul Sep Nov Jan Mar May Jul Sep Nov Jan Mar May Jul Sep Nov Jan Mar May Jul Sep Nov Jan Mar May Jul Sep Nov
        08 08 08 08 09 09 09 09 09 09 10 10 10 10 10 10 11 11 11 11 11 11 12 12 12 12 12 12

                                                                      Source: Flurry Analytics, May 2008 – November 2012, Billions
A Global Phenomenon
Top Countries by Active iOS & Android Devices (millions)
 181
         167


                 35      28       27         22       19           19            14            14

  US     China   UK     Japan   S. Korea   Germany   France     Canada          Brazil        Spain

                                                         Source: Flurry Analytics active devices Oct 2012
30+ Countries Doubled in Last 12 Months
Fastest Growing iOS & Android Markets by Active Devices

293%
         269%      260%
                               235%
                                             209%          202%           197%
                                                                                        181%          180%           180%


 China   Vietnam   Colombia      Chile        Ukraine      Venezuela       Turkey      Philippines      Egypt         Russia

                         Source: Flurry Analytics, Oct 2011 – Oct 2012, countries with at least 500k active devices as of Oct 2011
How Mobile Stacks Up Against TV and The Web

U.S. Web vs. Mobile App vs. TV Consumption, Minutes per Day
  180

  160

  140                   162                     168                                      168
  120

  100
                                                                              127
  80
                                      94
  60

  40
        70    66              72                                    70
  20

   -
             Dec 2010               Dec 2011                                Dec 2012

               Web Browsing        Mobile Applications                         Television

                                   Sources: comScore, Alexa, U.S. Bureau of Labor Statistics, Flurry Analytics
App Revenue Is Scaling

           20
Billions


           18
           16
           14
           12
           10
           8
           6
           4
           2
           0
                2008   2009             2010      2011               2012

                        Virtual Goods          Advertising

                                                 Source: eMarketer, Mary Meeker (KPCB)
Faster Revenue Ramp than The Web
           Daypart comparison, people 15+ using medium, U.S.
            16
Billions


            14

            12

            10

             8

             6

             4

             2

             0
                 1996 1997 1998 1999 2000 2001 2002 2003 2004 2005 2006 2007 2008 2009 2010 2011 2012


                                                                           Source: eMarketer, Flurry, Comscore
Beyond Gaming
WW iOS & Android Smart Device Time Spent per App Category
                             Lifestyle 1%
                Health & Fitness 1%
                Productivity 2%           Other
                 News 2%                   5%

                         Utilities
                          10%
                                                  Games
                                                   43%
                      Entertainment
                          10%


                              Social Networking
                                     26%


                                                      Source: Flurry Analytics, November 2012
Disruption Across Multiple Industries
WW Session in iOS and Android Apps (Dec 2011 – Dec 2012)
  387%


              268%
                            247%        237%
                                                      206%               198%
                                                                                             132%

                                                                                            107%


   Social     Media &       Shopping   Productivity   Utilities           Travel            Gaming
            Entertainment

                                                                  Source: Flurry Analytics Dec 2011- Dec 2012
Gaming: Money, Midcore and Maturity
ARPDAU among top 1,000 grossing iOS free-to-play games

    Over $0.75, 3%


                                            Over $0.75,
     $0.25 - $0.75                             15%
         15%

                                                                   Under $0.25,
                                                                      53%
                                       $0.25 - $0.75
                      Under $0.25,
                                           32%
                         82%


                Sep 2011                            Sep 2012

                                                 Source: Flurry Analytics, 480 free-to-play games
A Closer Look at the Social Category
Distribution of time spent in mobile social apps

                                     Dating
                                      5%


                        Photo & Video
                          Sharing
                            19%
                                              Social Networks
                                                   47%


                         Messaging
                           29%


                                                        Source: comScore, Flurry Analytics Dec 2012
A Closer Look at Media & Entertainment Apps
Distribution of time spent in media apps


                                 Others
                                  10%
                                                   Networks
                                                     22%


                     Emerging Media
                         37%
                                                         Studios
                                                          20%
                                           2nd
                                          Screen
                                           Apps
                                           11%
Media & Entertainment Apps Behave Like TV
                Daypart comparison, people 15+ using medium, U.S.
                      70%
% of Audience Share


                                       MEDIA APPS           TELEVISION
                      60%


                      50%


                      40%


                      30%


                      20%


                      10%


                      0%
                            5:00 AM AM AM AM AM AM AM PM PM PM PM PM PM PM PM PM PM PM PM AM AM AM AM AM
                                  6:00 7:00 8:00 9:00 10:00 11:00 12:00 1:00 2:00 3:00 4:00 5:00 6:00 7:00 8:00 9:00 10:00 11:00 12:00 1:00 2:00 3:00 4:00


                                                                                           Sources: Michael Zimbalist; Nielsen National People Meter; comScore Media Metrix Flurry
The Rise of the App & Mortar Economy
Distribution of time spent in commerce apps


                                    Others
                                     9%
                                                Retailers
                      Daily Deals                27%
                         13%


                      Price
                    Comparison
                       14%                      Online
                                              Marketplaces
                                 Purchase         20%
                                 Assistance
                                    17%


                                                        Source: comScore, Flurry Analytics Dec 2012
Shopping Apps: Usage by Gender

  MALES        FEMALES            19%

                                              16%
                                                    14%
                  13%                   13%

                            10%

          7%
 5%
                                                          2%
                                                                     1%

   13-17                 18-24      25-34       35-54          55+
                                                                Age Group
Shopping App Usage: Gender and Daypart
10%
           MALES          FEMALES
9%

8%

7%

6%

5%

4%

3%

2%

1%

0%
      5:00 AM AM AM AM AM 11:00 12:00 PM PM PM PM PM PM PM PM PM PM 11:00 12:00 AM AM AM AM AM
            6:00 7:00 8:00 9:00 10:00 AM AM 1:00 2:00 3:00 4:00 5:00 6:00 7:00 8:00 9:00 10:00 PM PM 1:00 2:00 3:00 4:00
Flurry: Mobile Outlook 2013

Flurry: Mobile Outlook 2013

  • 2.
    Unstoppable Market Growth Worldwidein-application events measured by Flurry (billions) 1,200 1,100 1,000 900 800 700 600 500 400 300 200 100 - May Jul Sep Nov Jan Mar May Jul Sep Nov Jan Mar May Jul Sep Nov Jan Mar May Jul Sep Nov Jan Mar May Jul Sep Nov 08 08 08 08 09 09 09 09 09 09 10 10 10 10 10 10 11 11 11 11 11 11 12 12 12 12 12 12 Source: Flurry Analytics, May 2008 – November 2012, Billions
  • 3.
    A Global Phenomenon TopCountries by Active iOS & Android Devices (millions) 181 167 35 28 27 22 19 19 14 14 US China UK Japan S. Korea Germany France Canada Brazil Spain Source: Flurry Analytics active devices Oct 2012
  • 4.
    30+ Countries Doubledin Last 12 Months Fastest Growing iOS & Android Markets by Active Devices 293% 269% 260% 235% 209% 202% 197% 181% 180% 180% China Vietnam Colombia Chile Ukraine Venezuela Turkey Philippines Egypt Russia Source: Flurry Analytics, Oct 2011 – Oct 2012, countries with at least 500k active devices as of Oct 2011
  • 5.
    How Mobile StacksUp Against TV and The Web U.S. Web vs. Mobile App vs. TV Consumption, Minutes per Day 180 160 140 162 168 168 120 100 127 80 94 60 40 70 66 72 70 20 - Dec 2010 Dec 2011 Dec 2012 Web Browsing Mobile Applications Television Sources: comScore, Alexa, U.S. Bureau of Labor Statistics, Flurry Analytics
  • 6.
    App Revenue IsScaling 20 Billions 18 16 14 12 10 8 6 4 2 0 2008 2009 2010 2011 2012 Virtual Goods Advertising Source: eMarketer, Mary Meeker (KPCB)
  • 7.
    Faster Revenue Rampthan The Web Daypart comparison, people 15+ using medium, U.S. 16 Billions 14 12 10 8 6 4 2 0 1996 1997 1998 1999 2000 2001 2002 2003 2004 2005 2006 2007 2008 2009 2010 2011 2012 Source: eMarketer, Flurry, Comscore
  • 8.
    Beyond Gaming WW iOS& Android Smart Device Time Spent per App Category Lifestyle 1% Health & Fitness 1% Productivity 2% Other News 2% 5% Utilities 10% Games 43% Entertainment 10% Social Networking 26% Source: Flurry Analytics, November 2012
  • 9.
    Disruption Across MultipleIndustries WW Session in iOS and Android Apps (Dec 2011 – Dec 2012) 387% 268% 247% 237% 206% 198% 132% 107% Social Media & Shopping Productivity Utilities Travel Gaming Entertainment Source: Flurry Analytics Dec 2011- Dec 2012
  • 10.
    Gaming: Money, Midcoreand Maturity ARPDAU among top 1,000 grossing iOS free-to-play games Over $0.75, 3% Over $0.75, $0.25 - $0.75 15% 15% Under $0.25, 53% $0.25 - $0.75 Under $0.25, 32% 82% Sep 2011 Sep 2012 Source: Flurry Analytics, 480 free-to-play games
  • 11.
    A Closer Lookat the Social Category Distribution of time spent in mobile social apps Dating 5% Photo & Video Sharing 19% Social Networks 47% Messaging 29% Source: comScore, Flurry Analytics Dec 2012
  • 12.
    A Closer Lookat Media & Entertainment Apps Distribution of time spent in media apps Others 10% Networks 22% Emerging Media 37% Studios 20% 2nd Screen Apps 11%
  • 13.
    Media & EntertainmentApps Behave Like TV Daypart comparison, people 15+ using medium, U.S. 70% % of Audience Share MEDIA APPS TELEVISION 60% 50% 40% 30% 20% 10% 0% 5:00 AM AM AM AM AM AM AM PM PM PM PM PM PM PM PM PM PM PM PM AM AM AM AM AM 6:00 7:00 8:00 9:00 10:00 11:00 12:00 1:00 2:00 3:00 4:00 5:00 6:00 7:00 8:00 9:00 10:00 11:00 12:00 1:00 2:00 3:00 4:00 Sources: Michael Zimbalist; Nielsen National People Meter; comScore Media Metrix Flurry
  • 14.
    The Rise ofthe App & Mortar Economy Distribution of time spent in commerce apps Others 9% Retailers Daily Deals 27% 13% Price Comparison 14% Online Marketplaces Purchase 20% Assistance 17% Source: comScore, Flurry Analytics Dec 2012
  • 15.
    Shopping Apps: Usageby Gender MALES FEMALES 19% 16% 14% 13% 13% 10% 7% 5% 2% 1% 13-17 18-24 25-34 35-54 55+ Age Group
  • 16.
    Shopping App Usage:Gender and Daypart 10% MALES FEMALES 9% 8% 7% 6% 5% 4% 3% 2% 1% 0% 5:00 AM AM AM AM AM 11:00 12:00 PM PM PM PM PM PM PM PM PM PM 11:00 12:00 AM AM AM AM AM 6:00 7:00 8:00 9:00 10:00 AM AM 1:00 2:00 3:00 4:00 5:00 6:00 7:00 8:00 9:00 10:00 PM PM 1:00 2:00 3:00 4:00

Editor's Notes

  • #4 487 in Feb519 in March529 in April