Downloaded 107 times


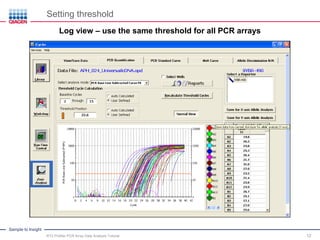

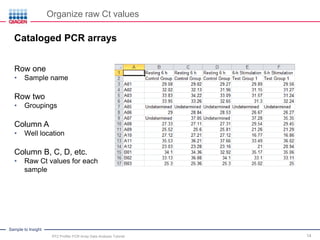
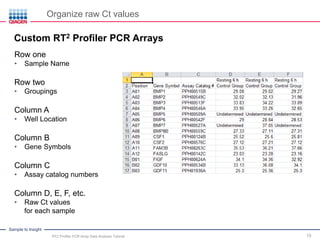


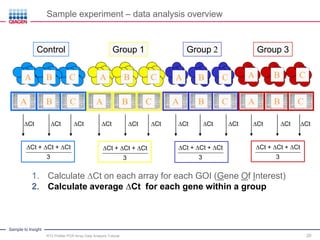
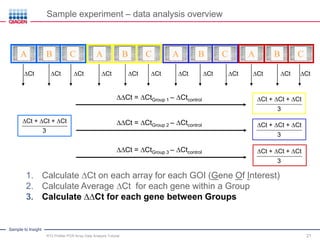
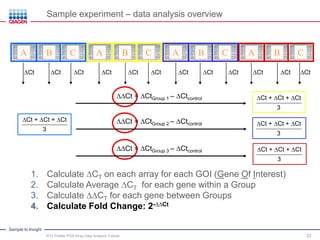
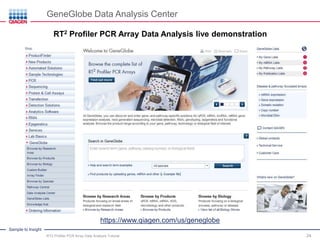

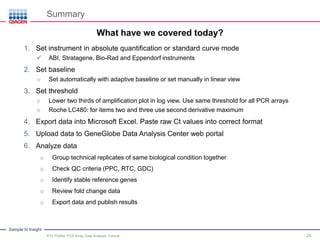
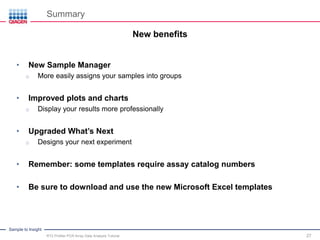


This webinar presentation provides an overview and tutorial on analyzing data from RT2 Profiler PCR Array experiments. It discusses organizing raw Ct value data, performing ΔCt and ΔΔCt calculations to analyze gene expression changes between sample groups, and using the GeneGlobe Data Analysis Center web portal to analyze the data. The webinar highlights new features of the Data Analysis Center including improved data visualization and an upgraded sample manager. It emphasizes following the standard protocol for setting baselines and thresholds when analyzing PCR array data.