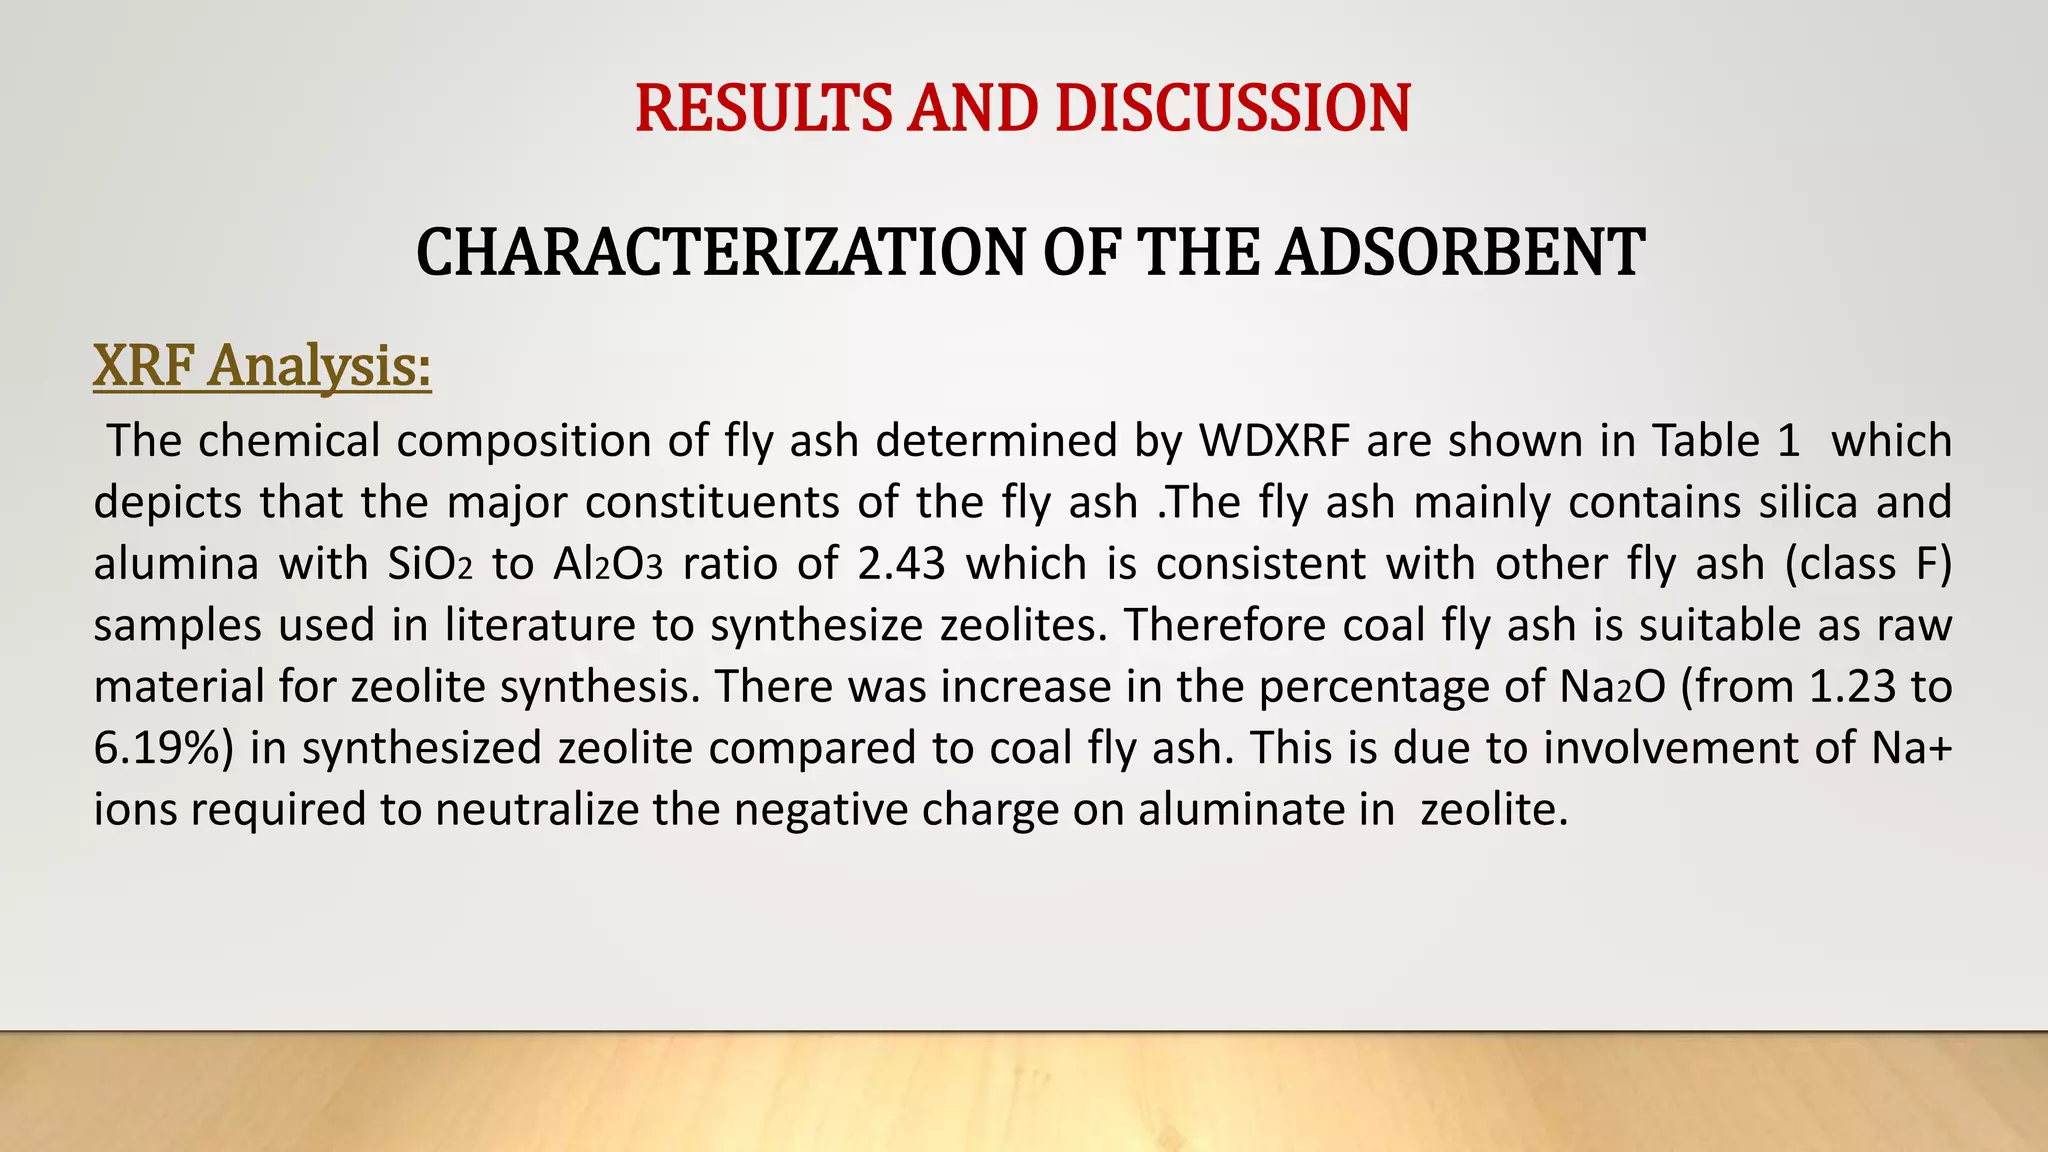
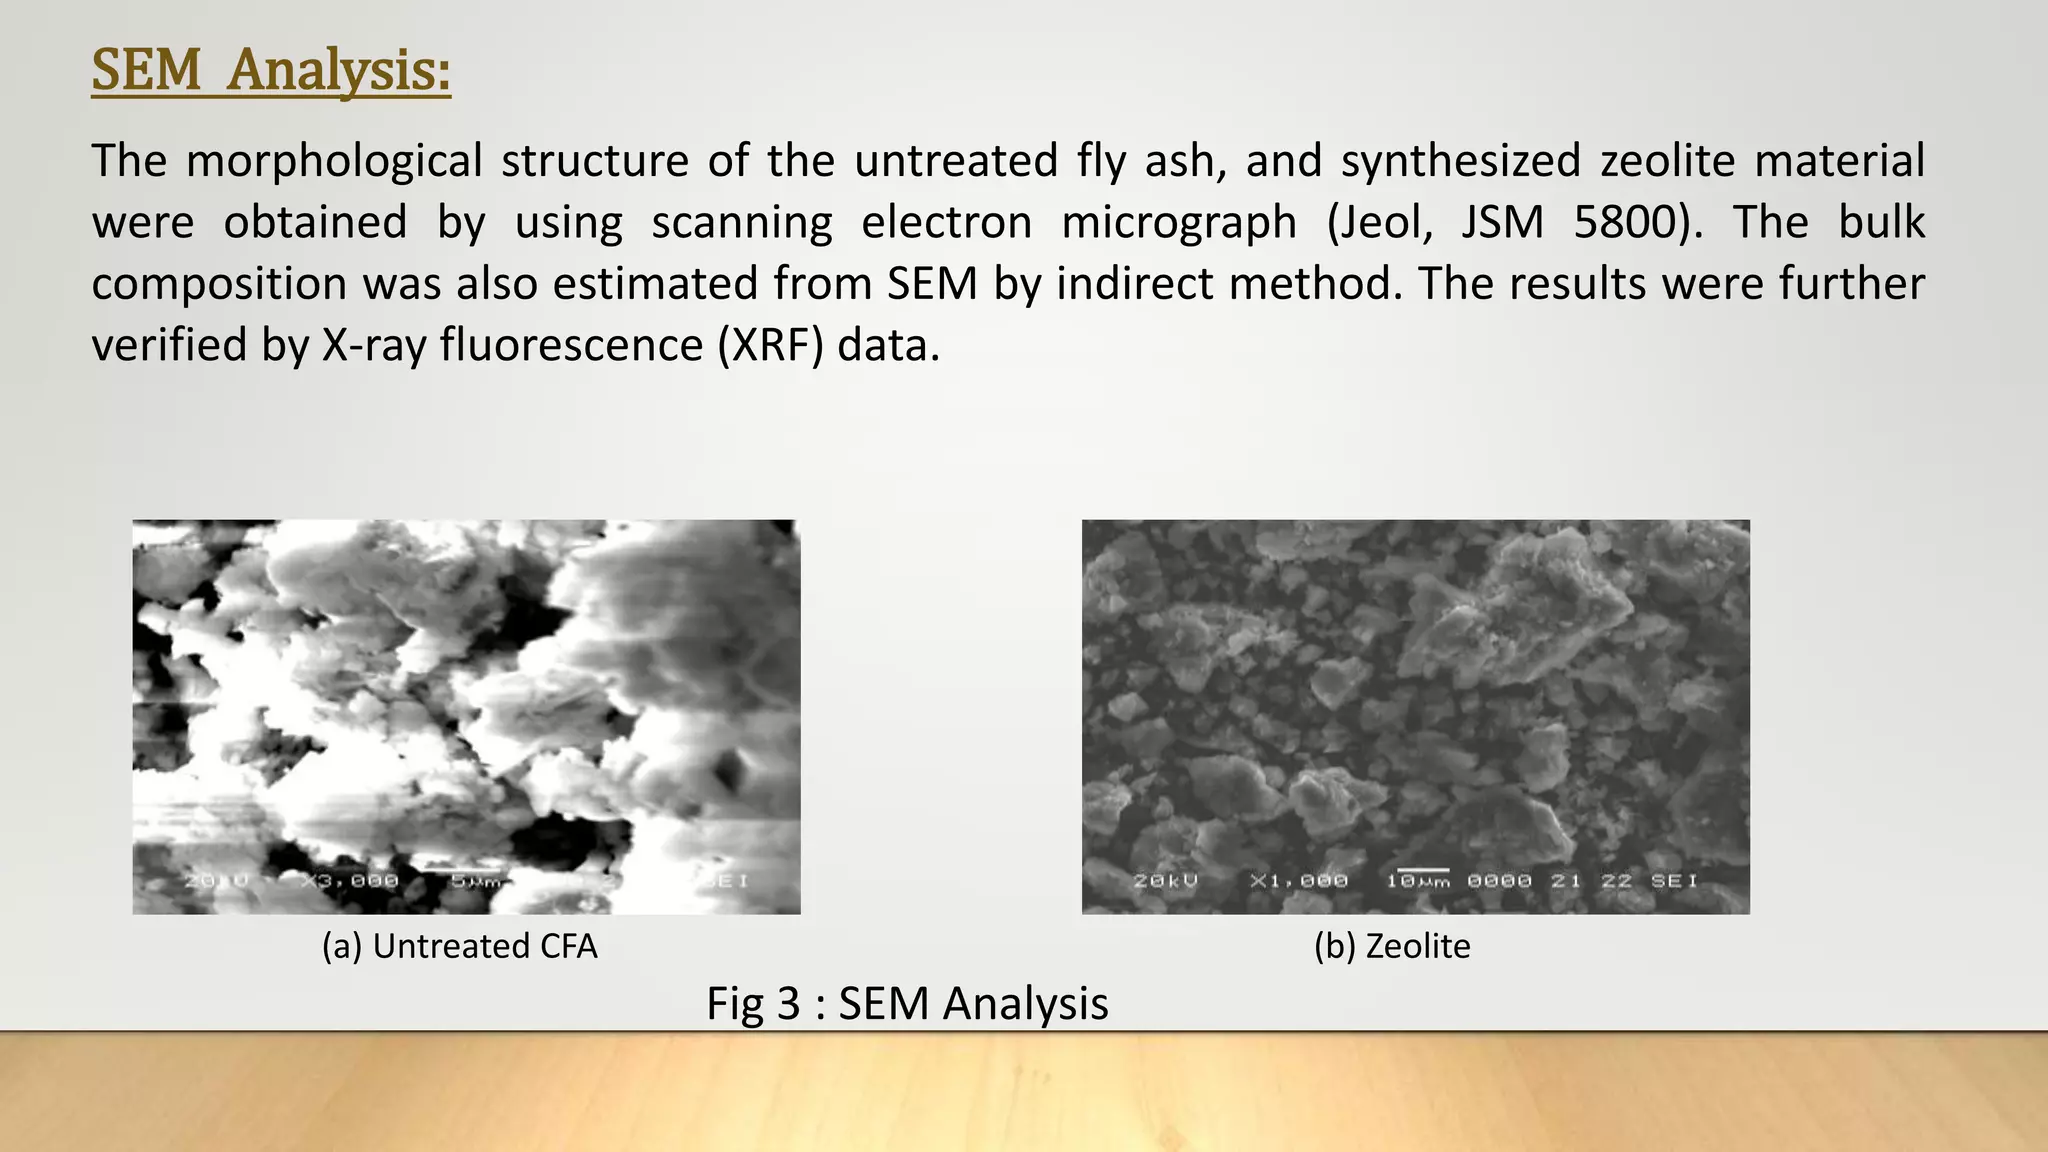
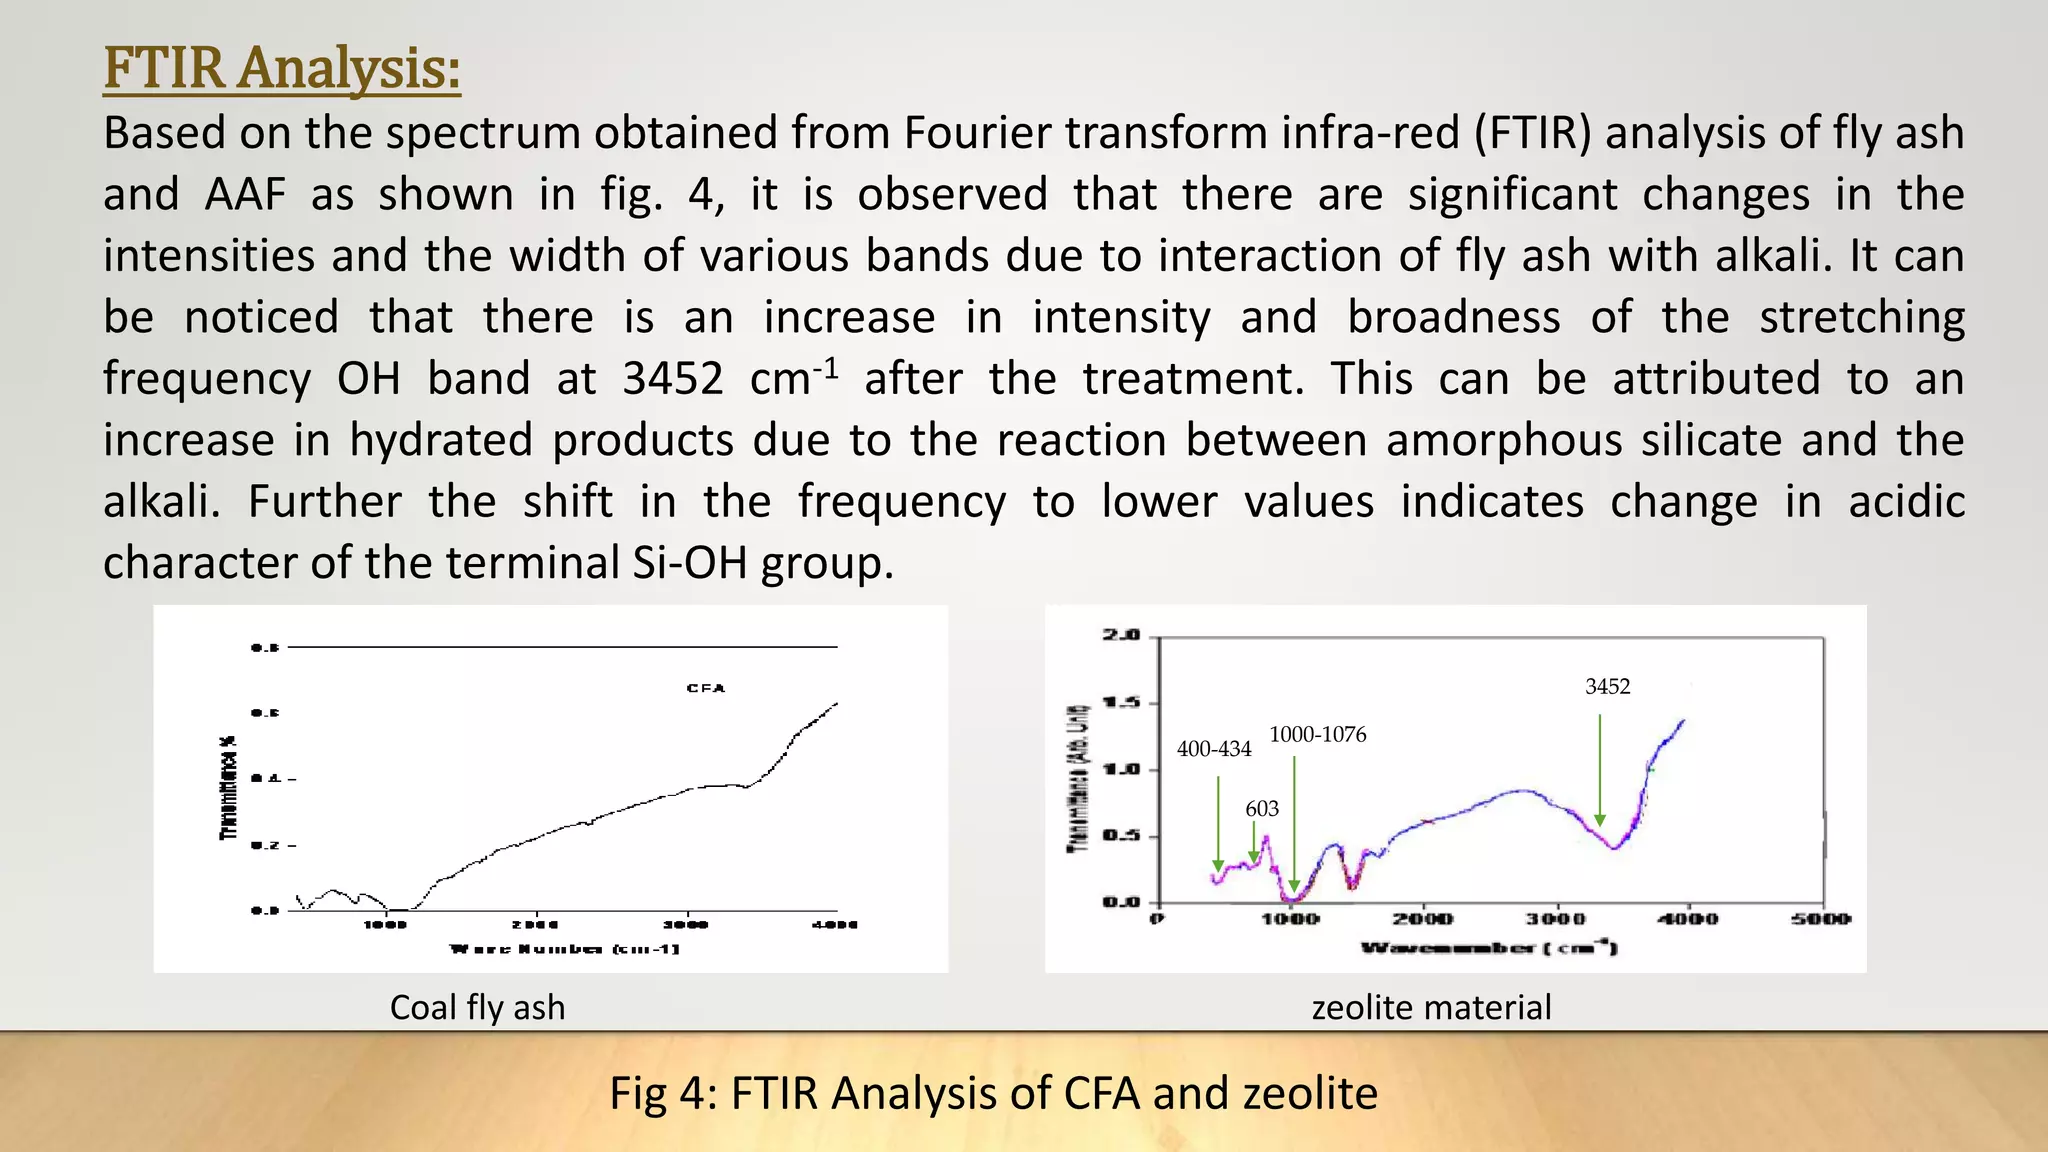
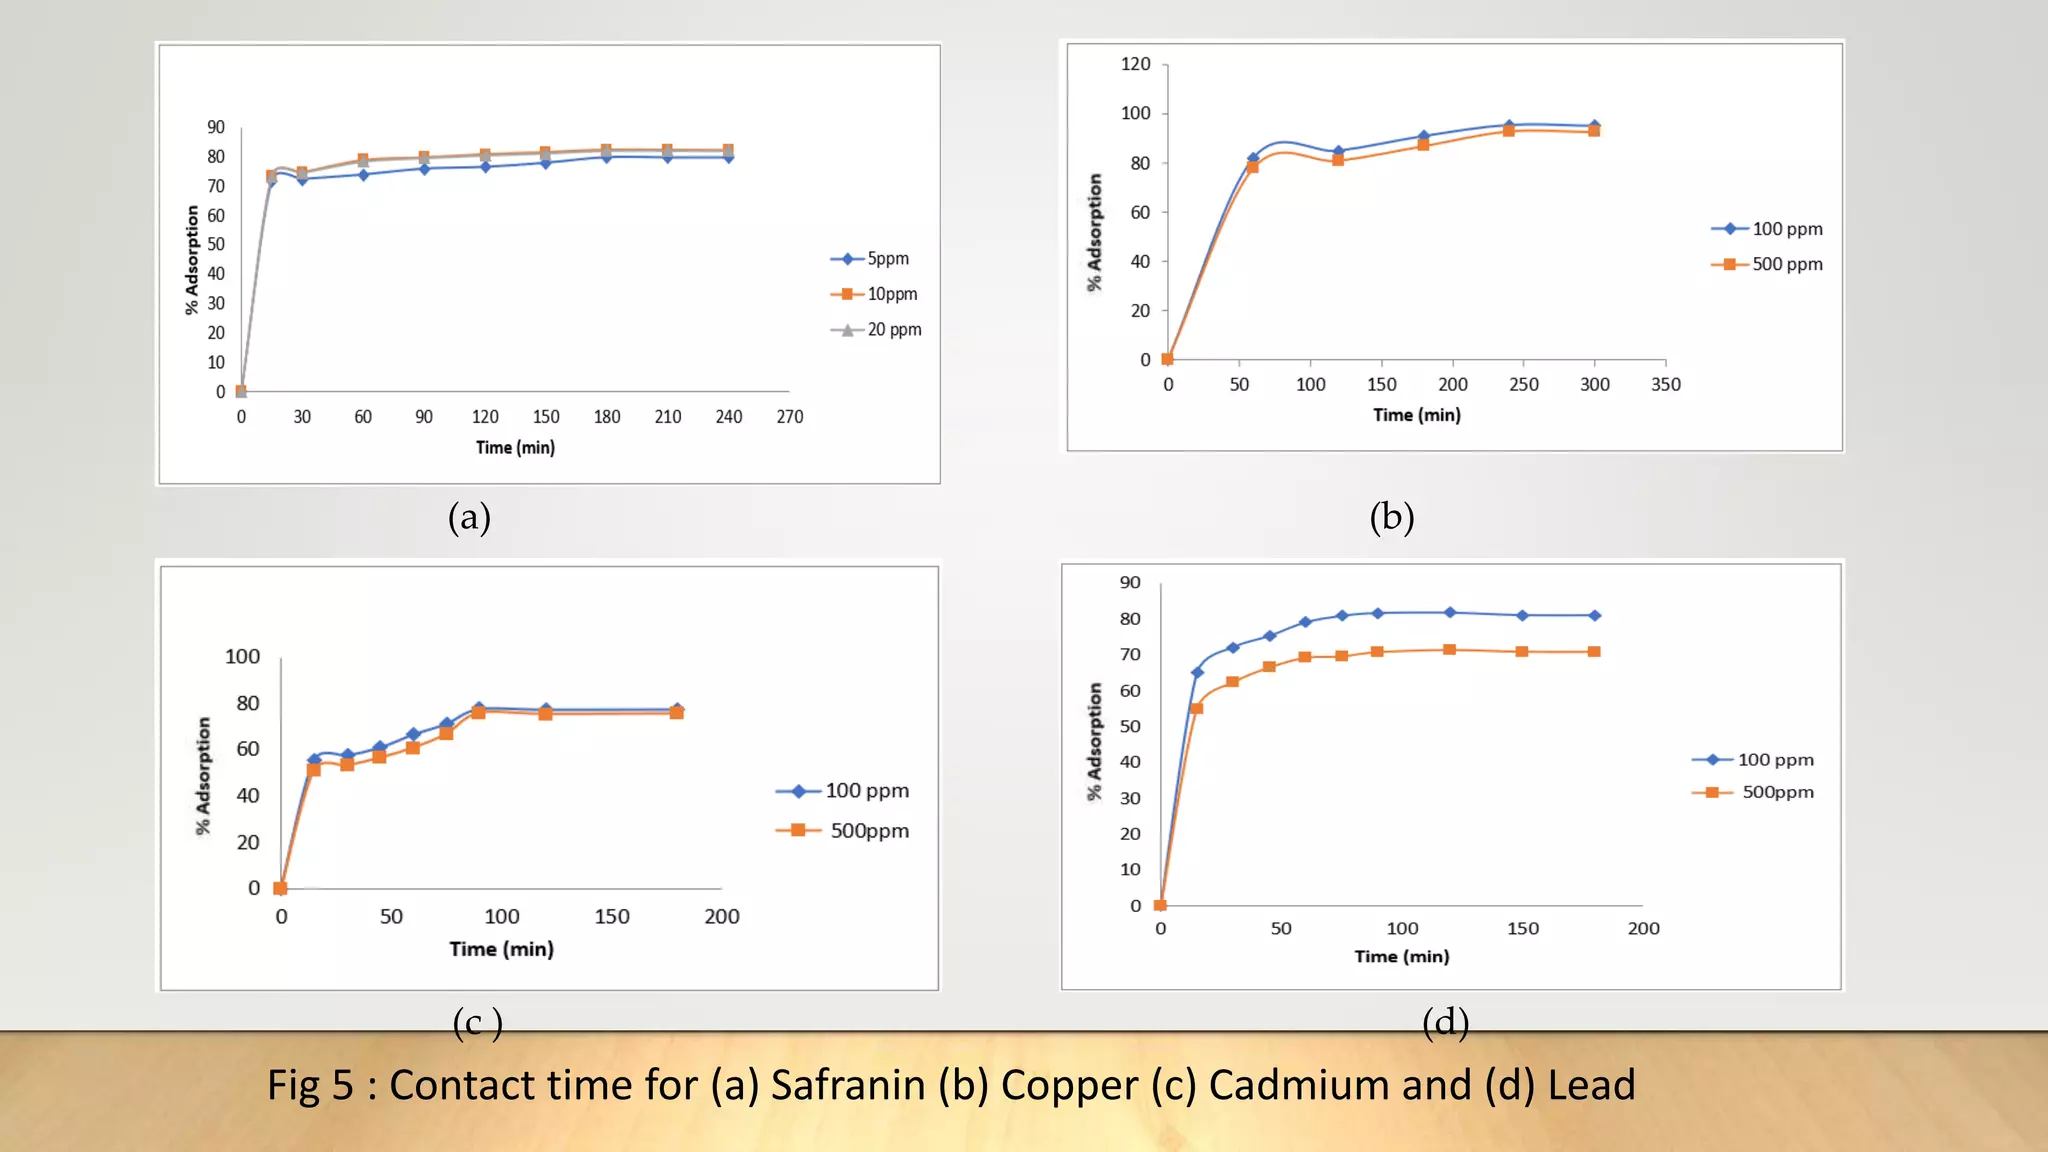
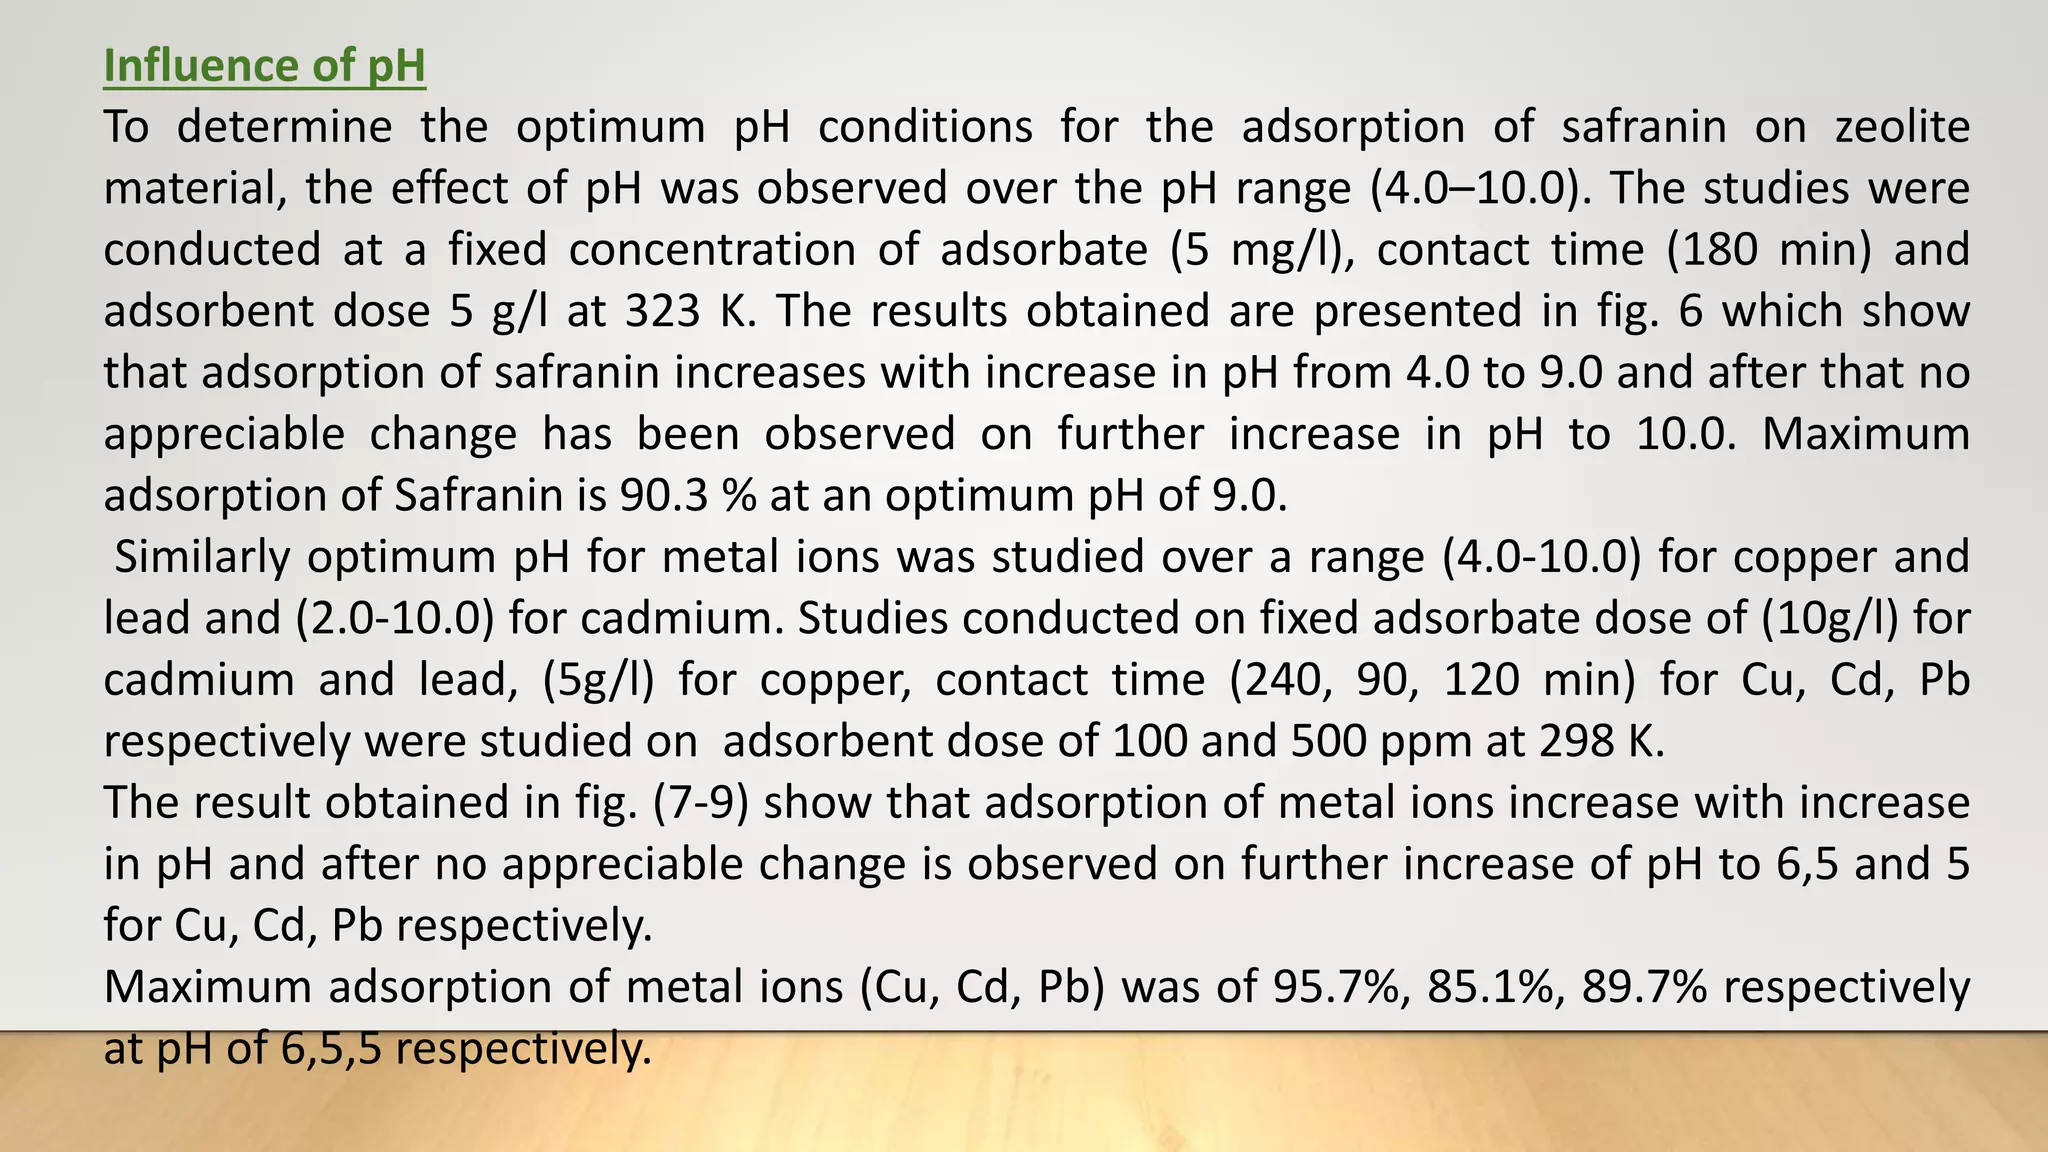
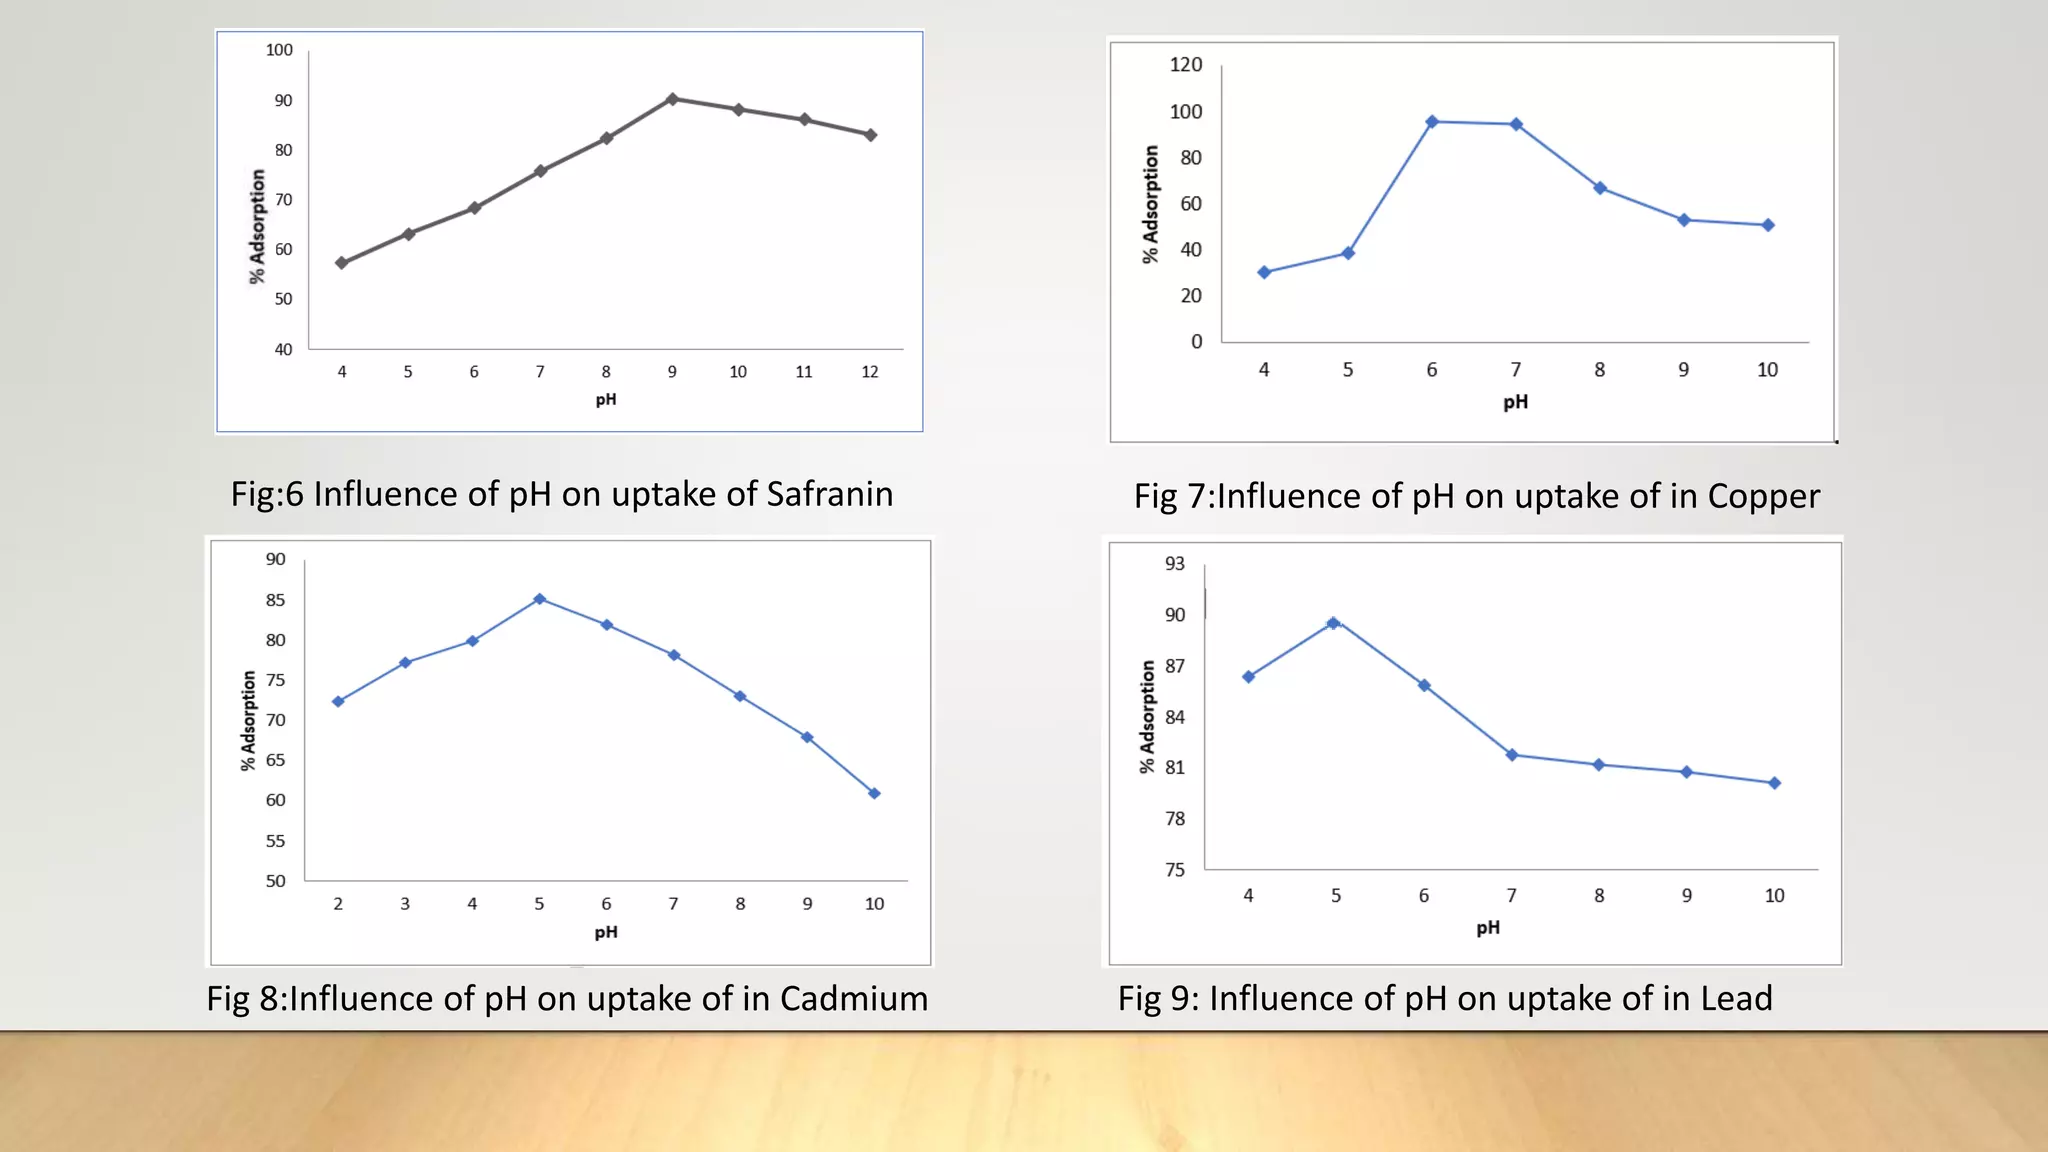
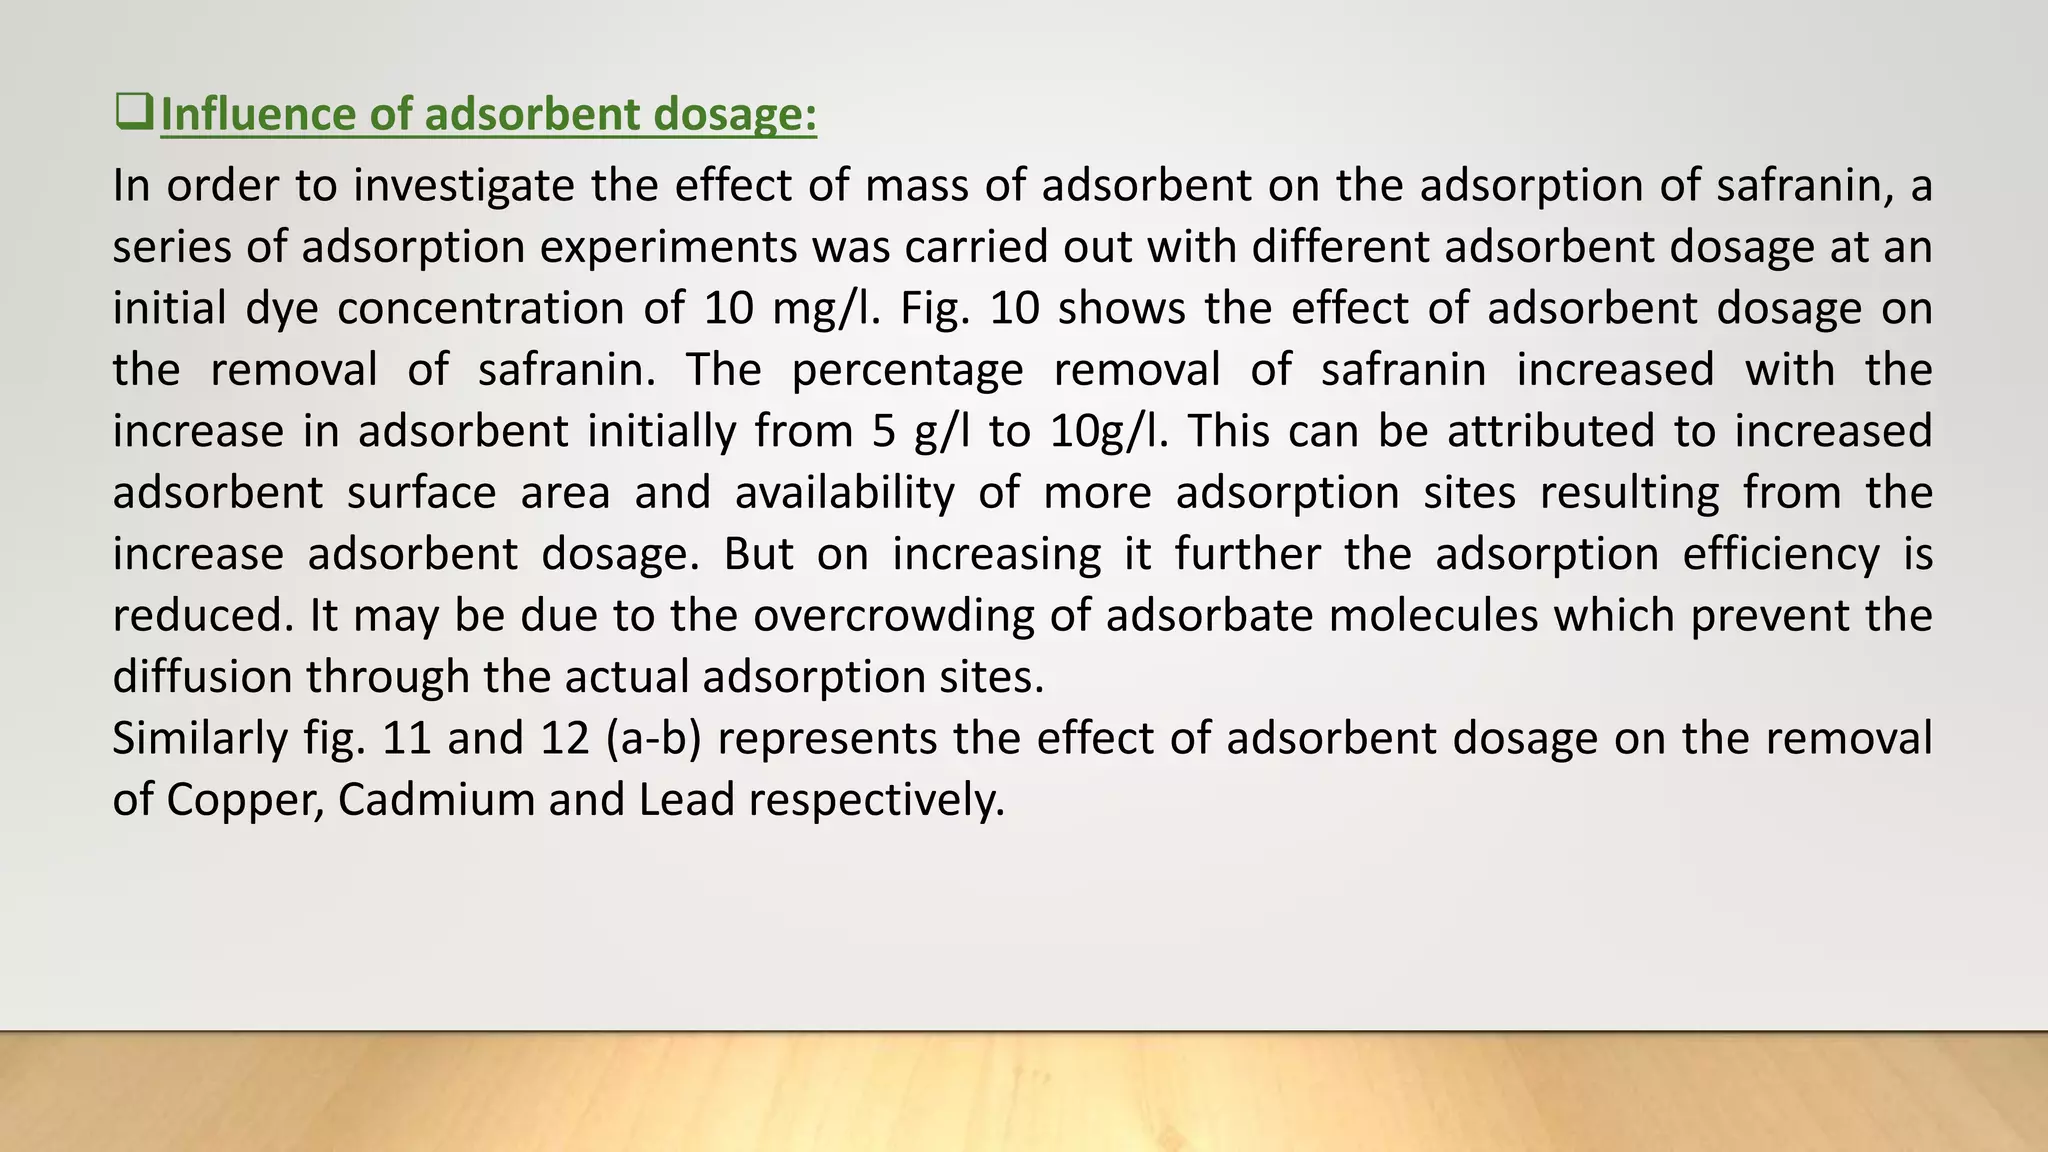
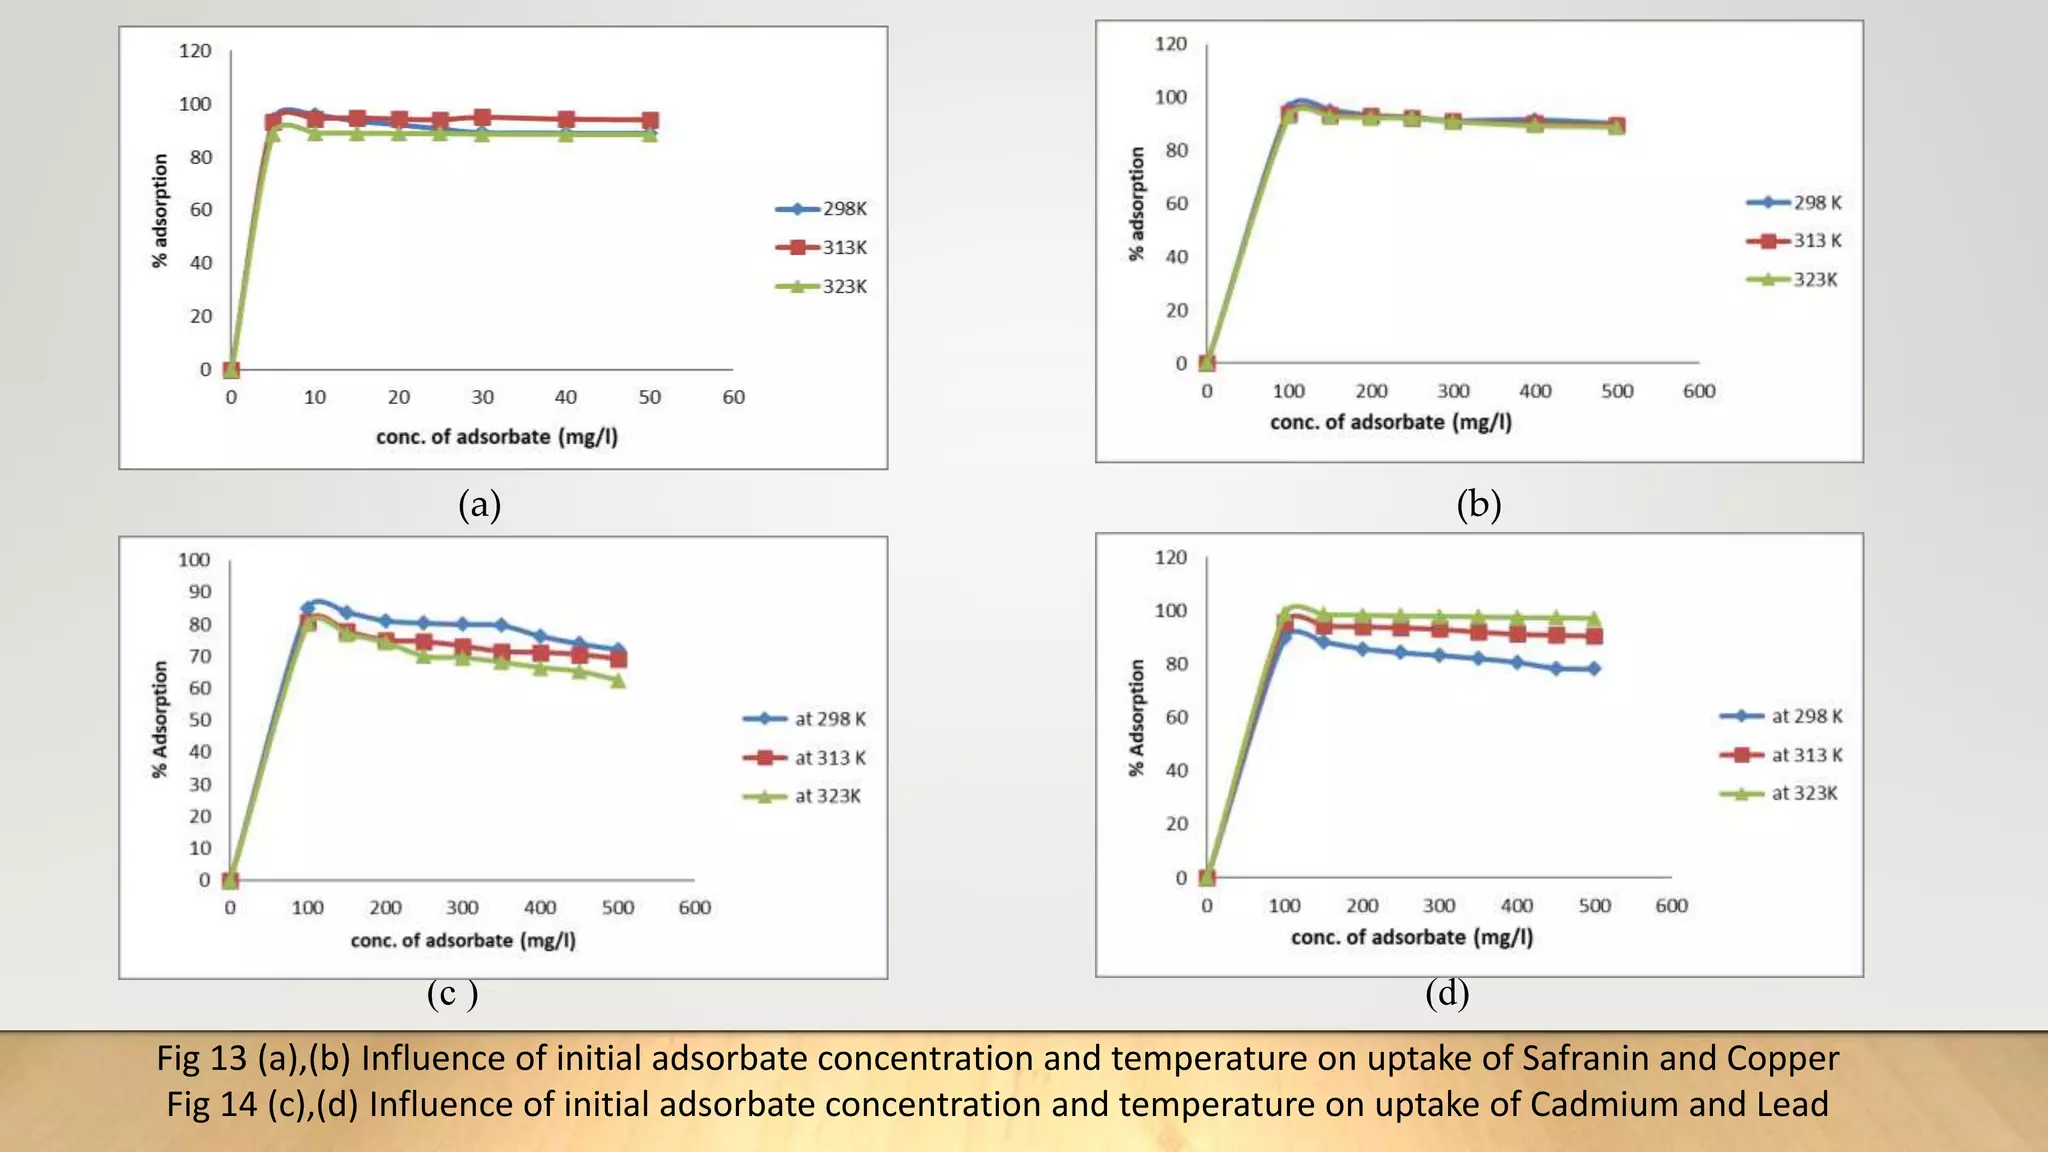
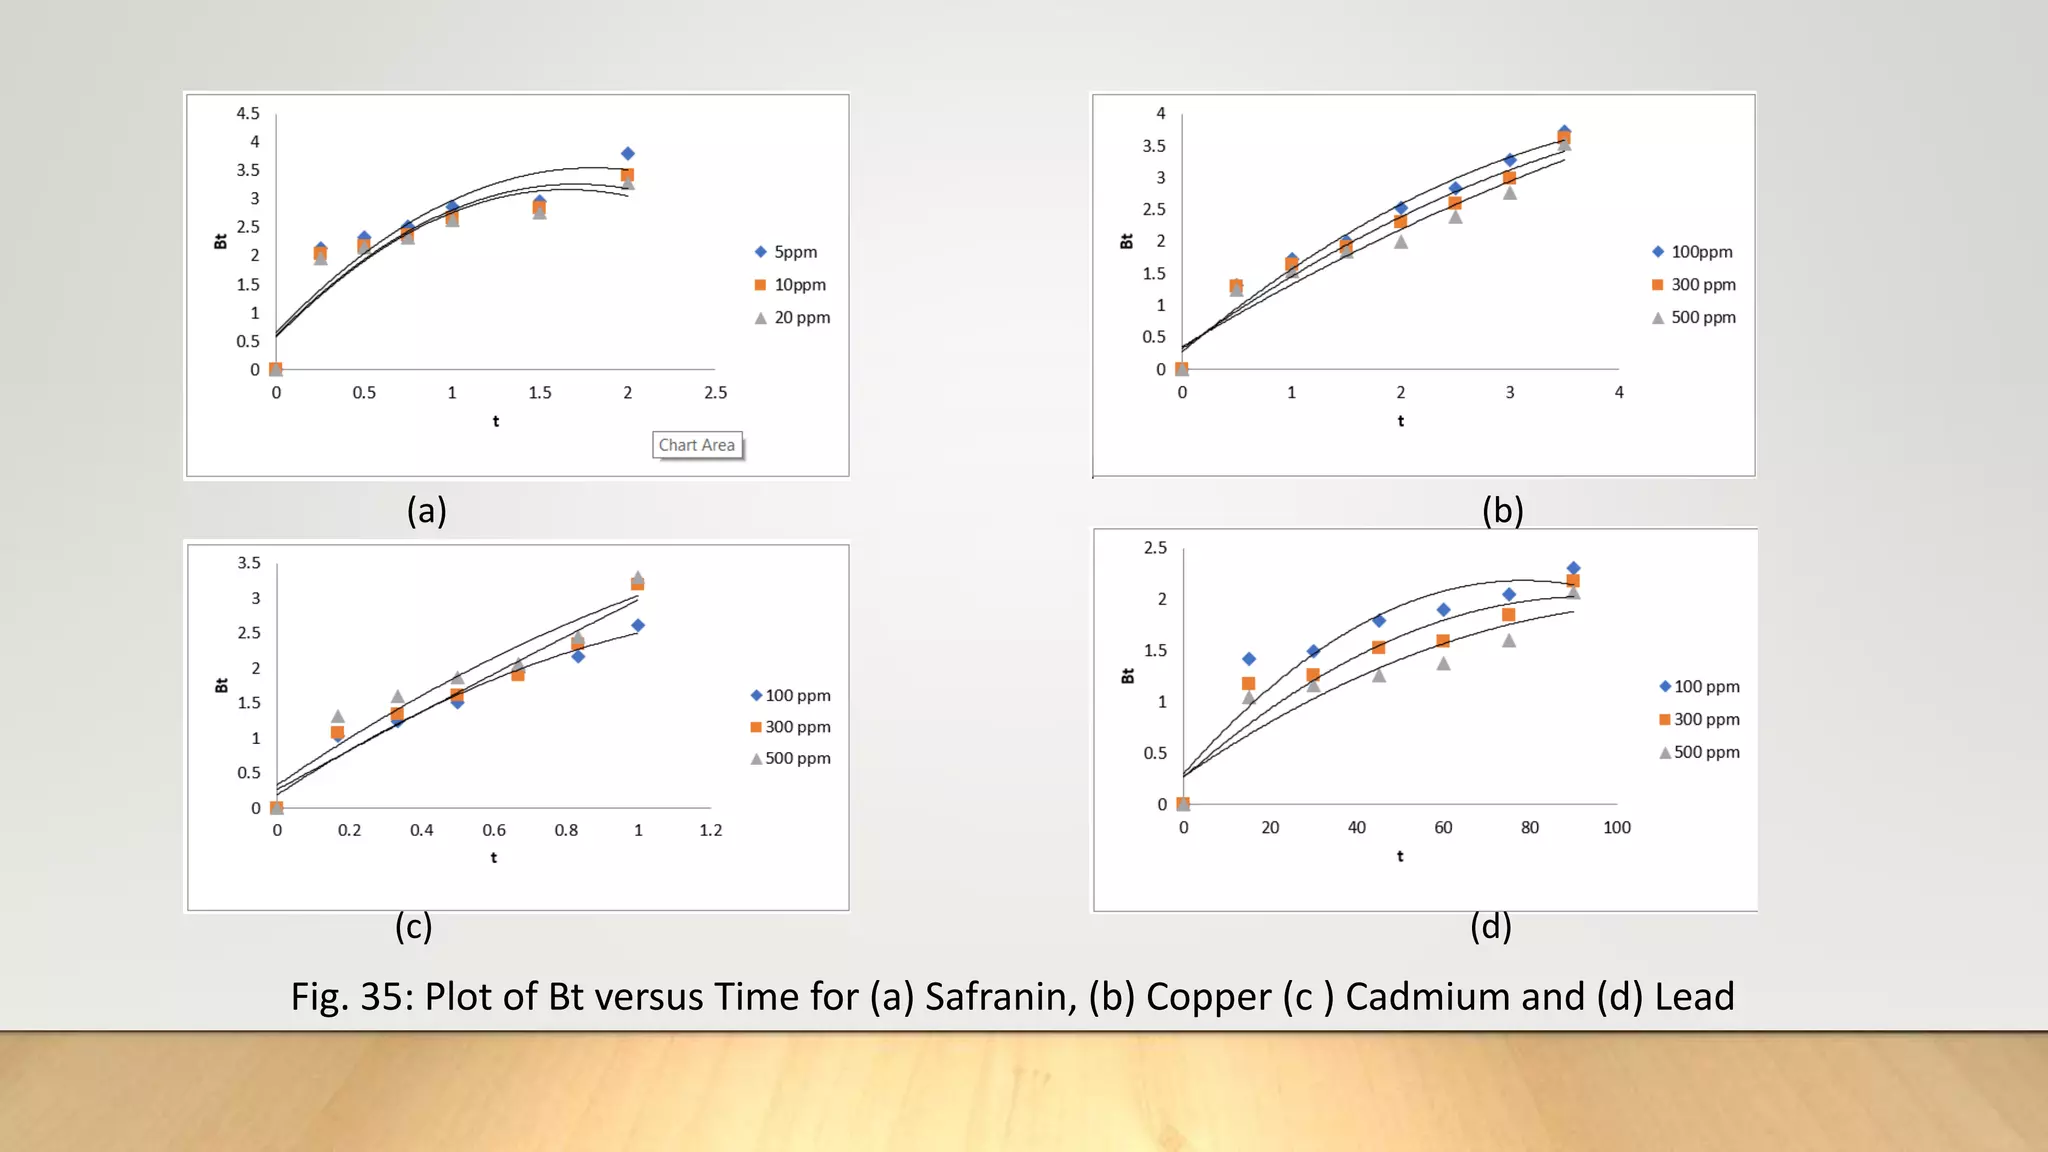
The document summarizes the synthesis and characterization of zeolite from coal fly ash and its application in removing inorganic and organic pollutants from wastewater. Key points:
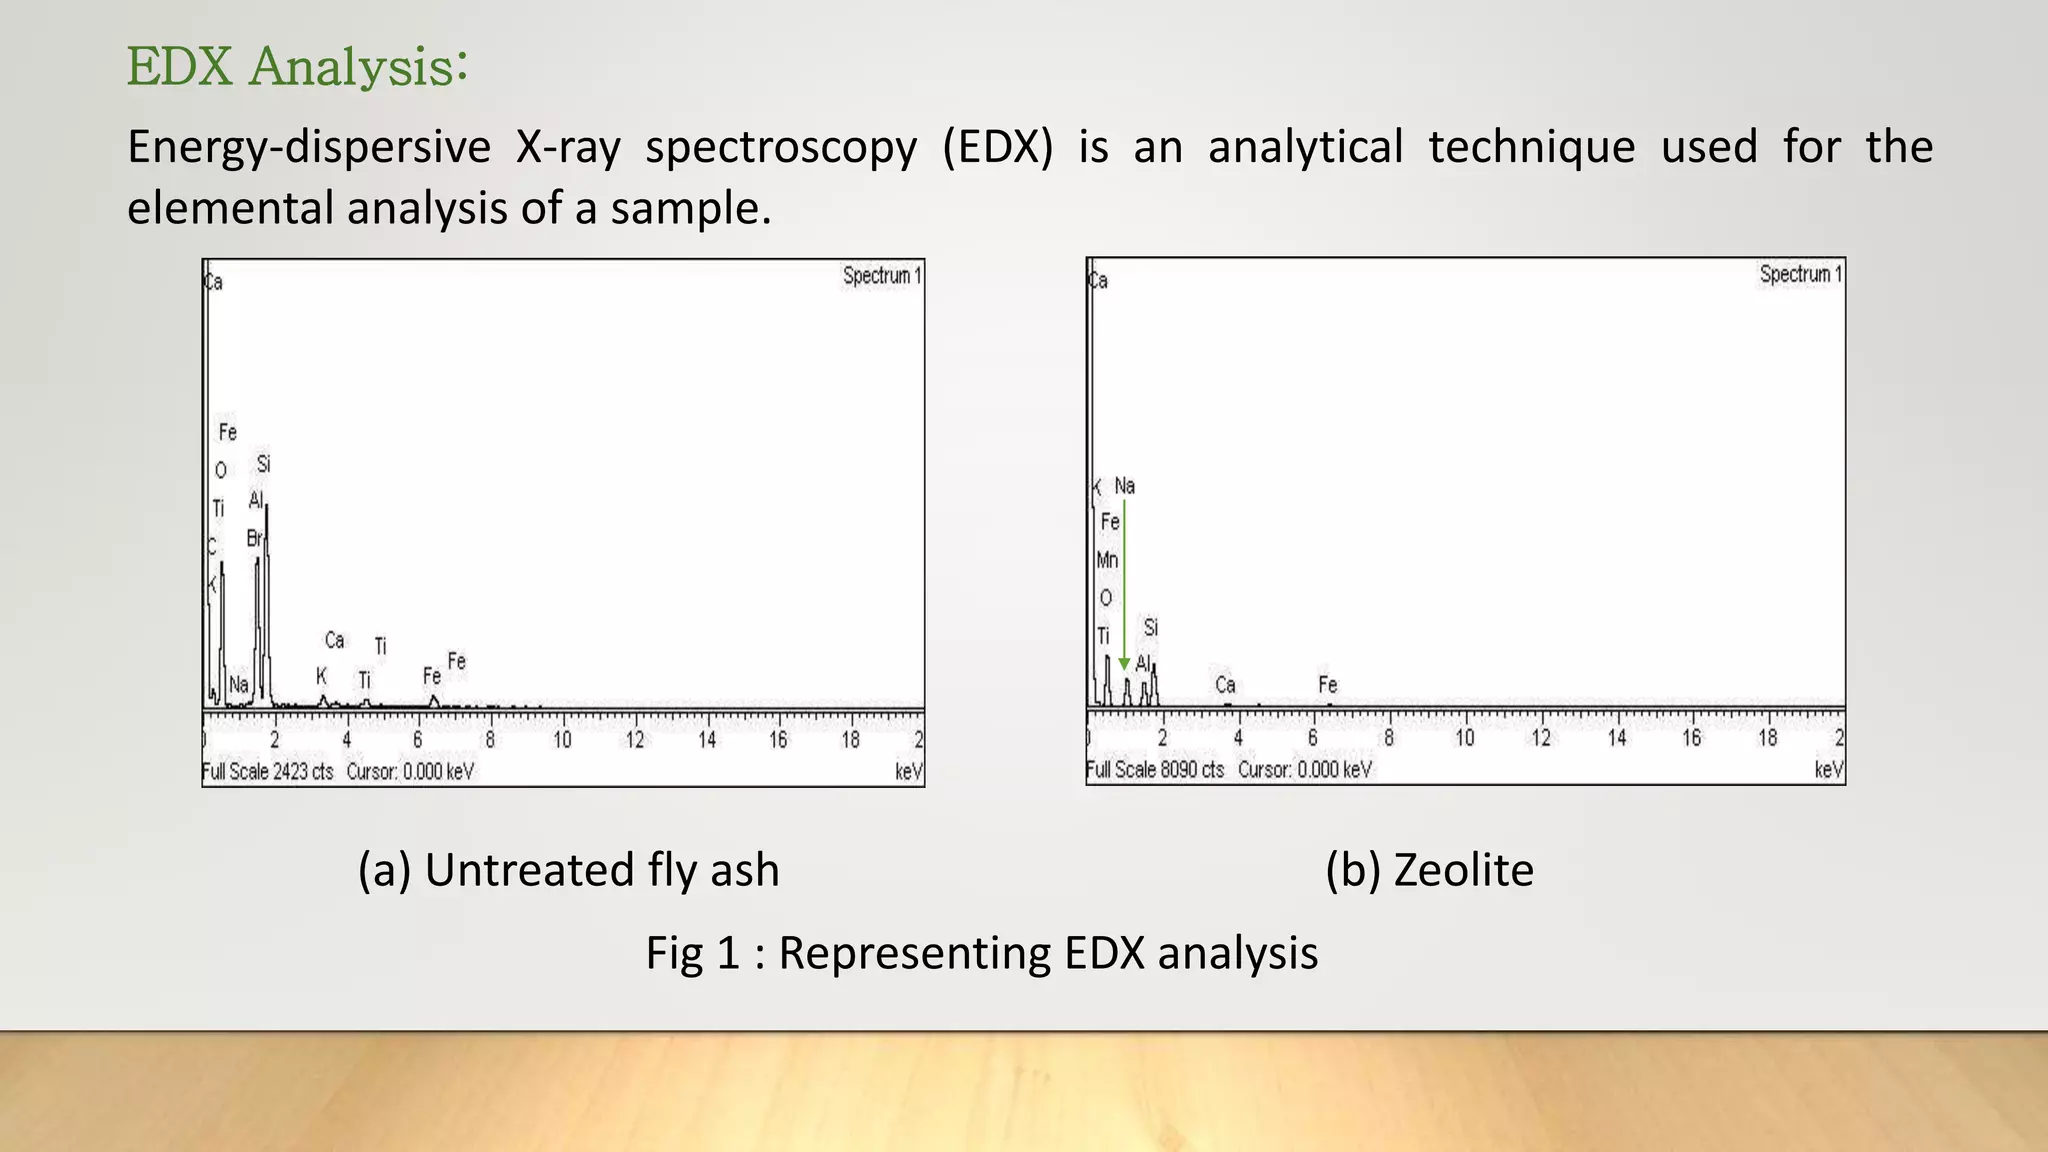
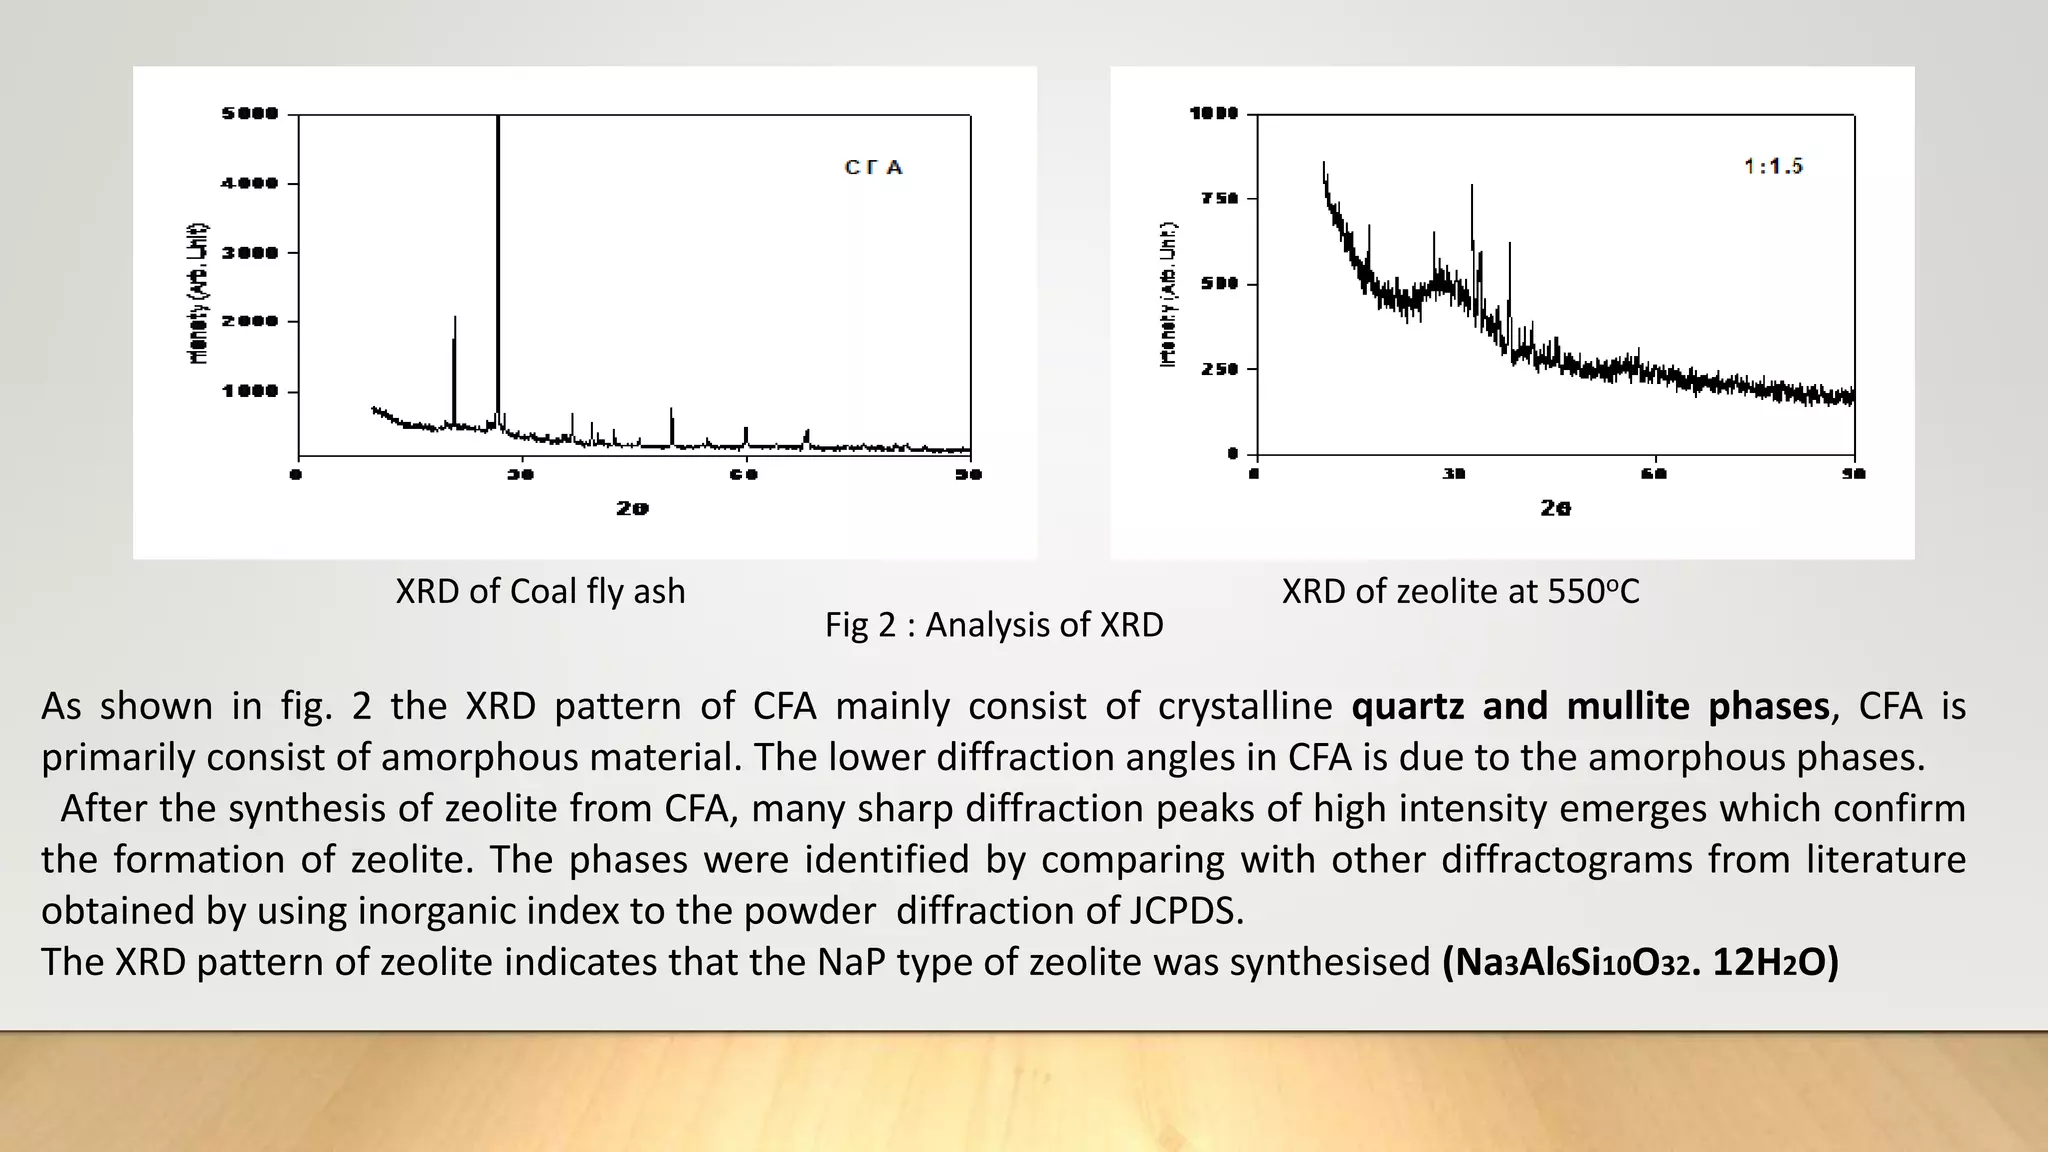
- Zeolite was synthesized from coal fly ash via an alkali fusion process followed by hydrothermal treatment. The synthesized zeolite was characterized using various techniques.
- Batch adsorption studies were conducted to investigate the ability of synthesized zeolite to remove heavy metals like copper, cadmium, lead and dye (safranin) from wastewater. Parameters like contact time, dose, pH and concentration were optimized.
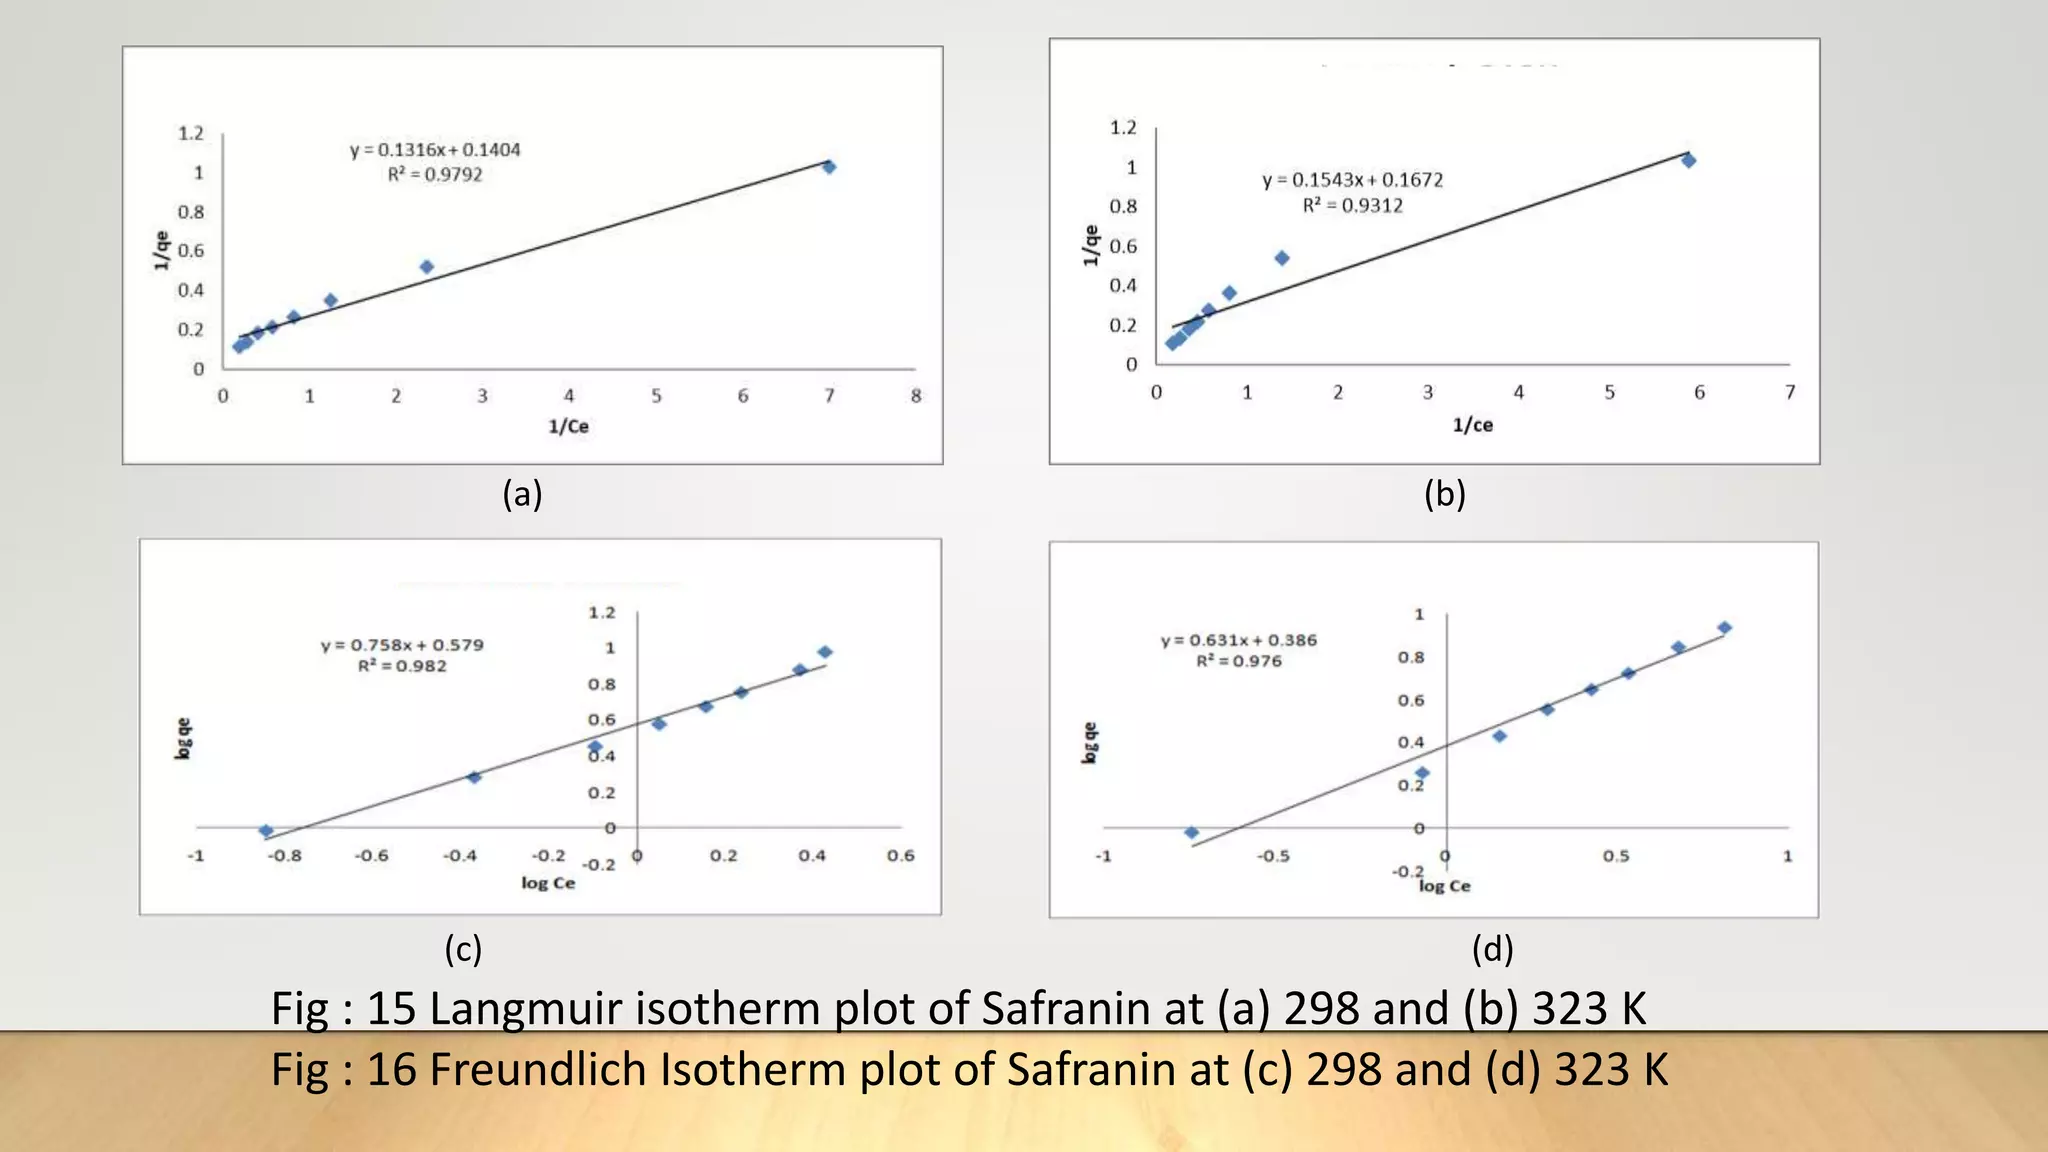
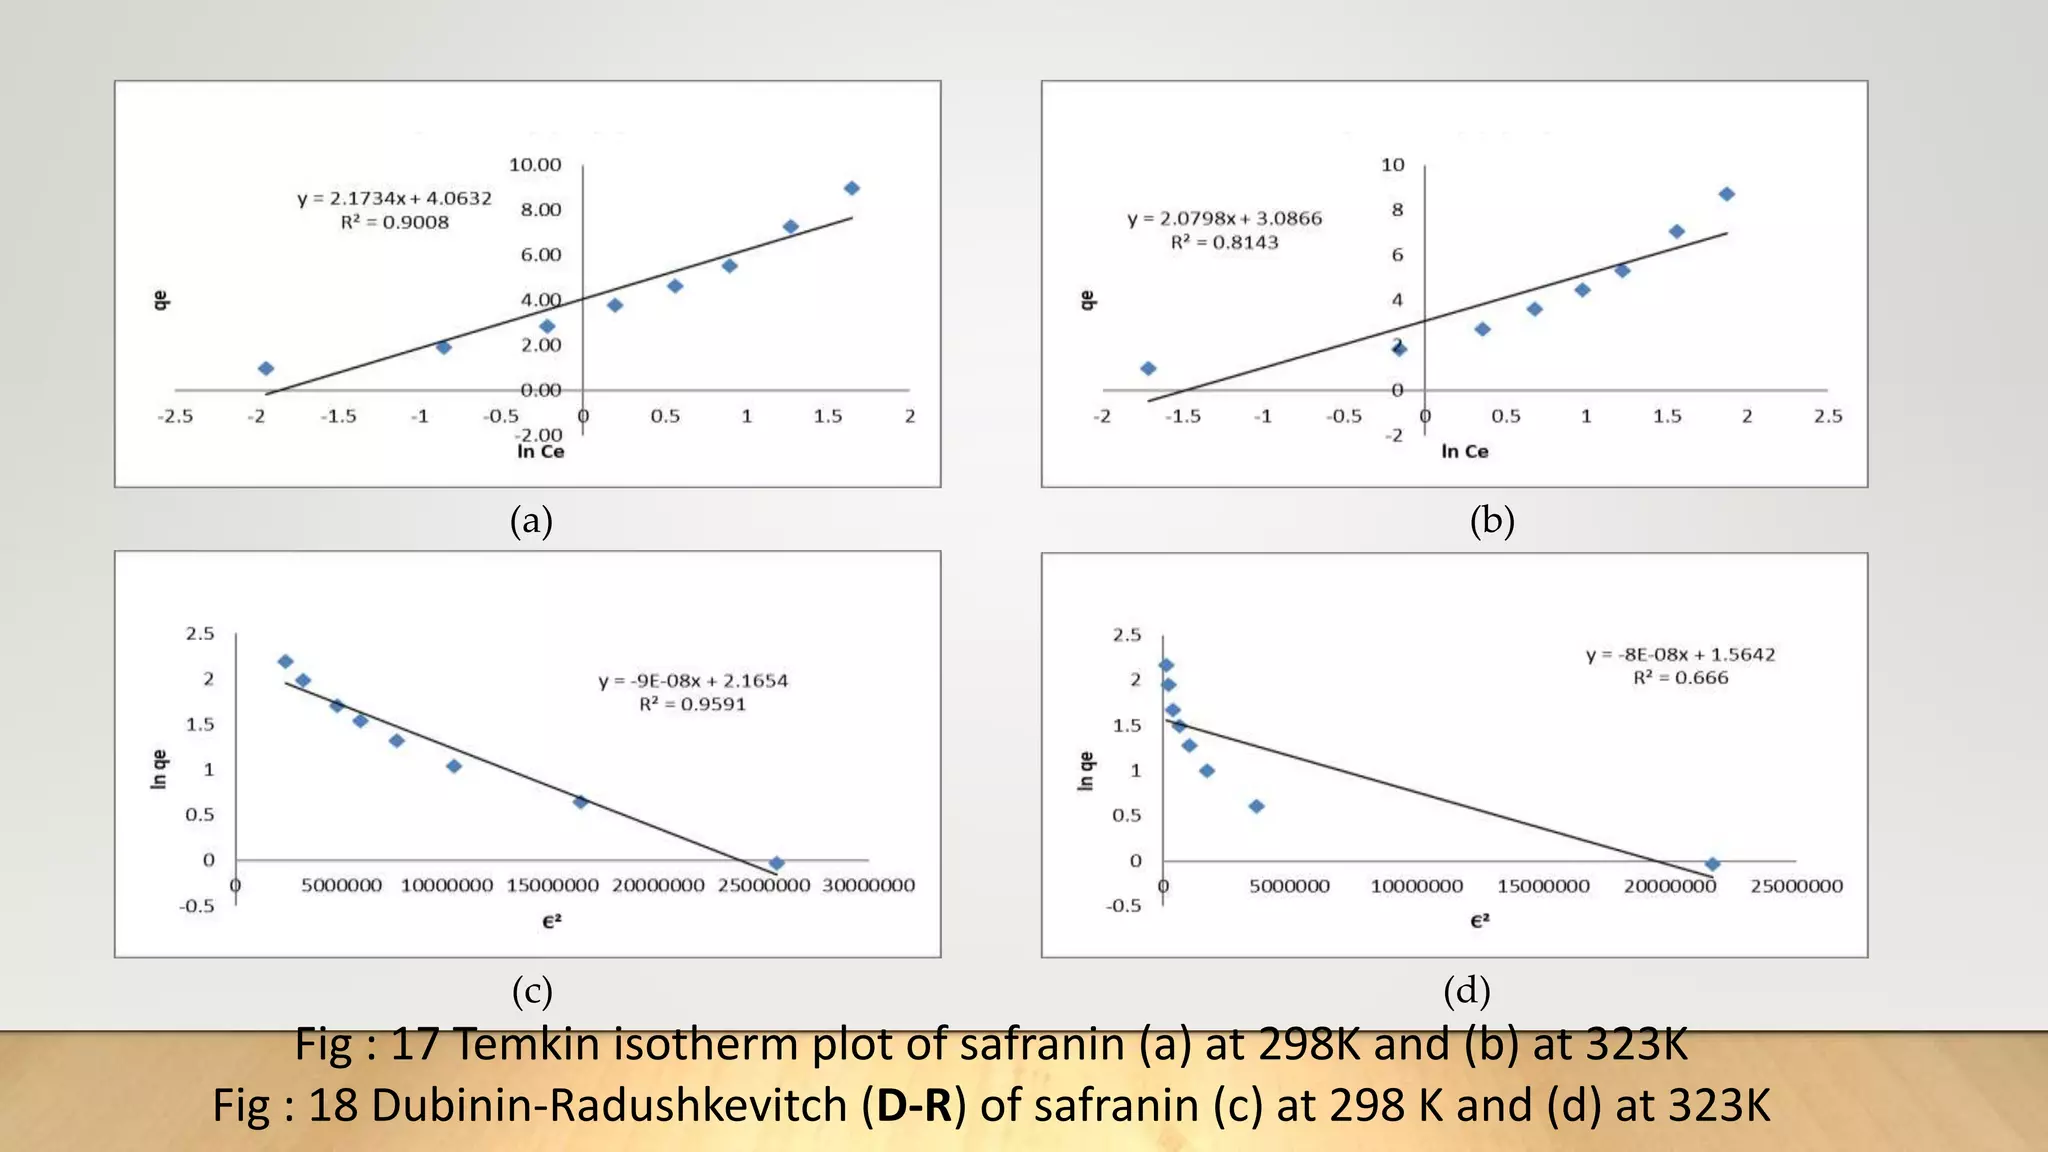
- Adsorption isotherm models like Langmuir, Freundlich, Tem
![INTRODUCTION
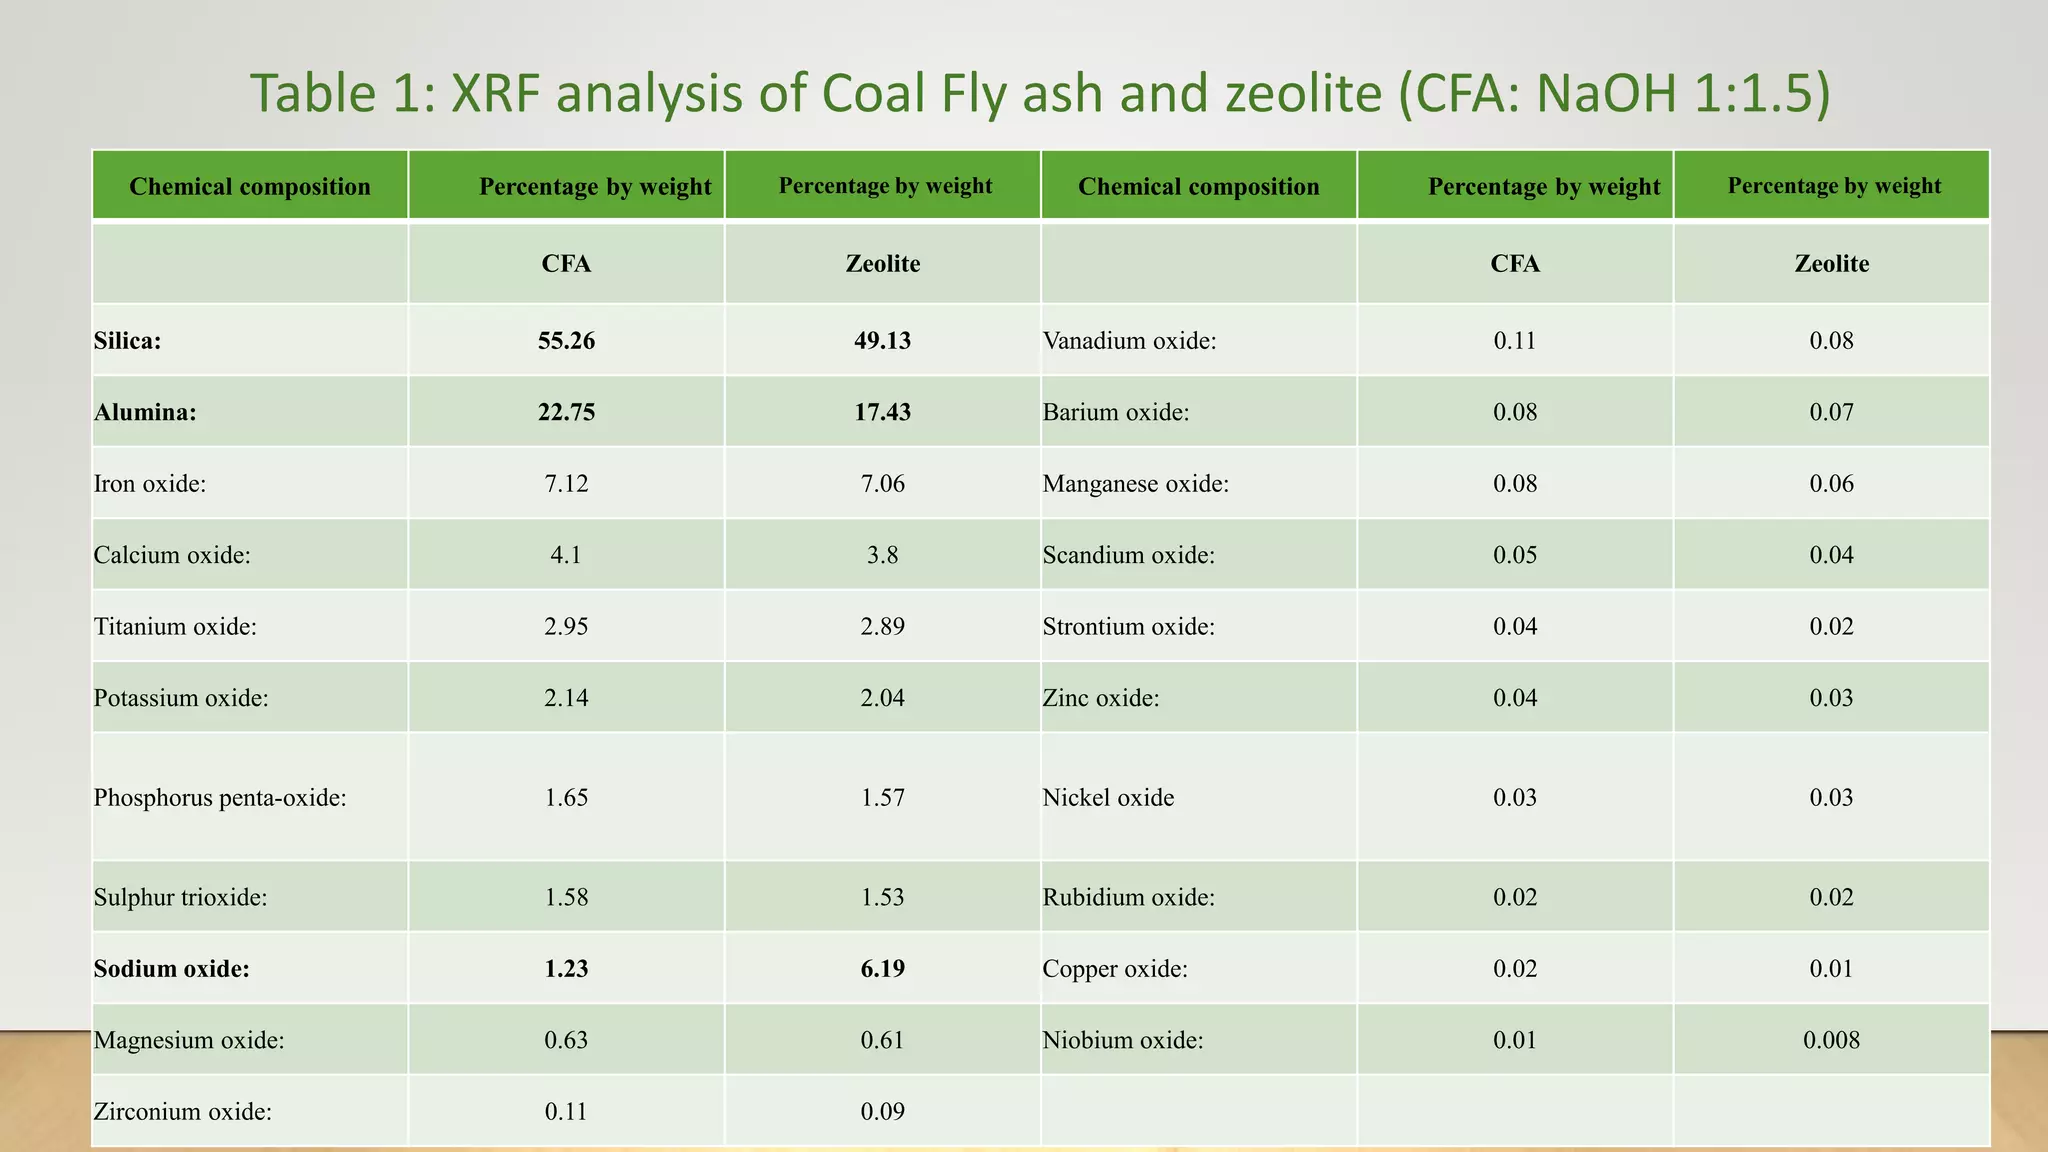
Coal fly ash (CFA) is a micro spherical particulate by- product of combustion of coal. It is primarily composed of
amorphous aluminosilicate and other crystalline minerals like mullite, quartz, haematite and magnetite [1].
Combustion of coal in thermal power stations produces over 1200 million tonnes of fly ash worldwide annually [2].
The disposal of such huge quantities of ash has become a problem [3].
Several approaches have been done for proper utilization of fly ash, for reduction of cost of disposal or for
minimizing environmental impact. The production of zeolites is one of the potential applications of CFA. The
aluminosilicate glass in CFA is a readily available source of Si and Al for zeolite synthesis so as to obtain high value
industrial products with environmental technological utilization [4].
Zeolites are three-dimensional, microporous, crystalline solids with well-defined structures that contain aluminium,
silicon, and oxygen in their regular framework; cations and water are located in the pores. Compositionally, zeolites
are similar to clay minerals. More specifically, both are alumino-silicates. They differ, however, in their crystalline
structure[5].
Due to rapid growth of industrialization and urbanization with technological advancement, the existing water
resources are becoming increasingly contaminated by discharge of effluent containing organics, colour, heavy
metals and other contaminants. It is discharged into water bodies from mining operation, metal plating and
tanneries](https://image.slidesharecdn.com/payalphdslidesfinal1autosaved-210827172458/75/Payal-phd-slides-final1-autosaved-2-2048.jpg)
![ Heavy metal pollutant with density five times of water[6] has emerged due to anthropogenic activity which is the
prime cause of pollution, primarily due to mining the metal, smelting, foundries, and other industries that are metal-
based, leaching of metals from different sources such as landfills, waste dumps, excretion, livestock and chicken
manure, runoffs, automobiles and roadworks.
Heavy metals are potentially hazardous in combined or elemental forms. These are highly soluble in the aquatic
environments and therefore they can be absorbed easily by living organisms.
Chronic toxicity of Cadmium (Cd) in children includes damages of respiratory, renal, skeletal and cardiovascular systems
as well as development of cancers of the lungs, kidneys, prostate and stomach. The US EPA’s regulatory limit of Cd in
drinking water is 5 ppb or 0.005 parts per million (ppm). The WHO recommended safe limits of Cd in both wastewater
and soils for agriculture is 0.003 ppm[7].
Exposure to Lead (Pb) can occur through inhalation of contaminated dust particles and aerosols or by ingesting
contaminated food and water. Lead poisoning in humans damages the kidneys, liver, heart, brain, skeleton and the
nervous system The regulatory limit of Pb in drinking water according to US EPA is 15 ppb. The WHO recommended safe
limits of Pb in wastewater and soils used for agriculture are 0.01 and 0.1 ppm respectively[8].](https://image.slidesharecdn.com/payalphdslidesfinal1autosaved-210827172458/75/Payal-phd-slides-final1-autosaved-3-2048.jpg)
![ A wide range of copper toxicities have been observed subsequent to accidental or iatrogenic poisonings or suicide
attempts: hepatic and renal failure, cirrhosis, haemolysis, vomiting, melena, hypotension, cardiovascular collapse,
stupor, and coma. The EPA’s established a limit of copper in drinking water as 1.3 ppm. The WHO recommended safe
limits of Cu in wastewater and soils used for agriculture are 0.025 and 0.1 ppm respectively[8].
Dyes or colouring substances are considered as one of the significant pollutants and they are stated as ‘visible
pollutant[9]. Textile effluents are major industrial polluters because of high color content, about 15% unfixed dyes
and salts[10].
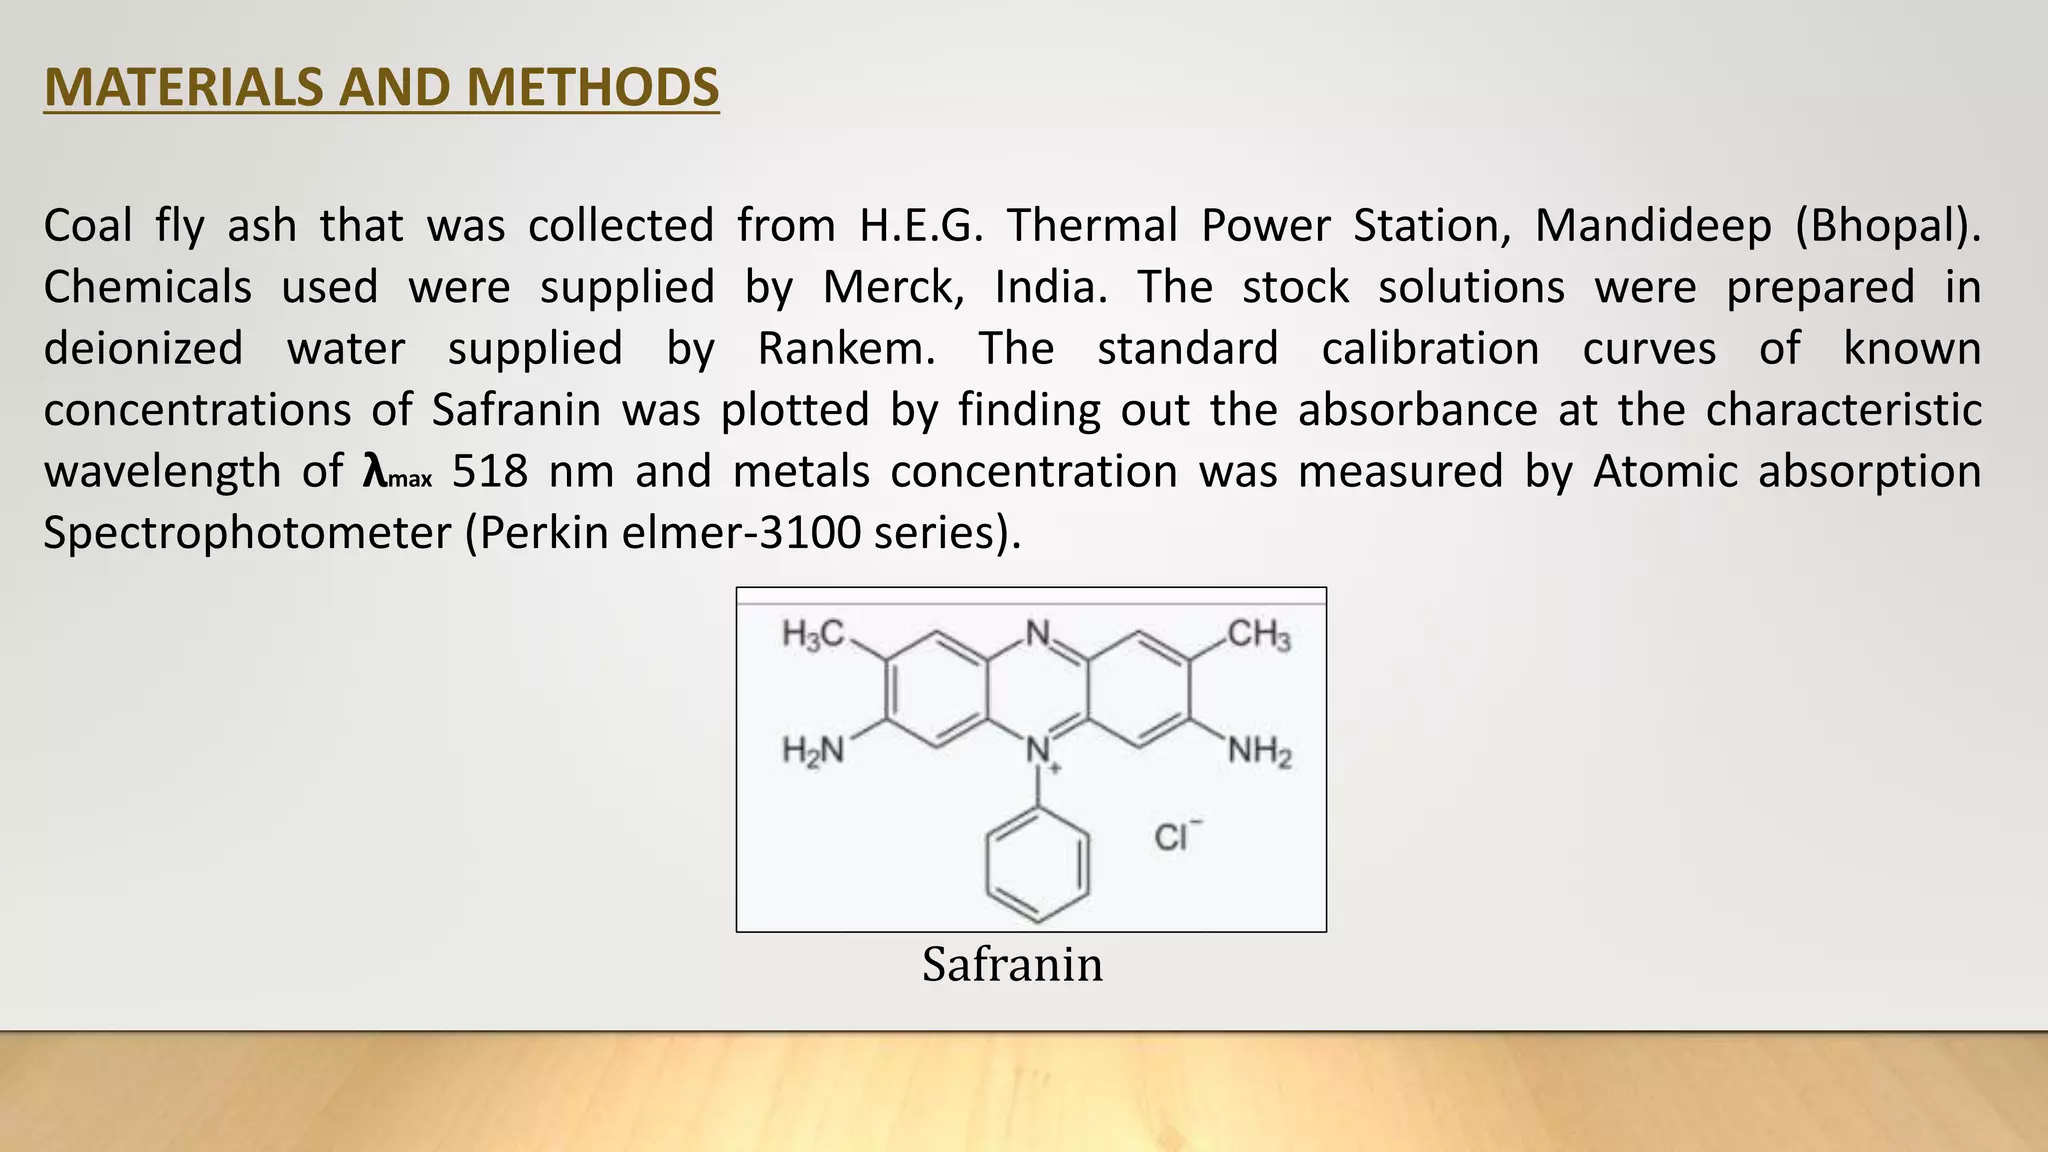
Safranin is a popular and most ancient dye used in textile and silk industries , this dye is used to dye food and dessert
coloring, despite the benefits of this dye , but when discharge to the water it causes water pollution and respiratory
diseases skin and digestive tract infections on ingestion[11].
Hazardous pollutant are difficult to remove by conventional wastewater treatment, Possible methods of their
removal include chemical oxidation, froth flotation, adsorption, and coagulation etc. Among these, adsorption
currently appears to offer the best potential for overall treatment.
Zeolite being effective and reliable source of adsorption was synthesized from coal fly ash and applied to remove
heavy metals and dye in the thesis work.](https://image.slidesharecdn.com/payalphdslidesfinal1autosaved-210827172458/75/Payal-phd-slides-final1-autosaved-4-2048.jpg)
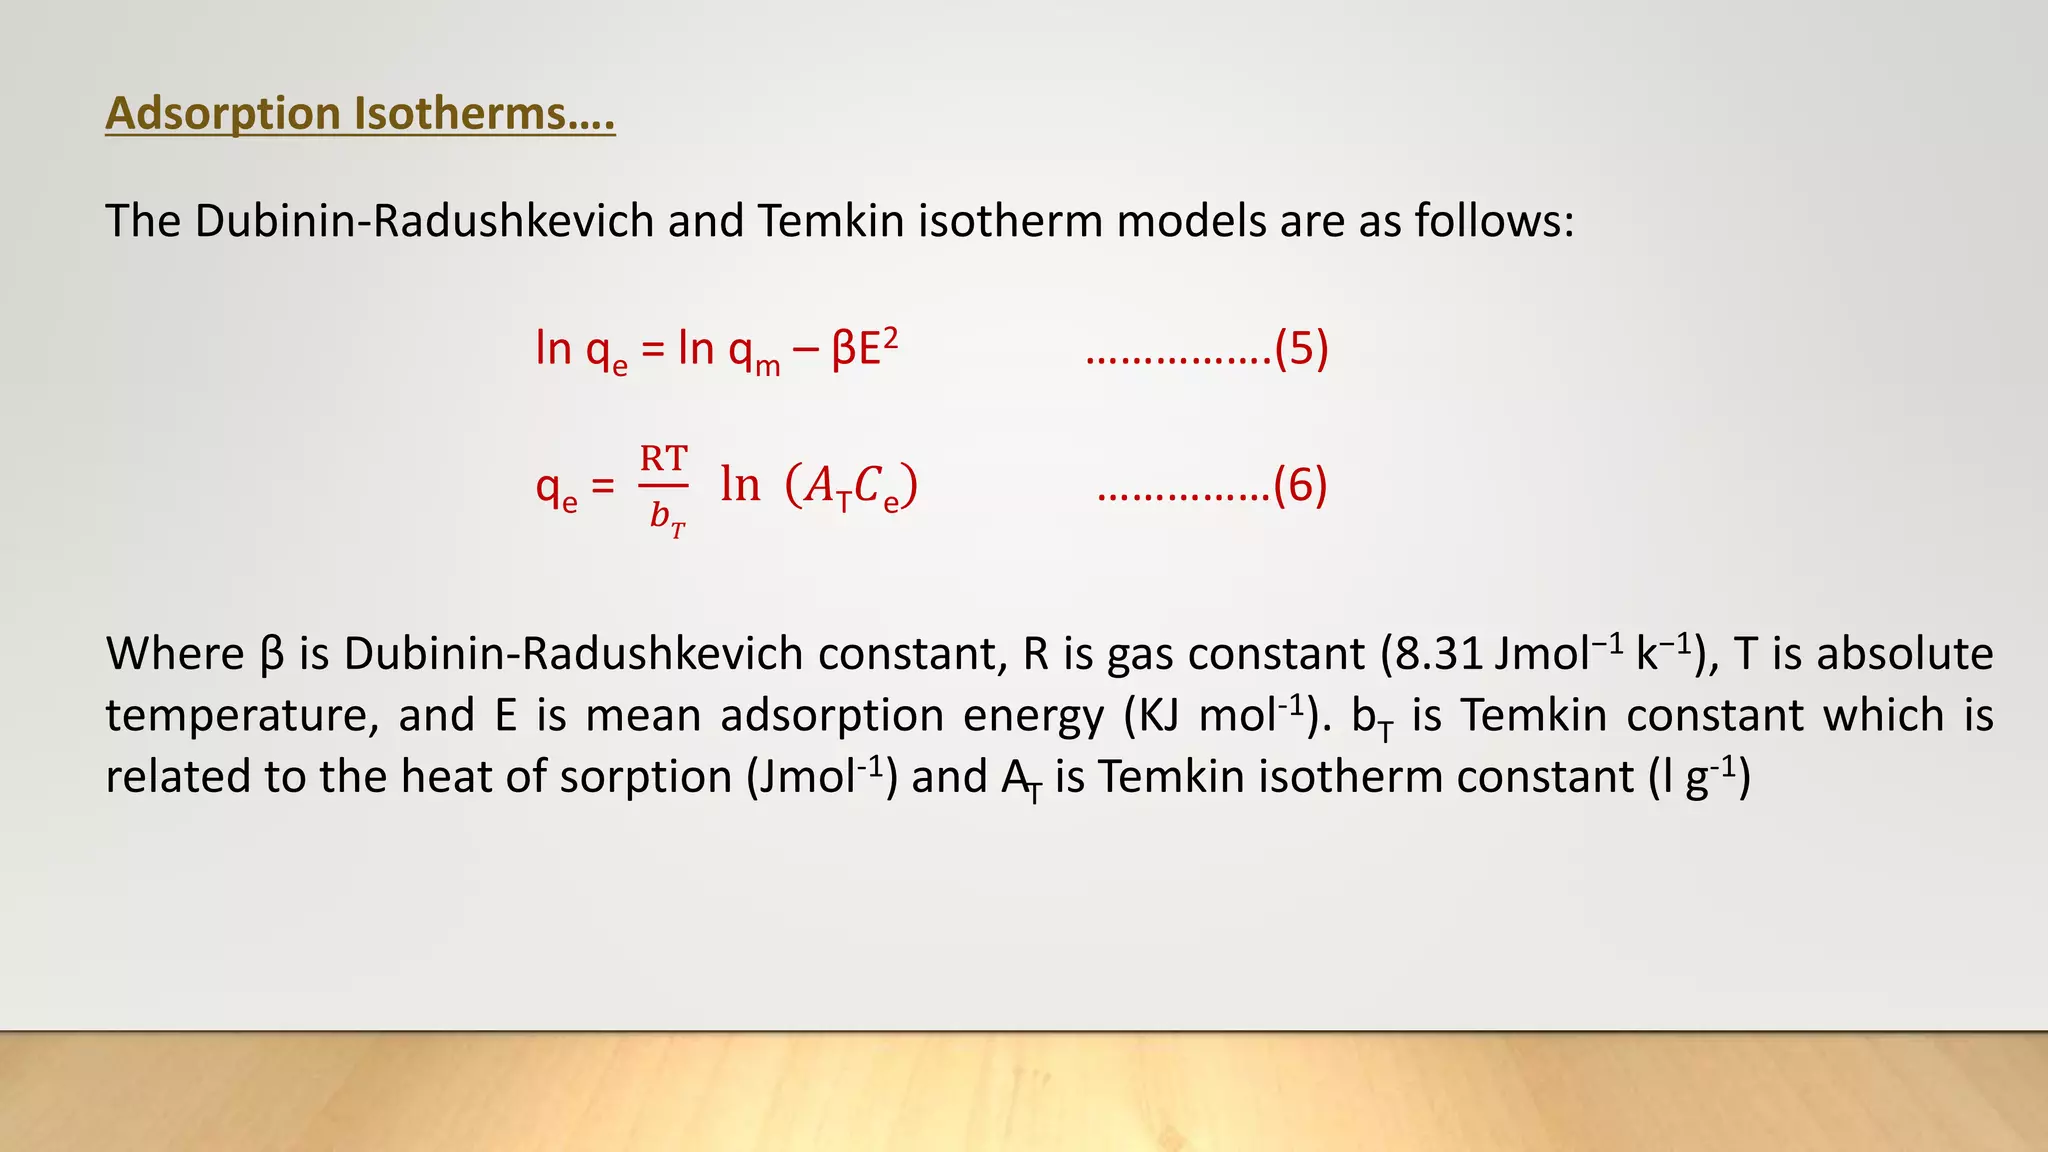
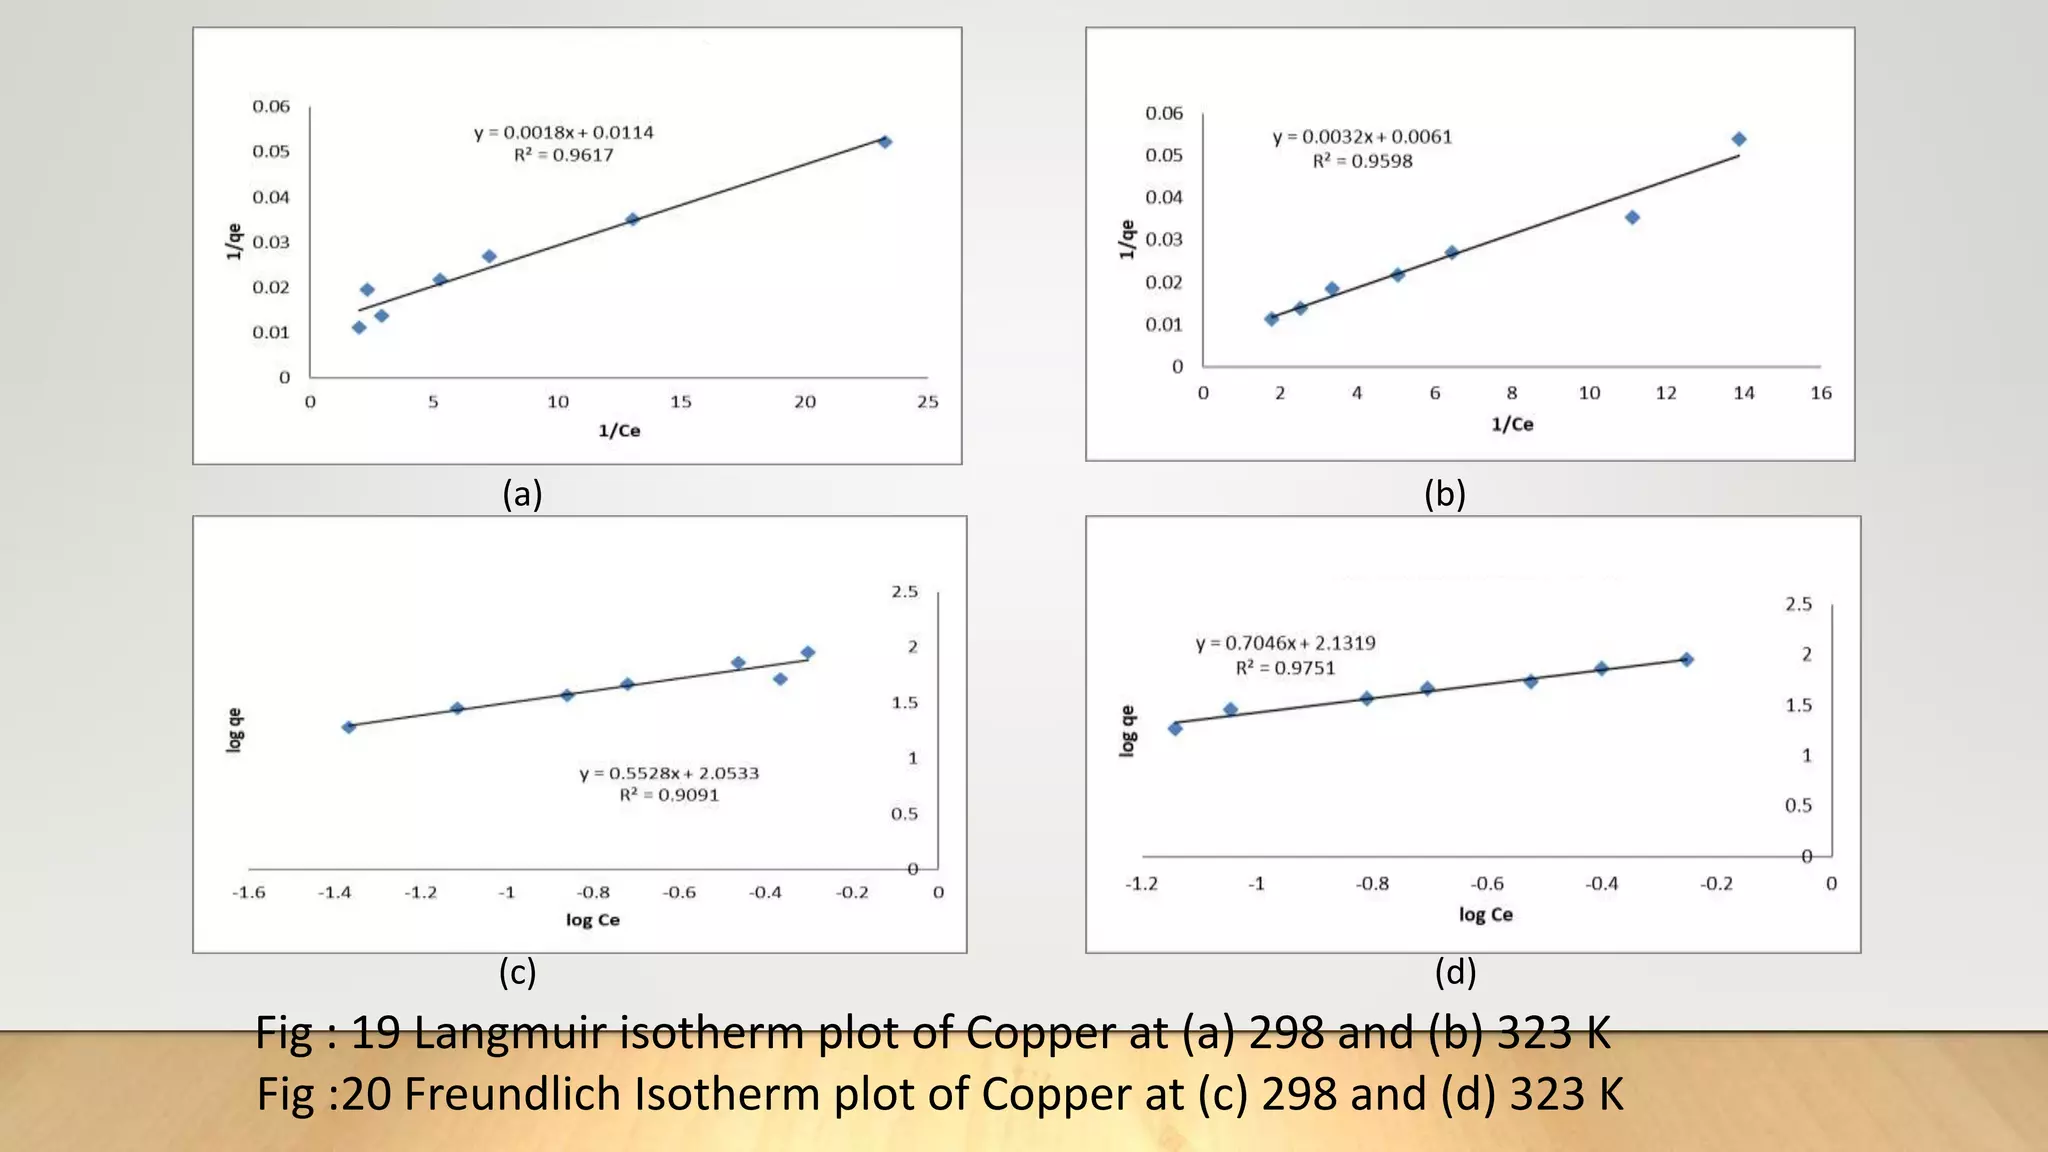
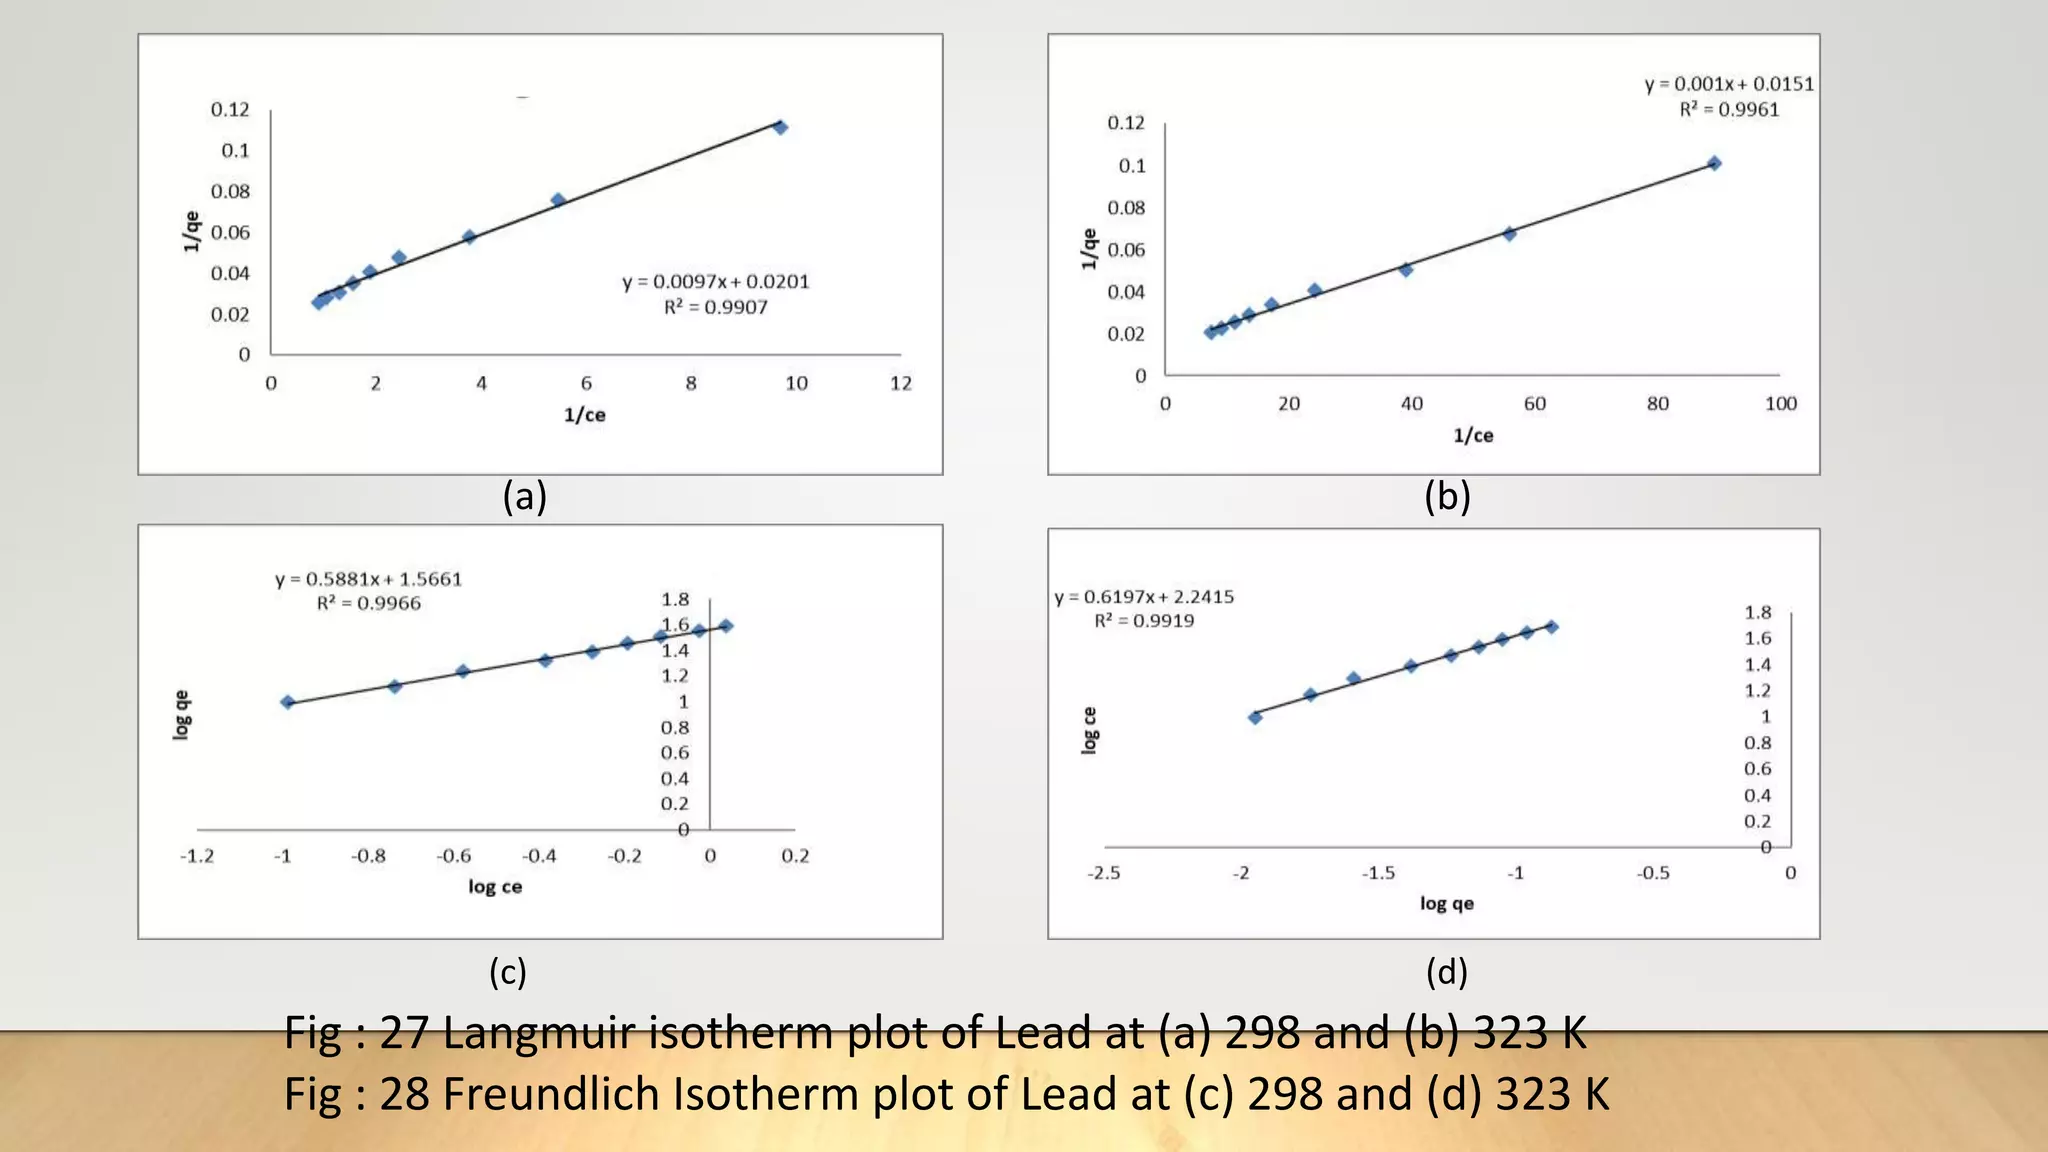
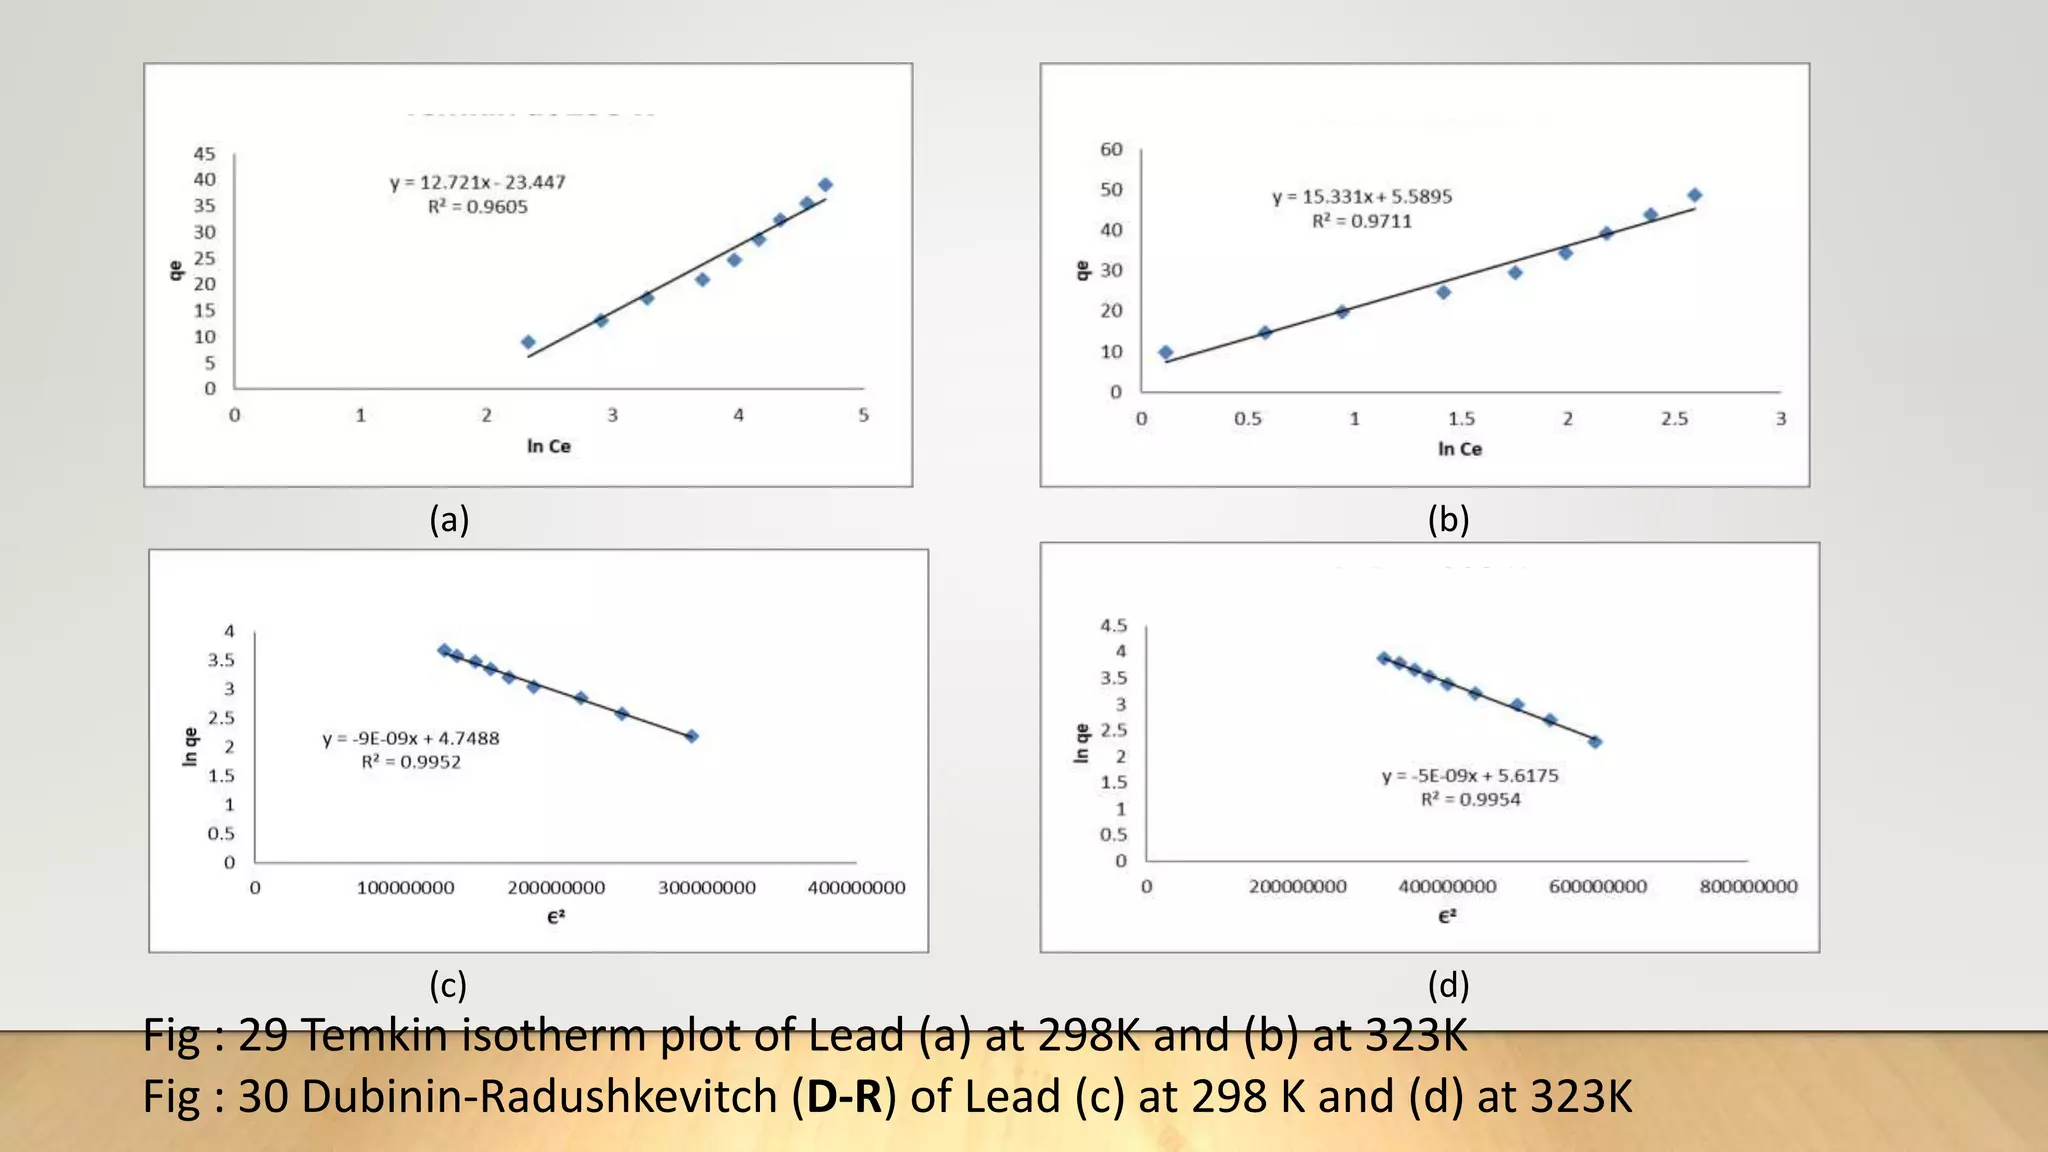
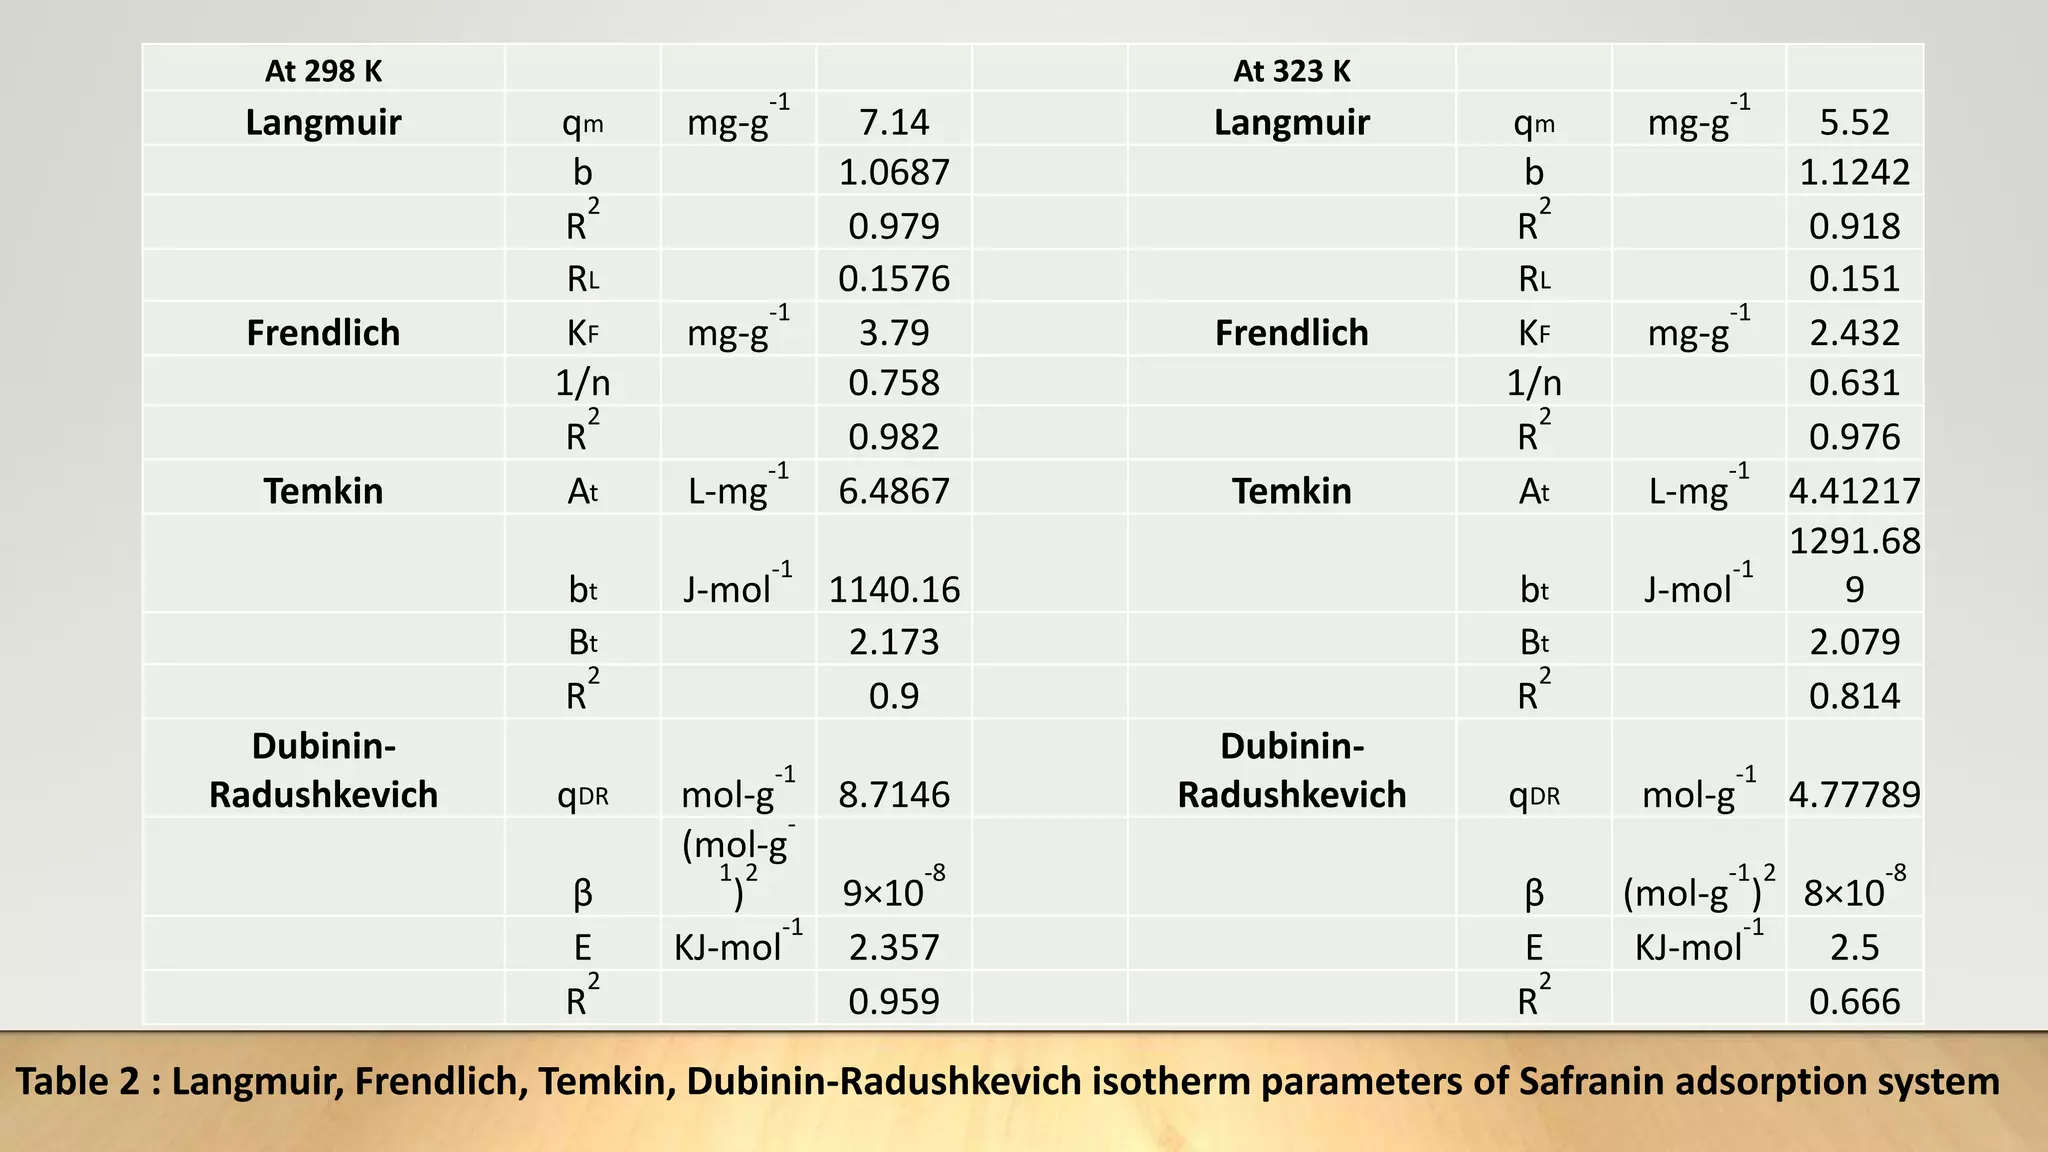
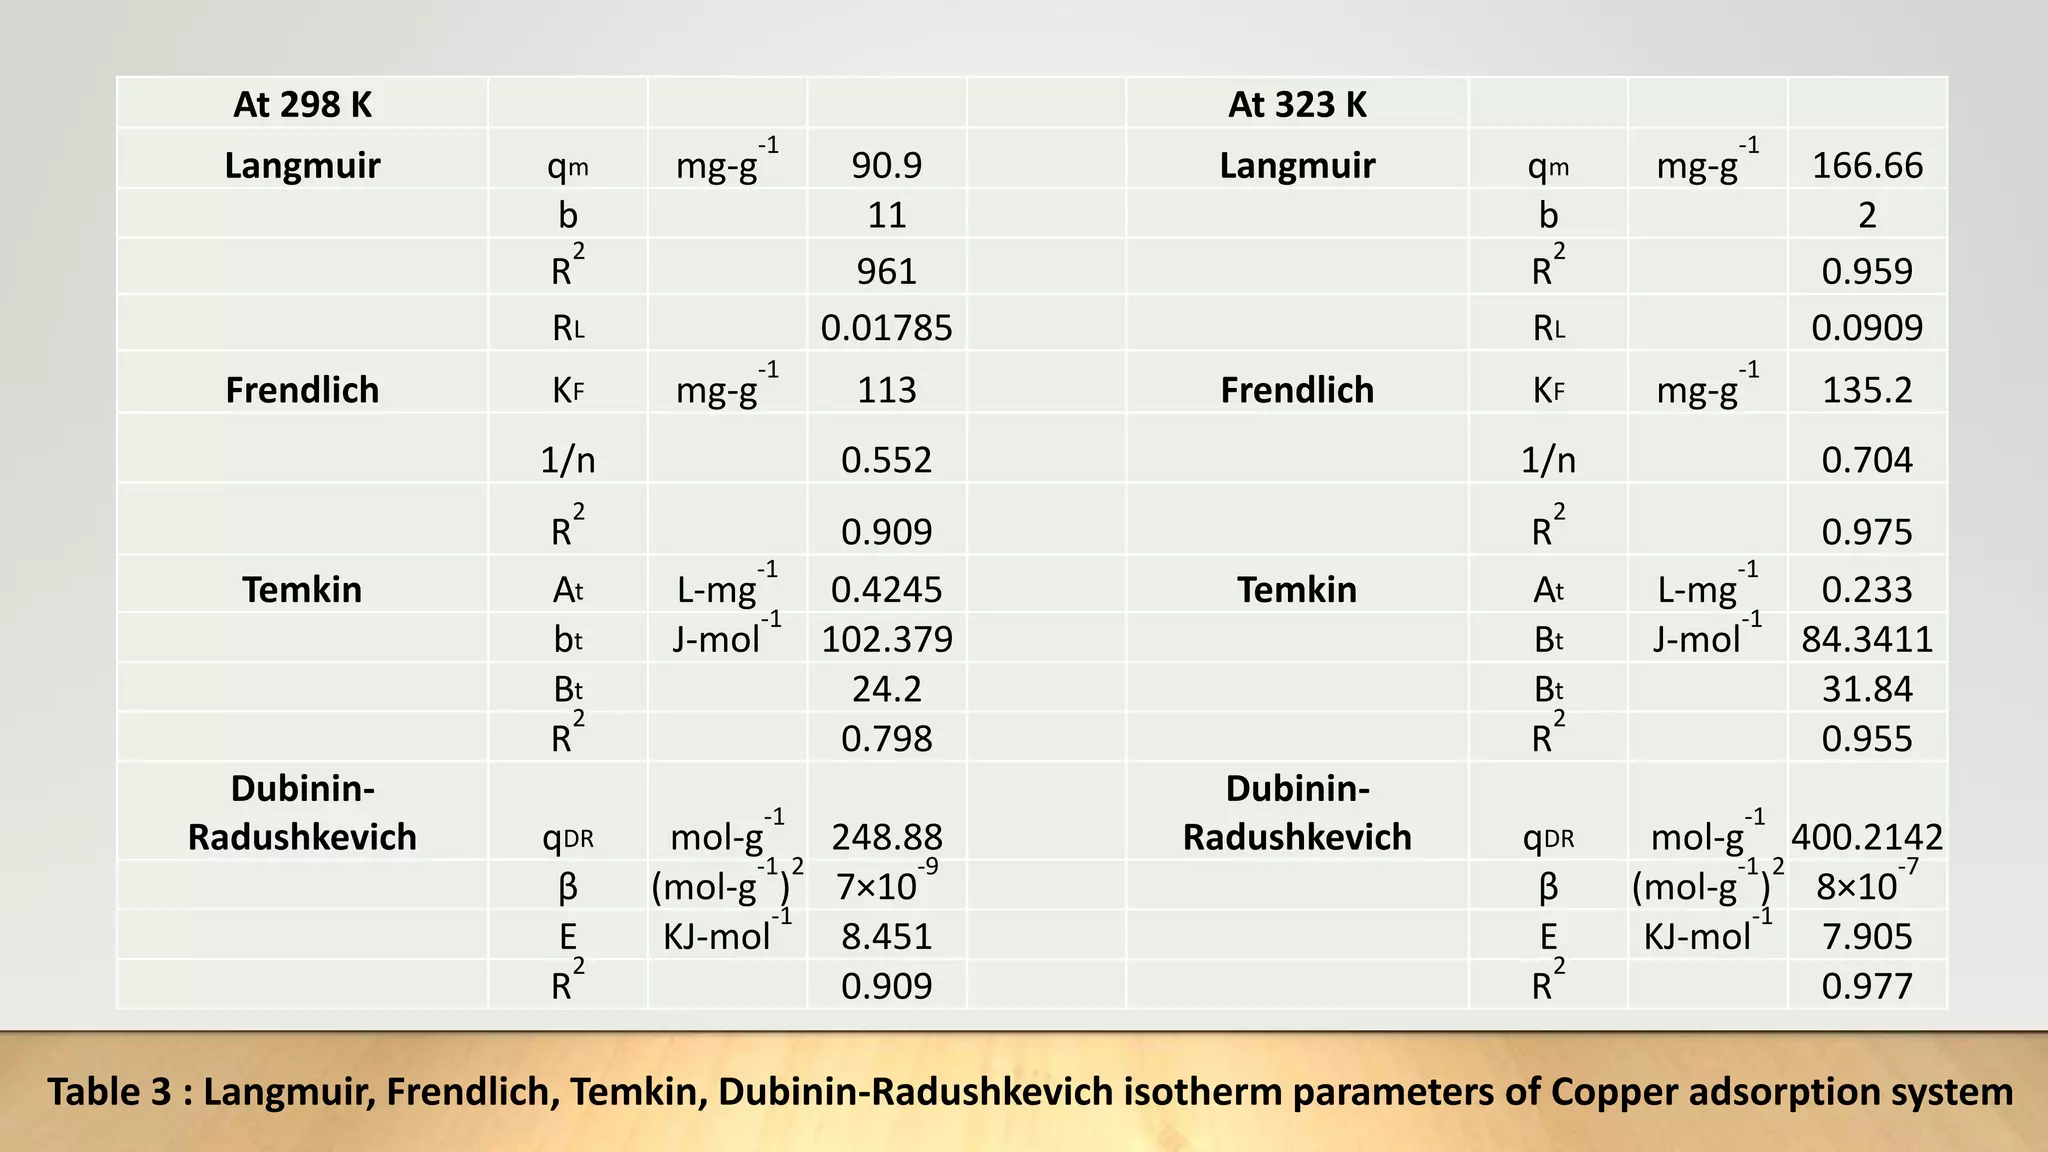
![Adsorption Isotherms
The equilibrium data obtained in the present study were analyzed using Langmuir[12],
Freundlich[13], Dubinin-Radushkevich[14] and Temkin[15] isotherm models.
The rearranged Langmuir and Freundlich isotherm equations can be described as:
1
qe
=
1
qm
+ (
1
bqm
)(
1
Ce
) .............. (3)
log qe= log Kf +
1
n
log Ce. .............(4)
Where qm and b are the Langmuir constants related to maximum adsorption capacity and
energy of adsorption, respectively. Kf is a Freundlich constant related to the adsorption
capacity (mg/g) and n is an empirical constant.](https://image.slidesharecdn.com/payalphdslidesfinal1autosaved-210827172458/75/Payal-phd-slides-final1-autosaved-10-2048.jpg)
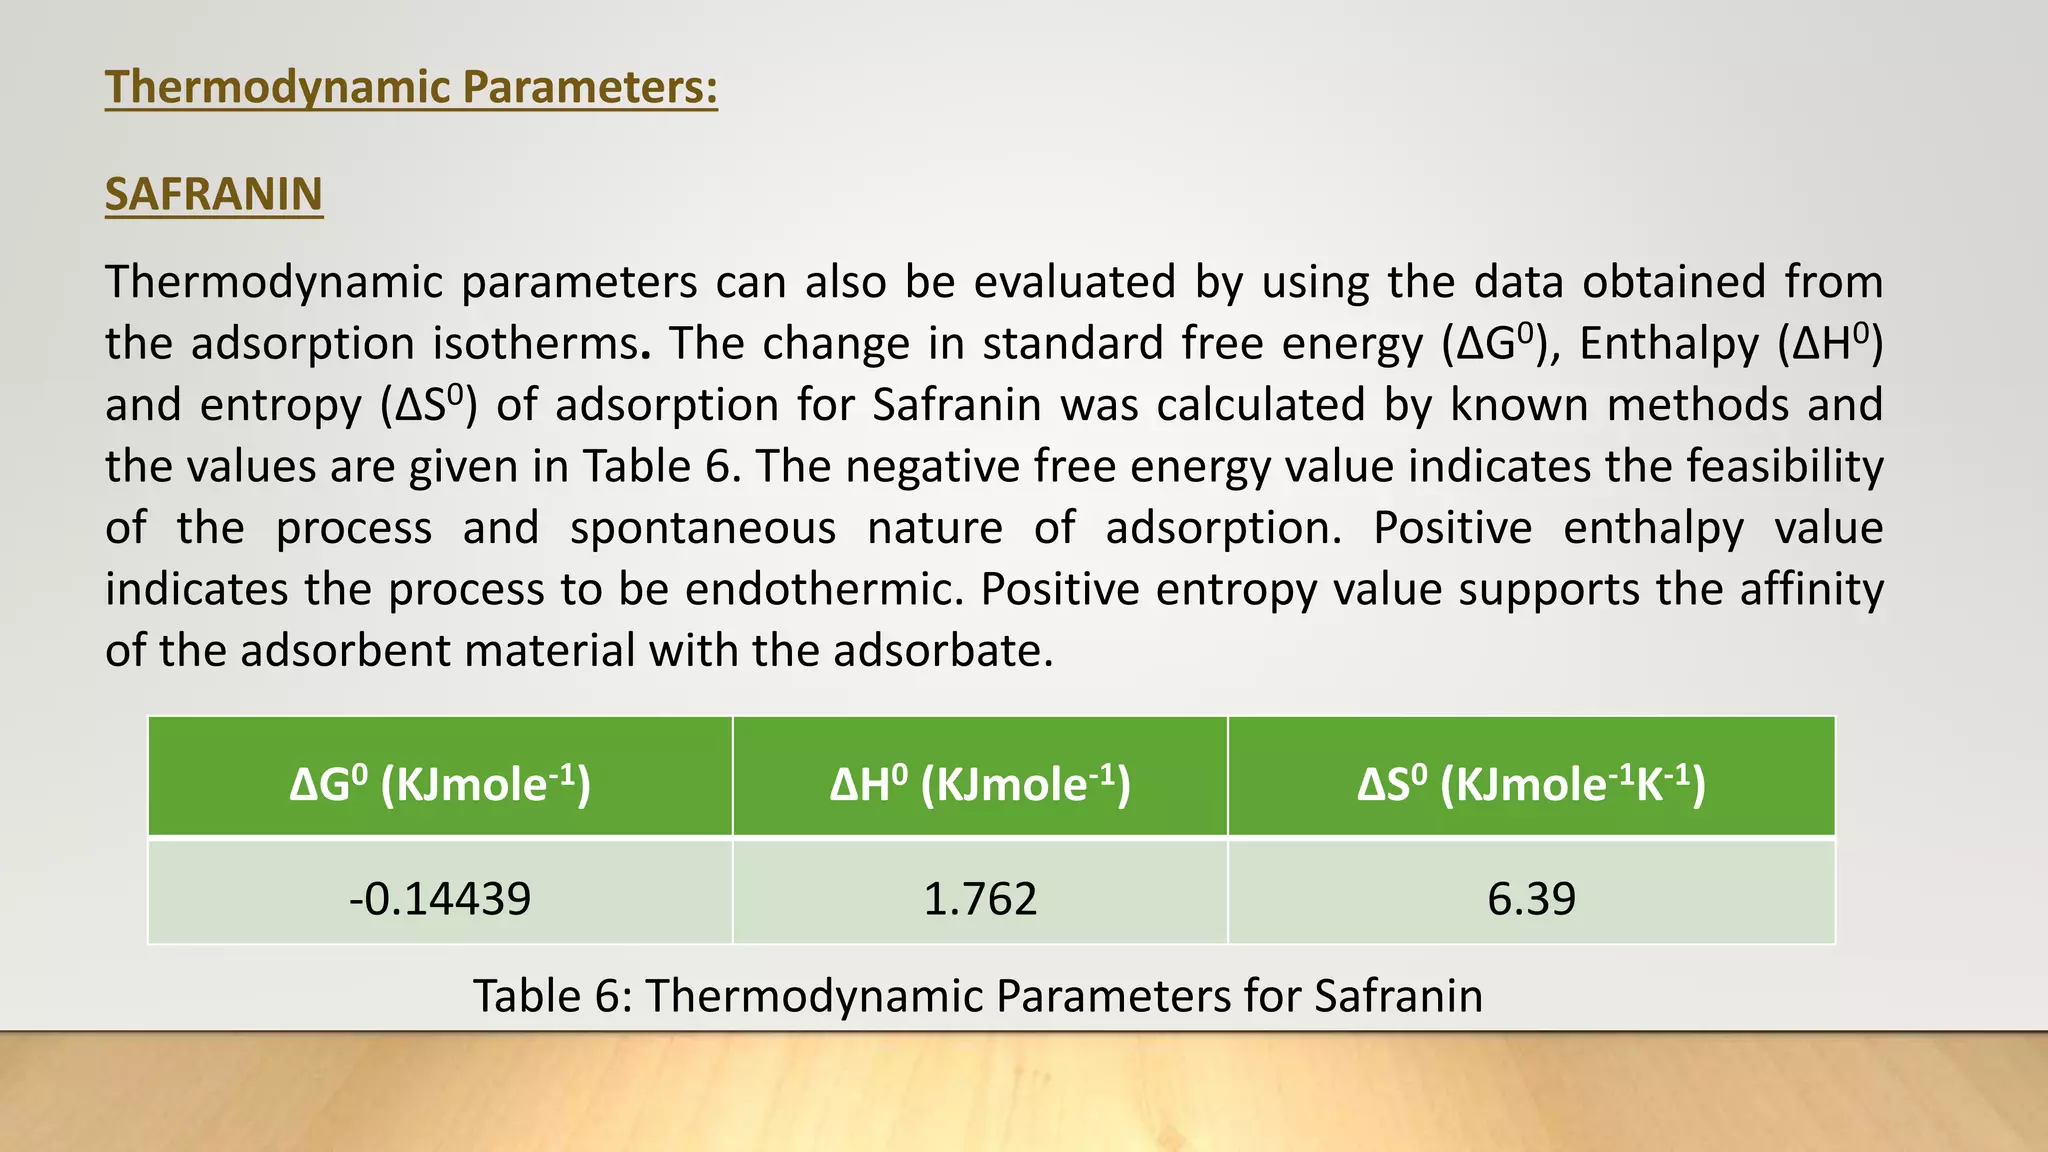
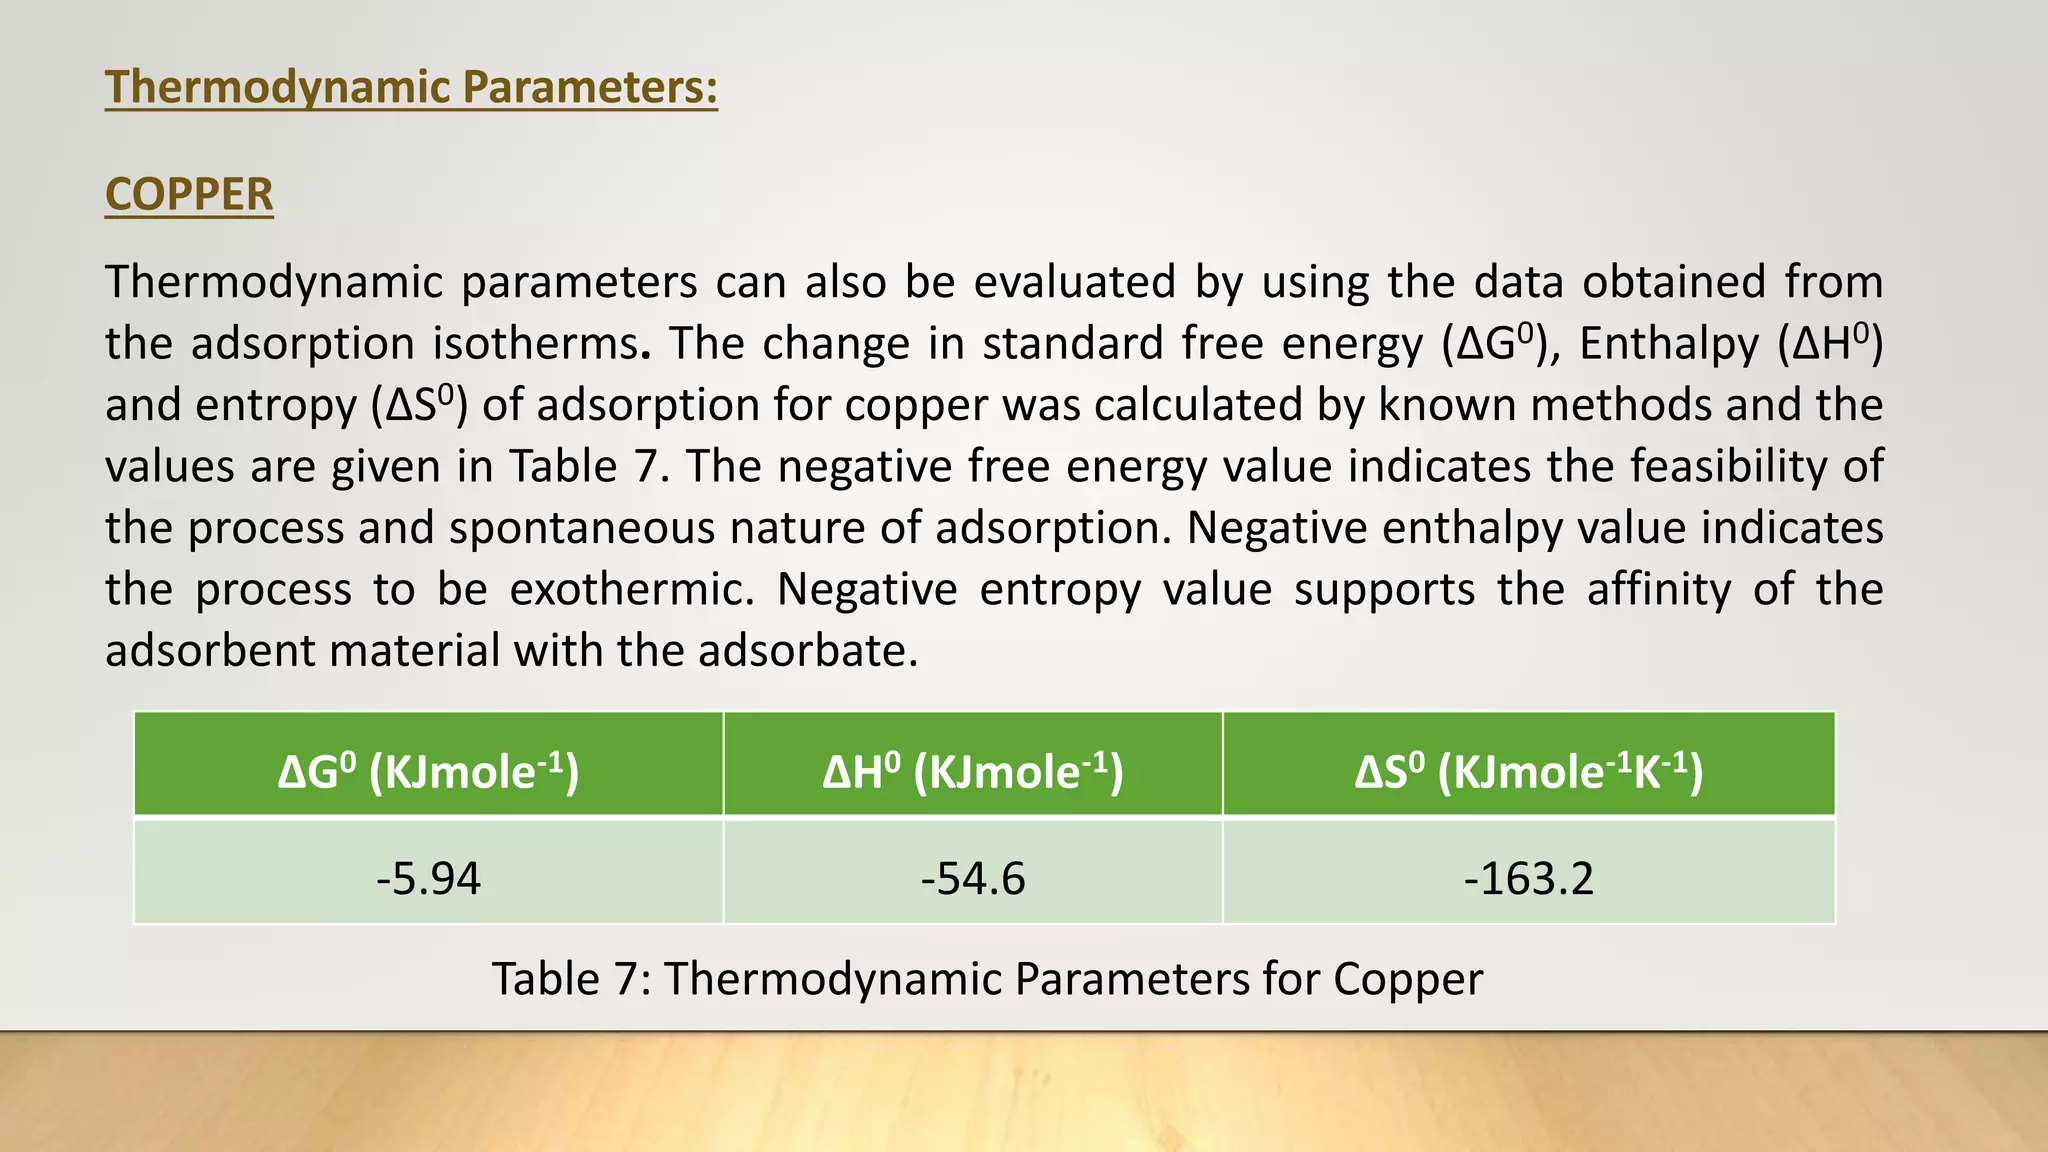
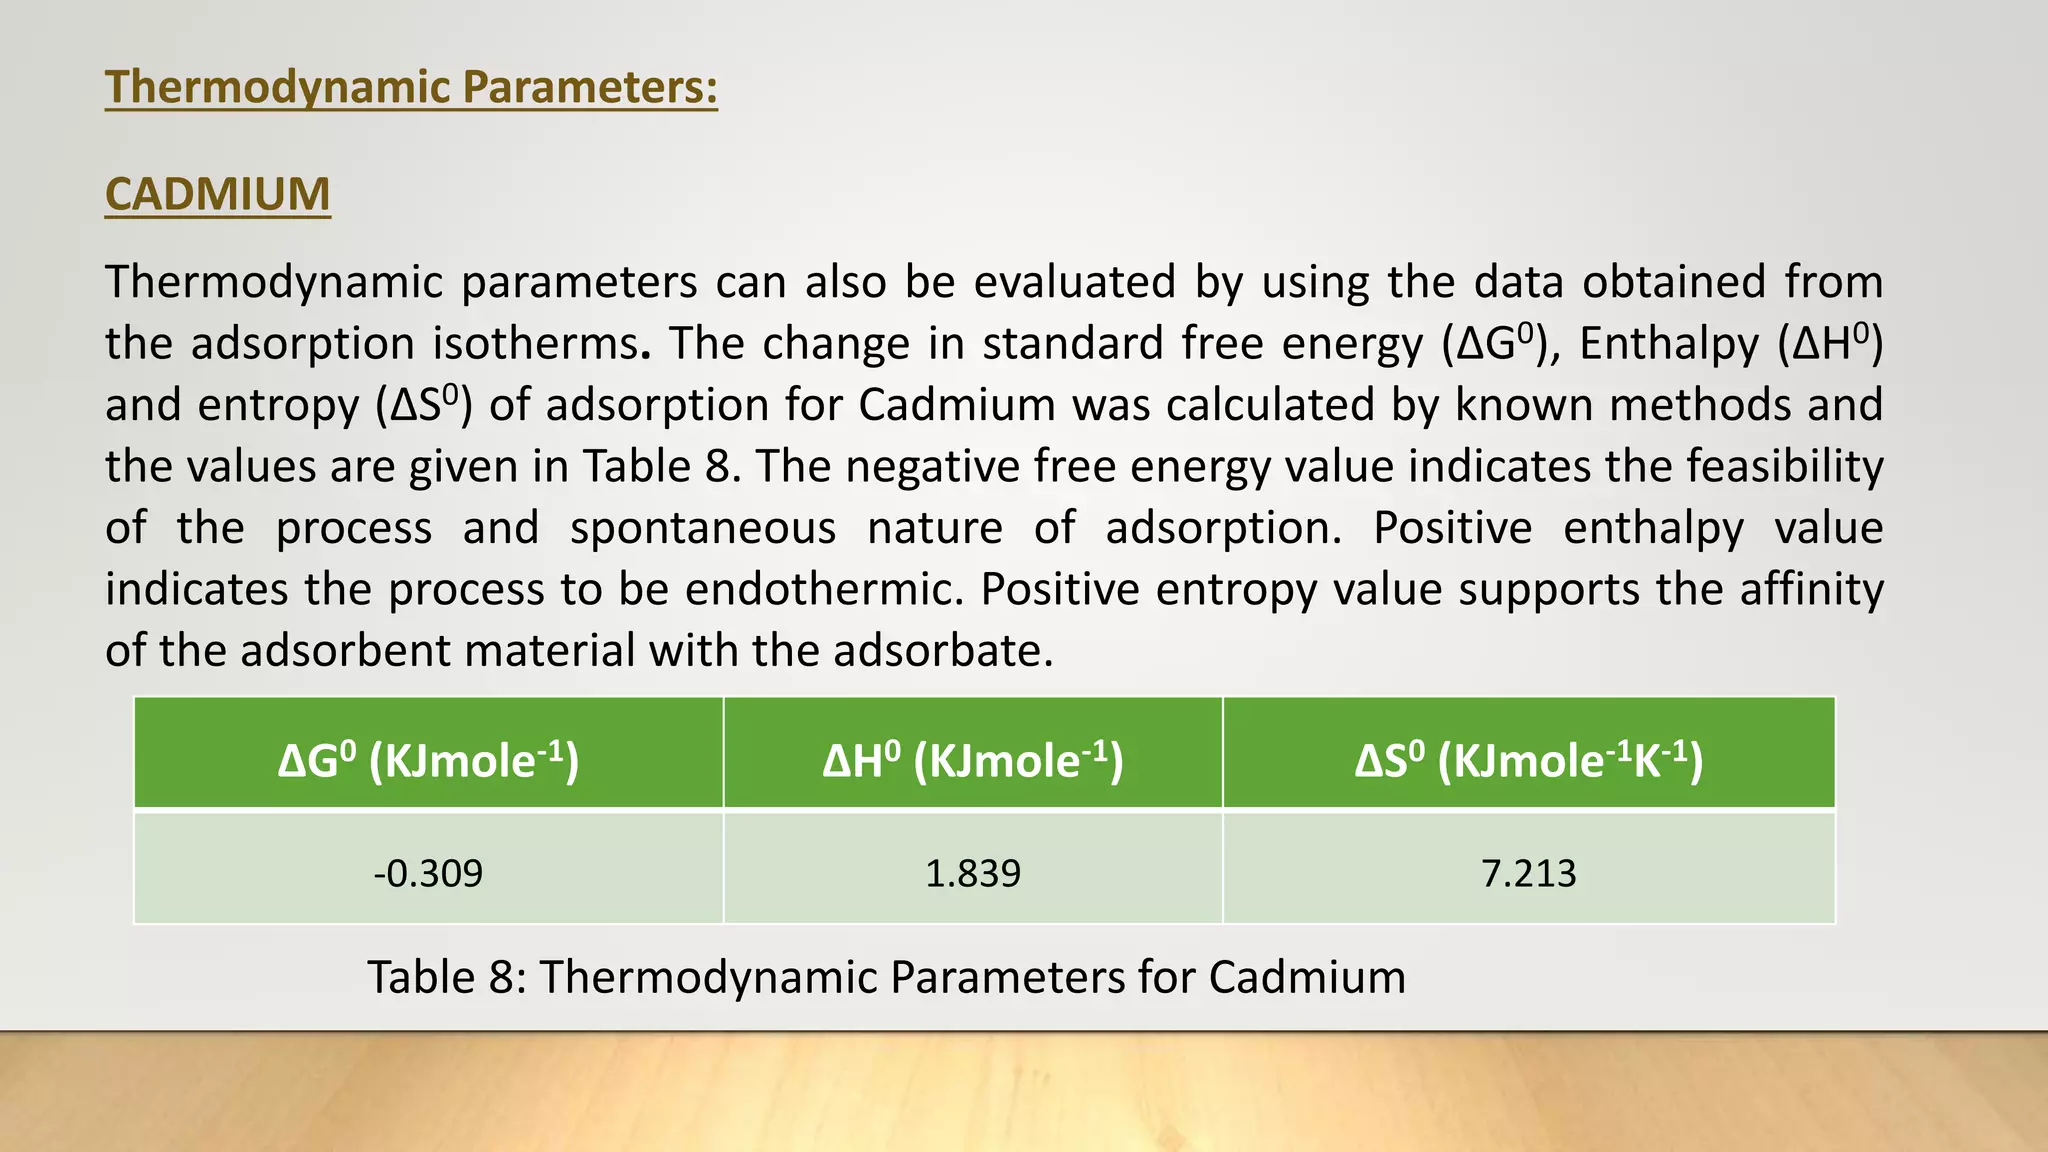
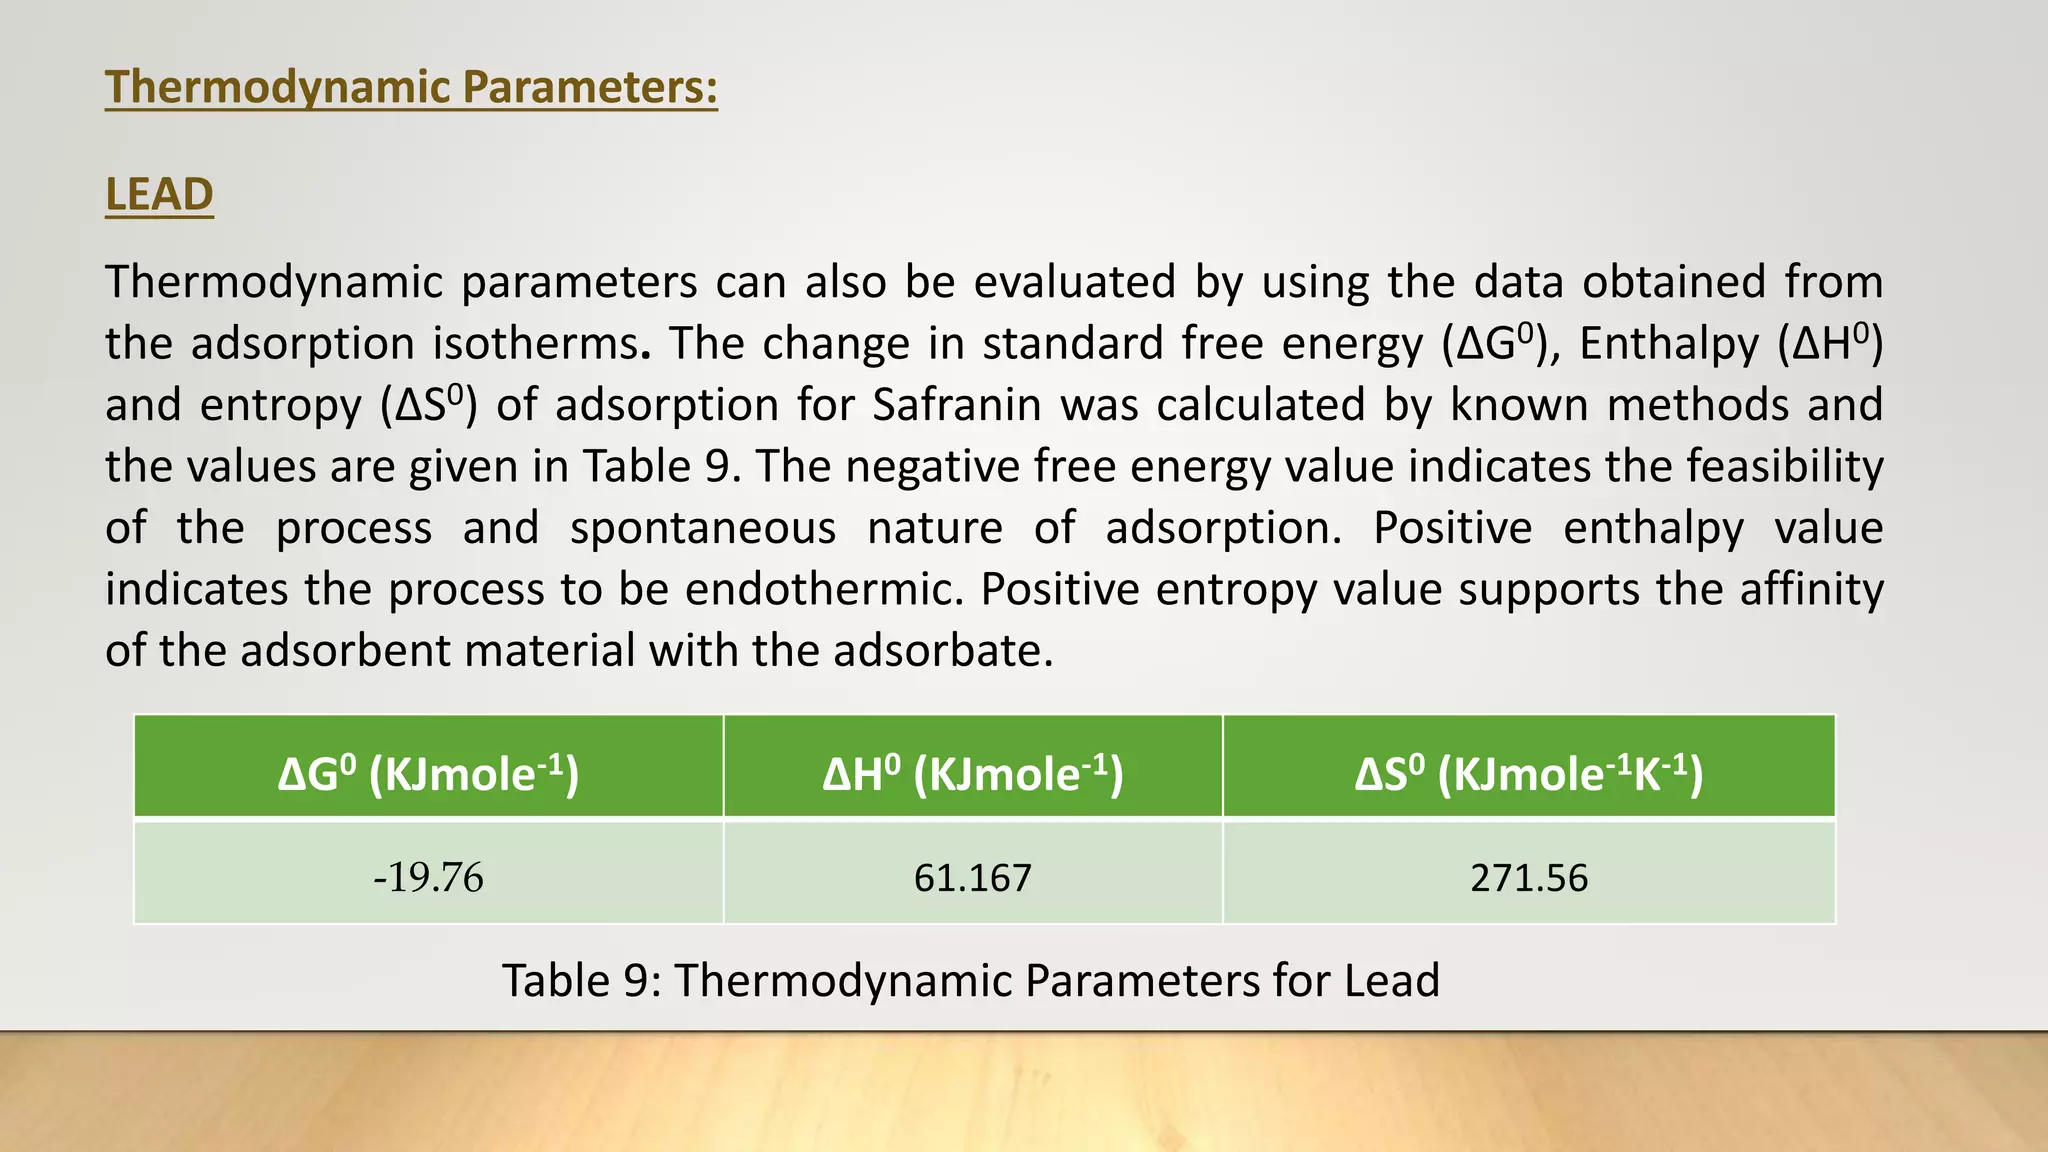
![Thermodynamic Studies
Thermodynamic studies play an important role in understanding the process of
adsorption. This work computes the thermodynamic parameters of Gibbs Free
energy (ΔG0), enthalpy (ΔH0) and entropy (ΔS0) of adsorption by carrying out the dye
adsorption process at 303 K. Thermodynamic parameters can also be evaluated by
using the data obtained from the adsorption isotherms.
log
b2
b1
=
ΔH0
R
[
T2−T1
T1T2
] ……… (7)
ΔG°= - 2.303 RT log b ……… (8)
ΔG° = ΔH° - TΔS° ………(9)
Where, b1 and b2 are Langmuir constants at different temperatures, R ideal gas
constant (8.314 J/mol/K), T1 and T2 are temperatures (K).](https://image.slidesharecdn.com/payalphdslidesfinal1autosaved-210827172458/75/Payal-phd-slides-final1-autosaved-12-2048.jpg)
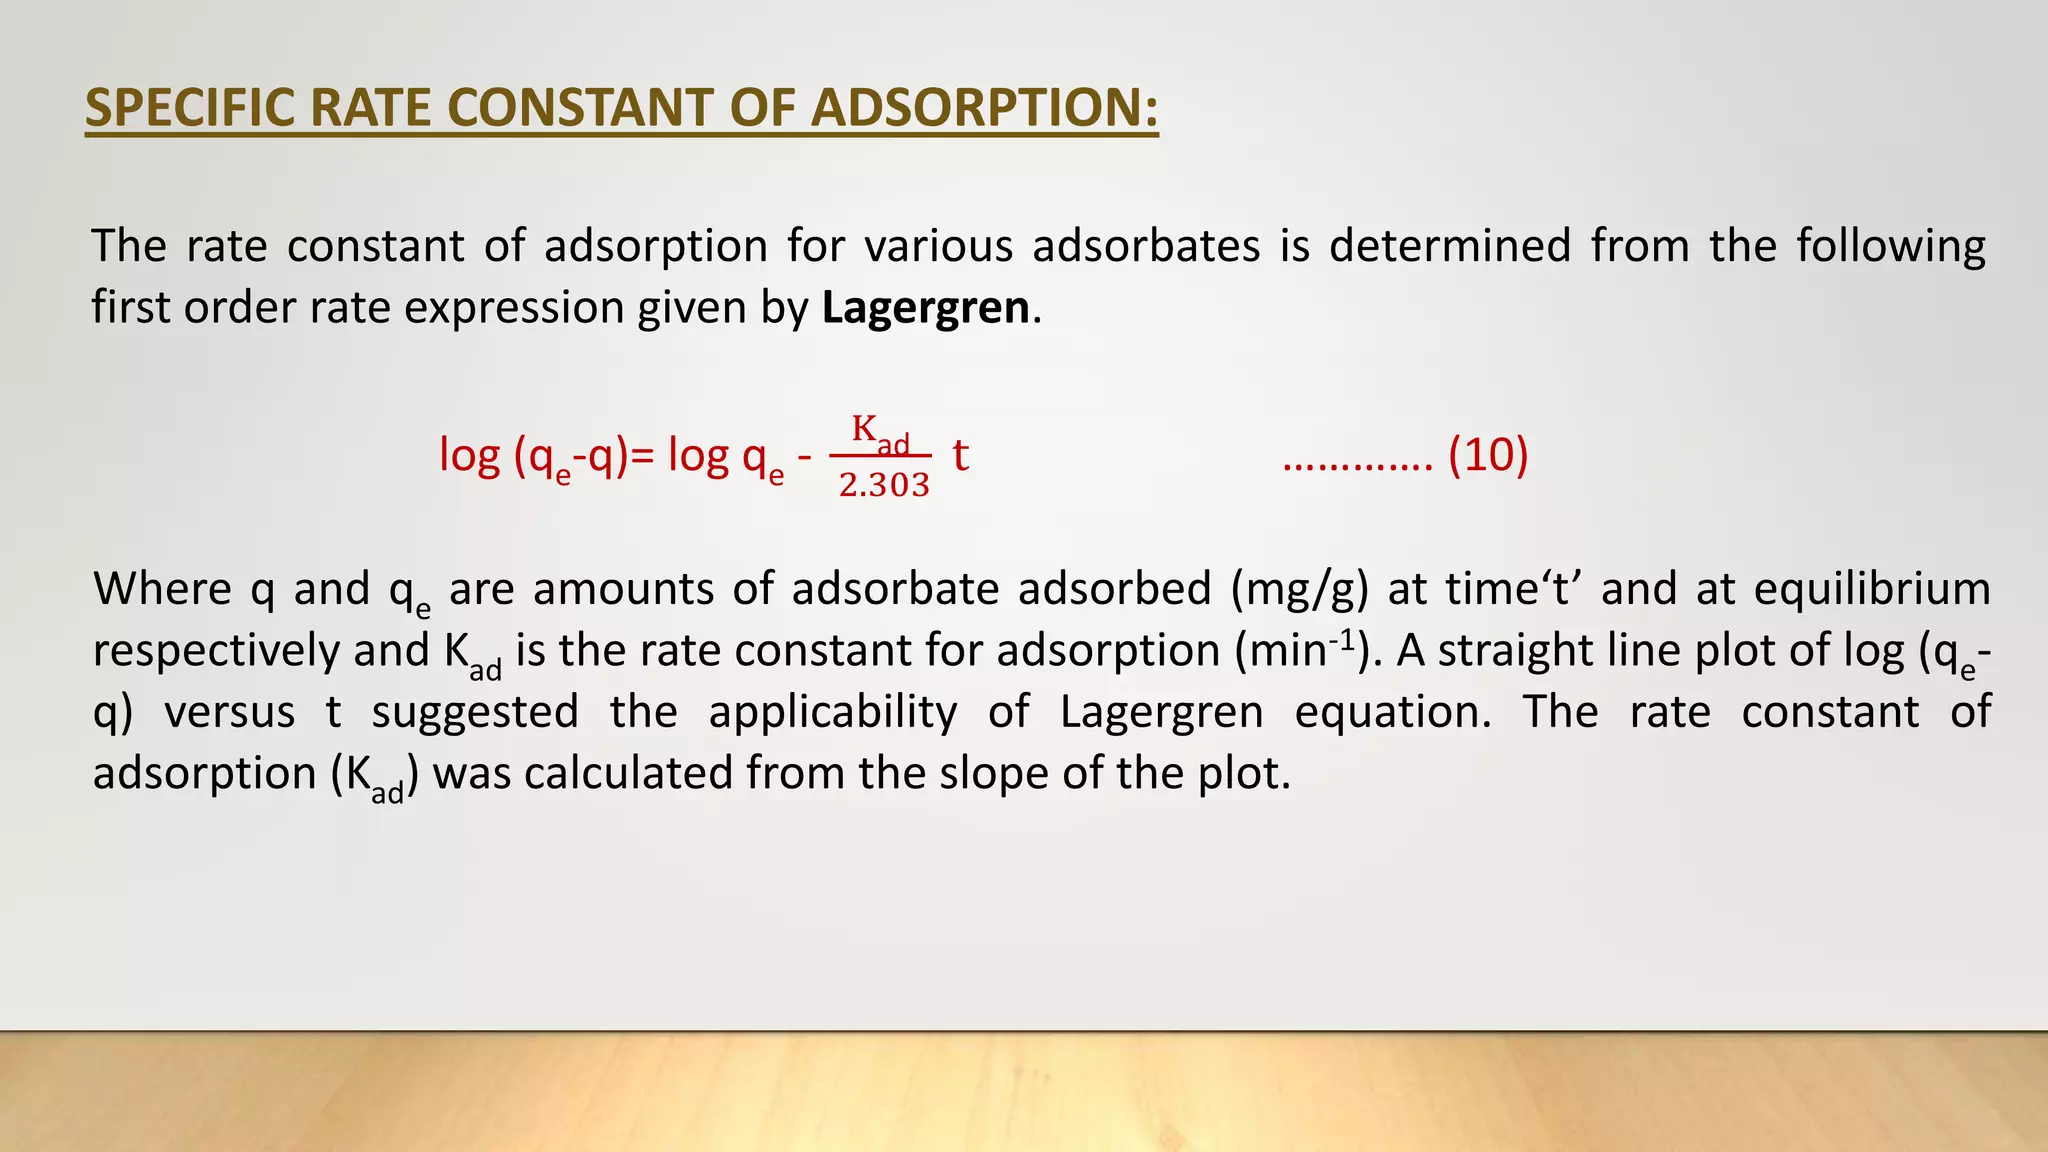
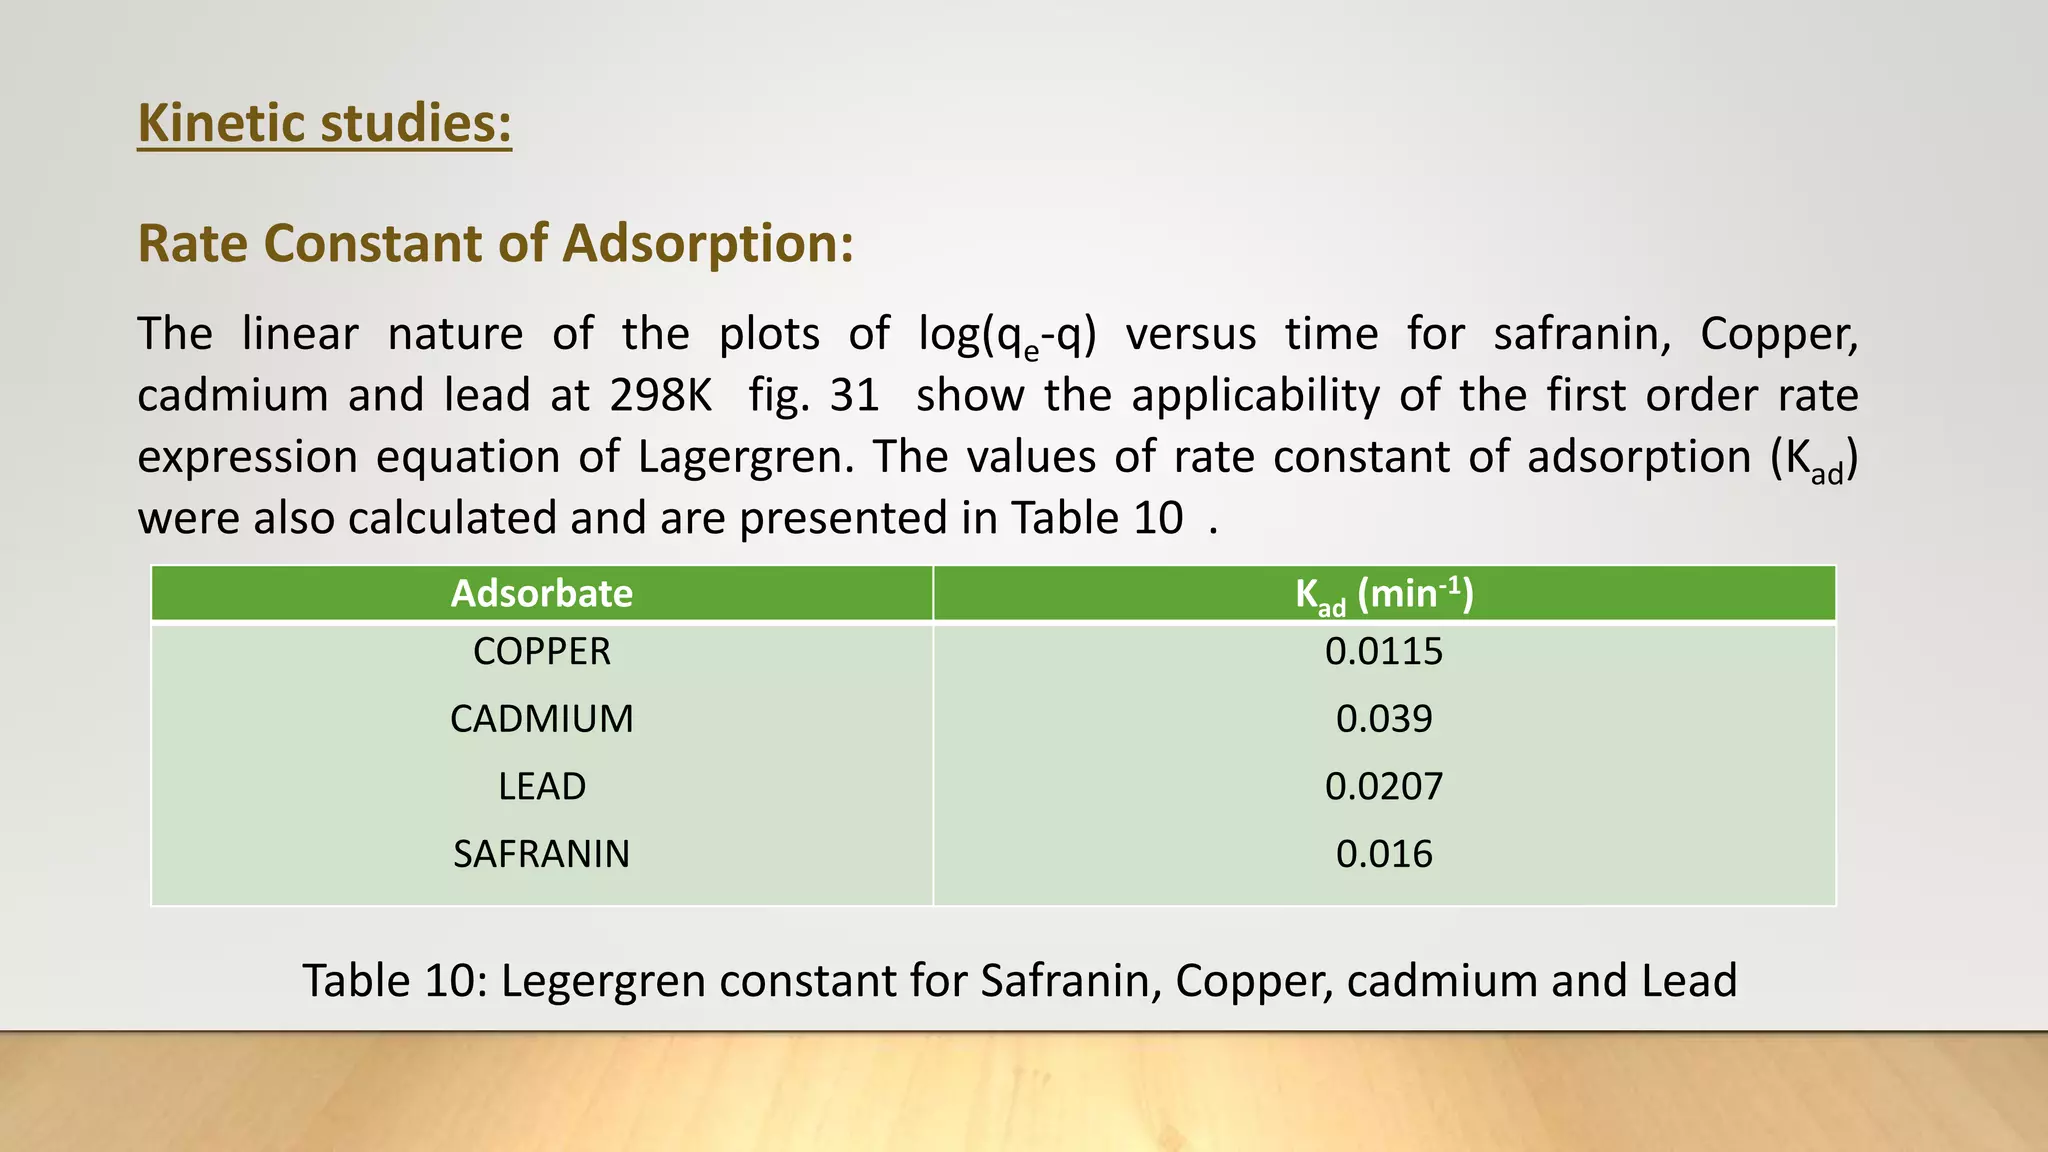
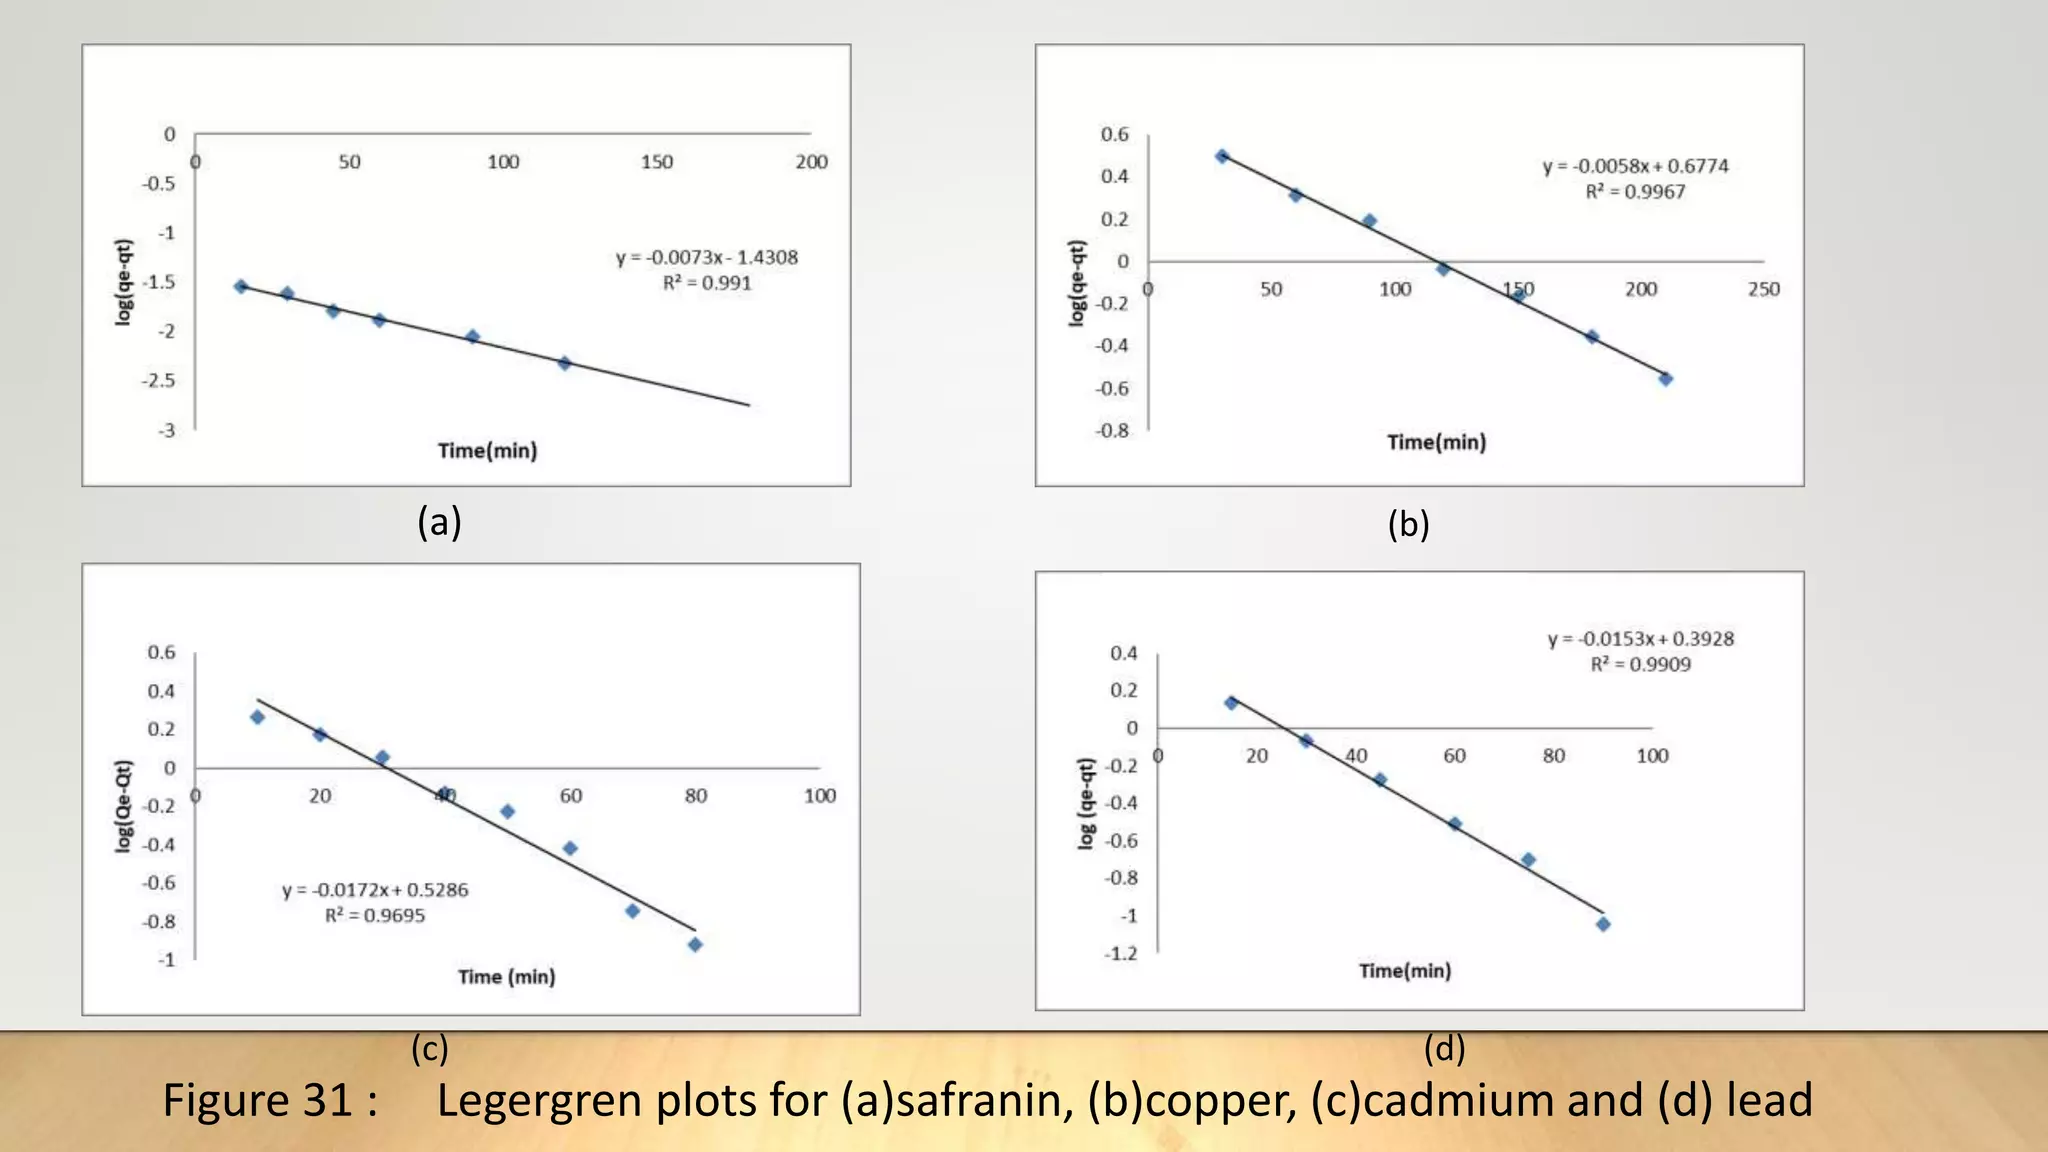
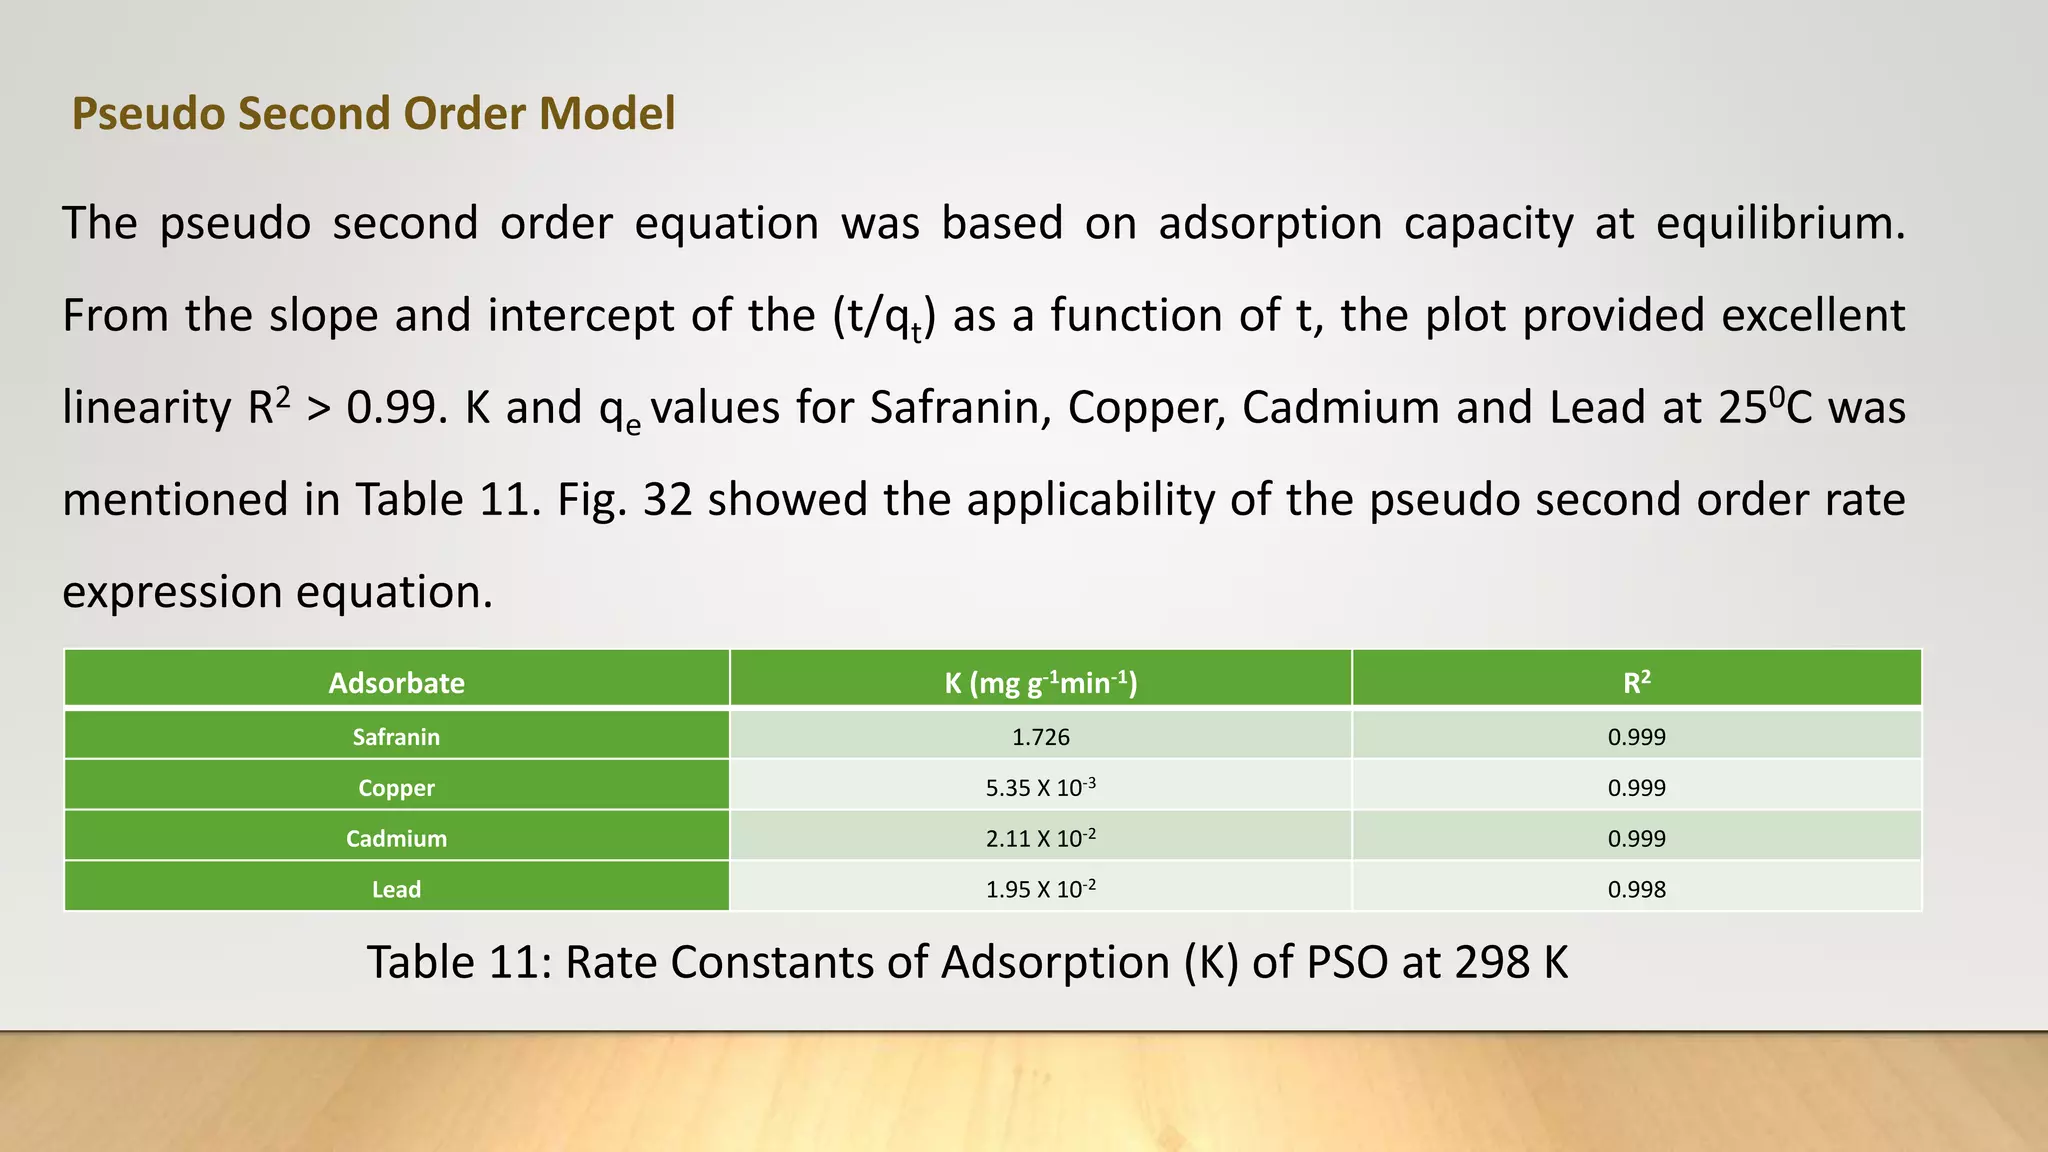
![The pseudo second order (PSO) [16] kinetics model was used to investigate whether chemical reaction at the
adsorption site of zeolite was rate determining. The PSO model is given by:
t
q𝑡
=
1
K2
𝑞2
𝑒
+
t
q𝑒
…………. (11)
Where q𝑡 and q𝑒 are the amount of adsorbate per unit of adsorbent(mgg-1) at time t, and at equilibrium
respectively. K2 (g/mg.min) is the adsorption rate constant. From the slope and intercept of the (t/q𝑡) as a
function of t, K2 and q𝑒 can be obtained.
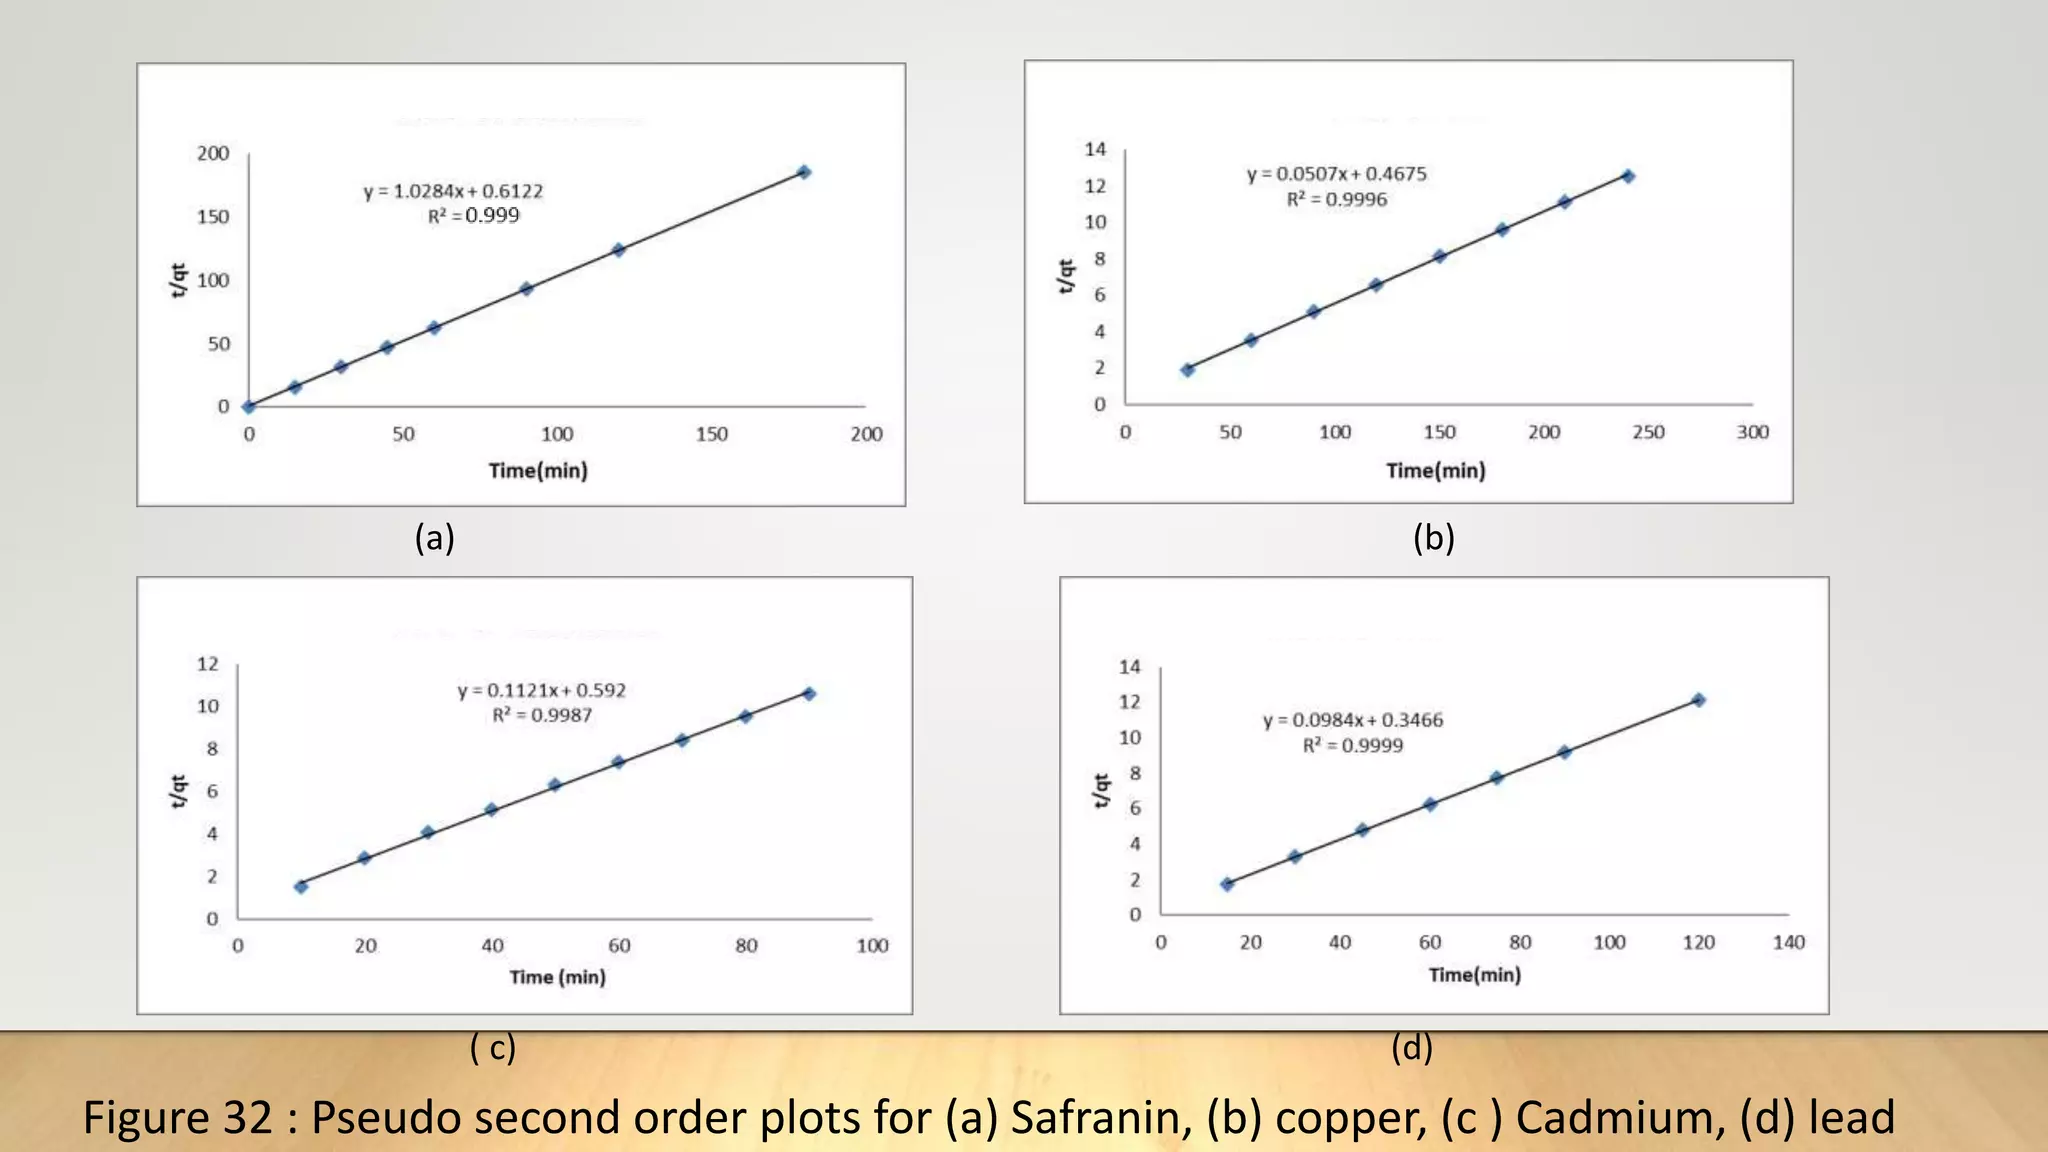
The Elovich[17] equation is mainly applicable for chemosorption kinetics the equation is often valid for
systems in which the adsorbing surface is heterogenous the model is expressed as
q𝑡=
1
β
ln(αβ)+
1
β
lnt ……………..(12)
Where α is initial adsorbate rate(mg g-1 min) and β is related to the extent of surface coverage and the
activation energy for chemosorption (g mg-1). A plot of q𝑡 vs ln t gives a linear trace with slope of (1/β )
and an intercept of 1/β ln (αβ).](https://image.slidesharecdn.com/payalphdslidesfinal1autosaved-210827172458/75/Payal-phd-slides-final1-autosaved-14-2048.jpg)
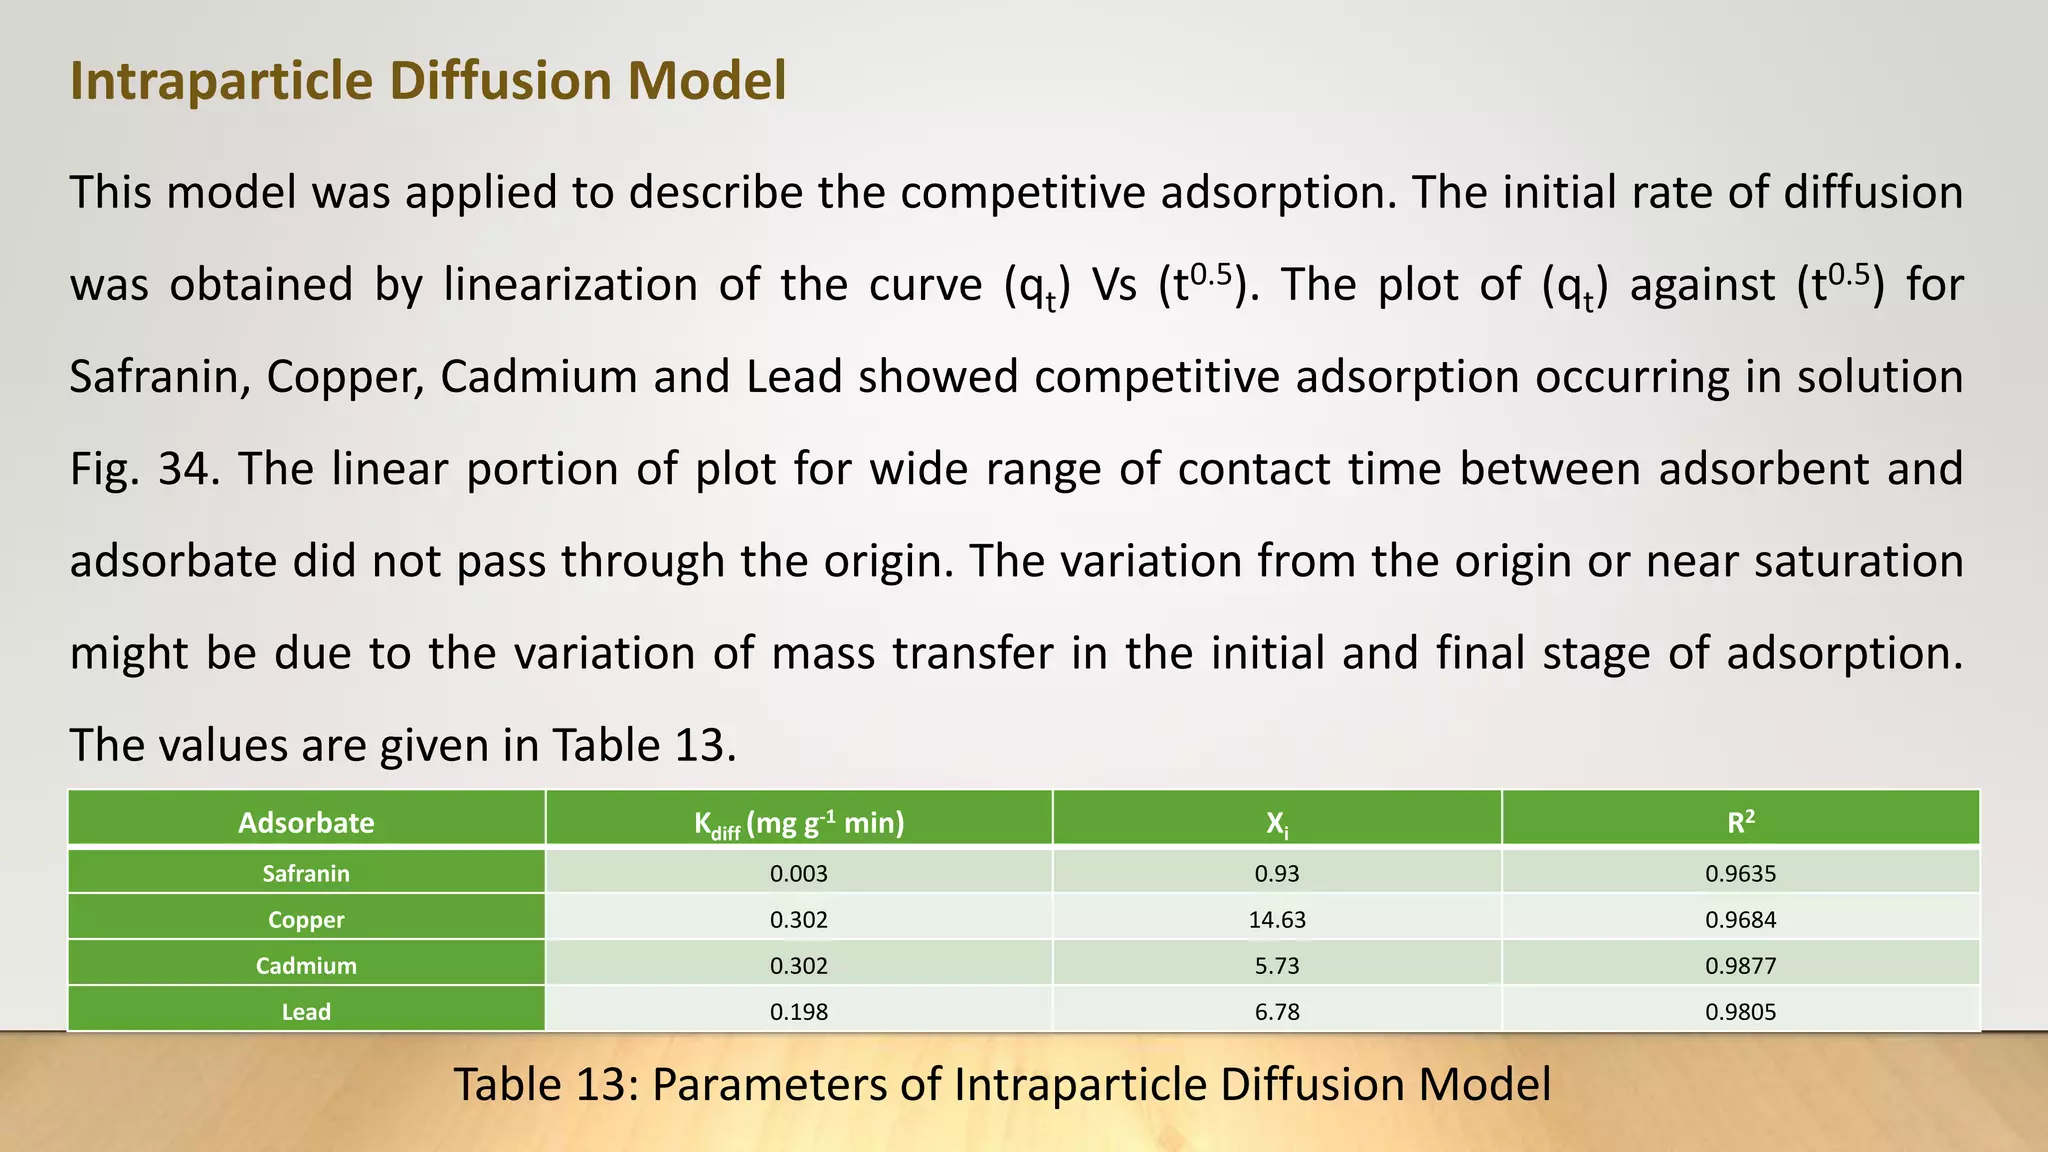
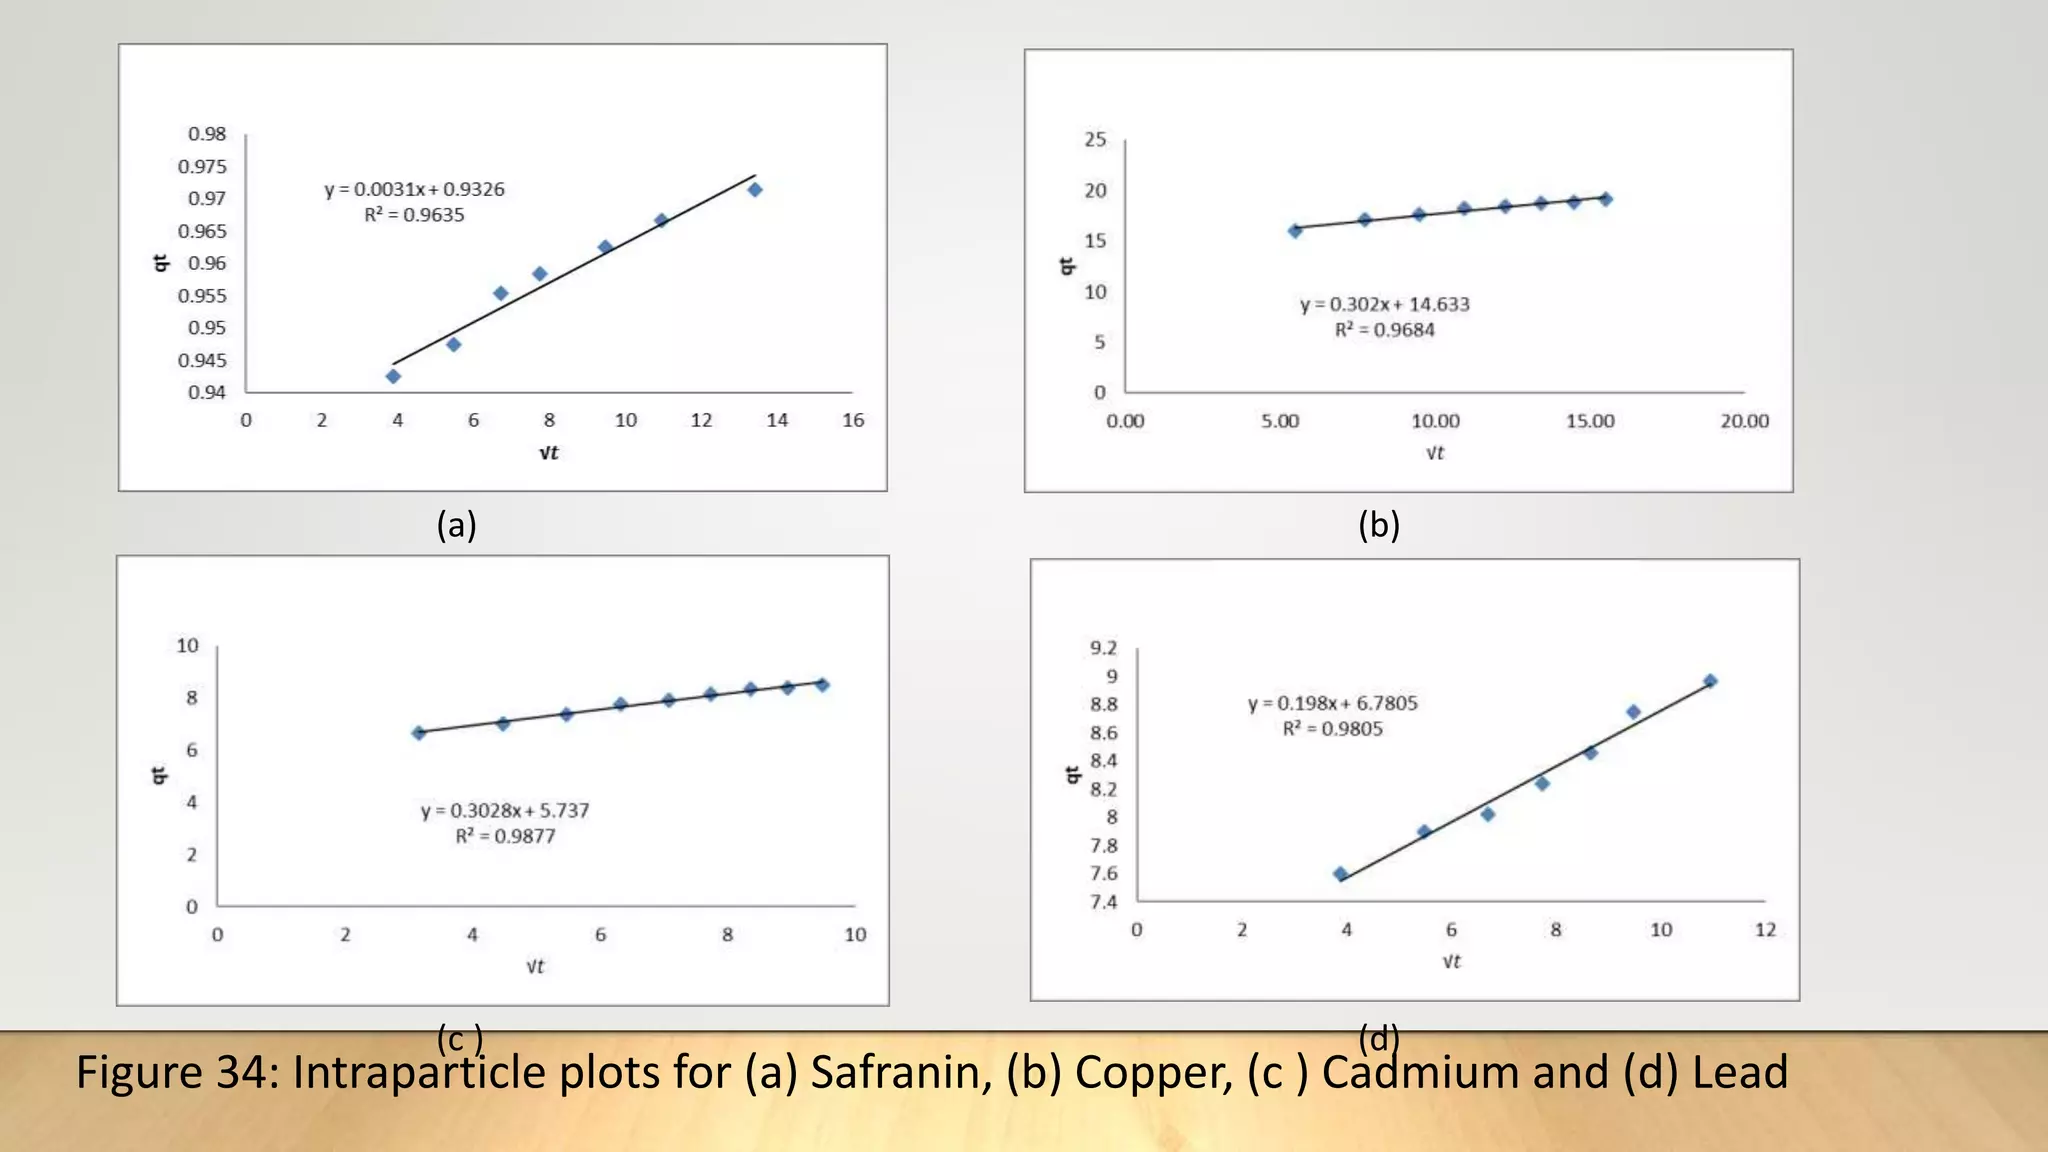
![Intra particle diffusion model
The intra particle diffusion model (Weber and Morris. 1962) was applied to describe the competitive
adsorption. In a liquid-solid system, the fractional uptake of the solute on particle varies according to a
fraction of D the diffusivity within the particle and r is the particle radius. The initial rate of intra
particle diffusion are obtained by linearization of the curve q𝑡 = f (𝑡0.5)[18]. The plot of qt against 𝑡0.5
may present multi-linearity. This indicates that two or more steps occur in the adsorption processes.
The first sharper portion is external surface adsorption or instantaneous adsorption stage. The second
portion is the gradual adsorption stage where the intra particle diffusion is rate-controlled. The third
portion is the final equilibrium stage, where the intra particle diffusion starts to slow down due to the
extremely low solute concentration in solution
The diffusion model is expressed as :
q𝑡= K𝑖𝑑 𝑡0.5+ C ……………(13)
Where K𝑖𝑑 (mg/g 𝑚𝑖𝑛0.5) is the intraparticle diffusion rate constant q𝑡 , the amount of adsorbate
absorbed at time t and C(mg/g), a constant proportional to thickness of boundary layer.](https://image.slidesharecdn.com/payalphdslidesfinal1autosaved-210827172458/75/Payal-phd-slides-final1-autosaved-15-2048.jpg)
![0
r
Rate Expression:
According to the Fick's first law, the flux J(in moles per unit time and if, cross section, normal
to the path of flow) of the diffusing ion[19] can be expressed by equation (14)
…………..(14)
Where C is the concentration (in moles per unit volume), Di the effective diffusion coefficient
and r gives the direction along which transport is taking place.
Using the Fick’s second law, the governing differential equation for a spherical exchange bed
of radius ro in a solution can be expressed
……………….(15)
Using the proper boundary conditions, the solution of this equation has been obtained as an
infinite series i.e.
…………….(16)
r
C
D
J i
r
r
C
r
C
D
t
C
i
2
2
2
0
1
Q
Q
F t
](https://image.slidesharecdn.com/payalphdslidesfinal1autosaved-210827172458/75/Payal-phd-slides-final1-autosaved-16-2048.jpg)
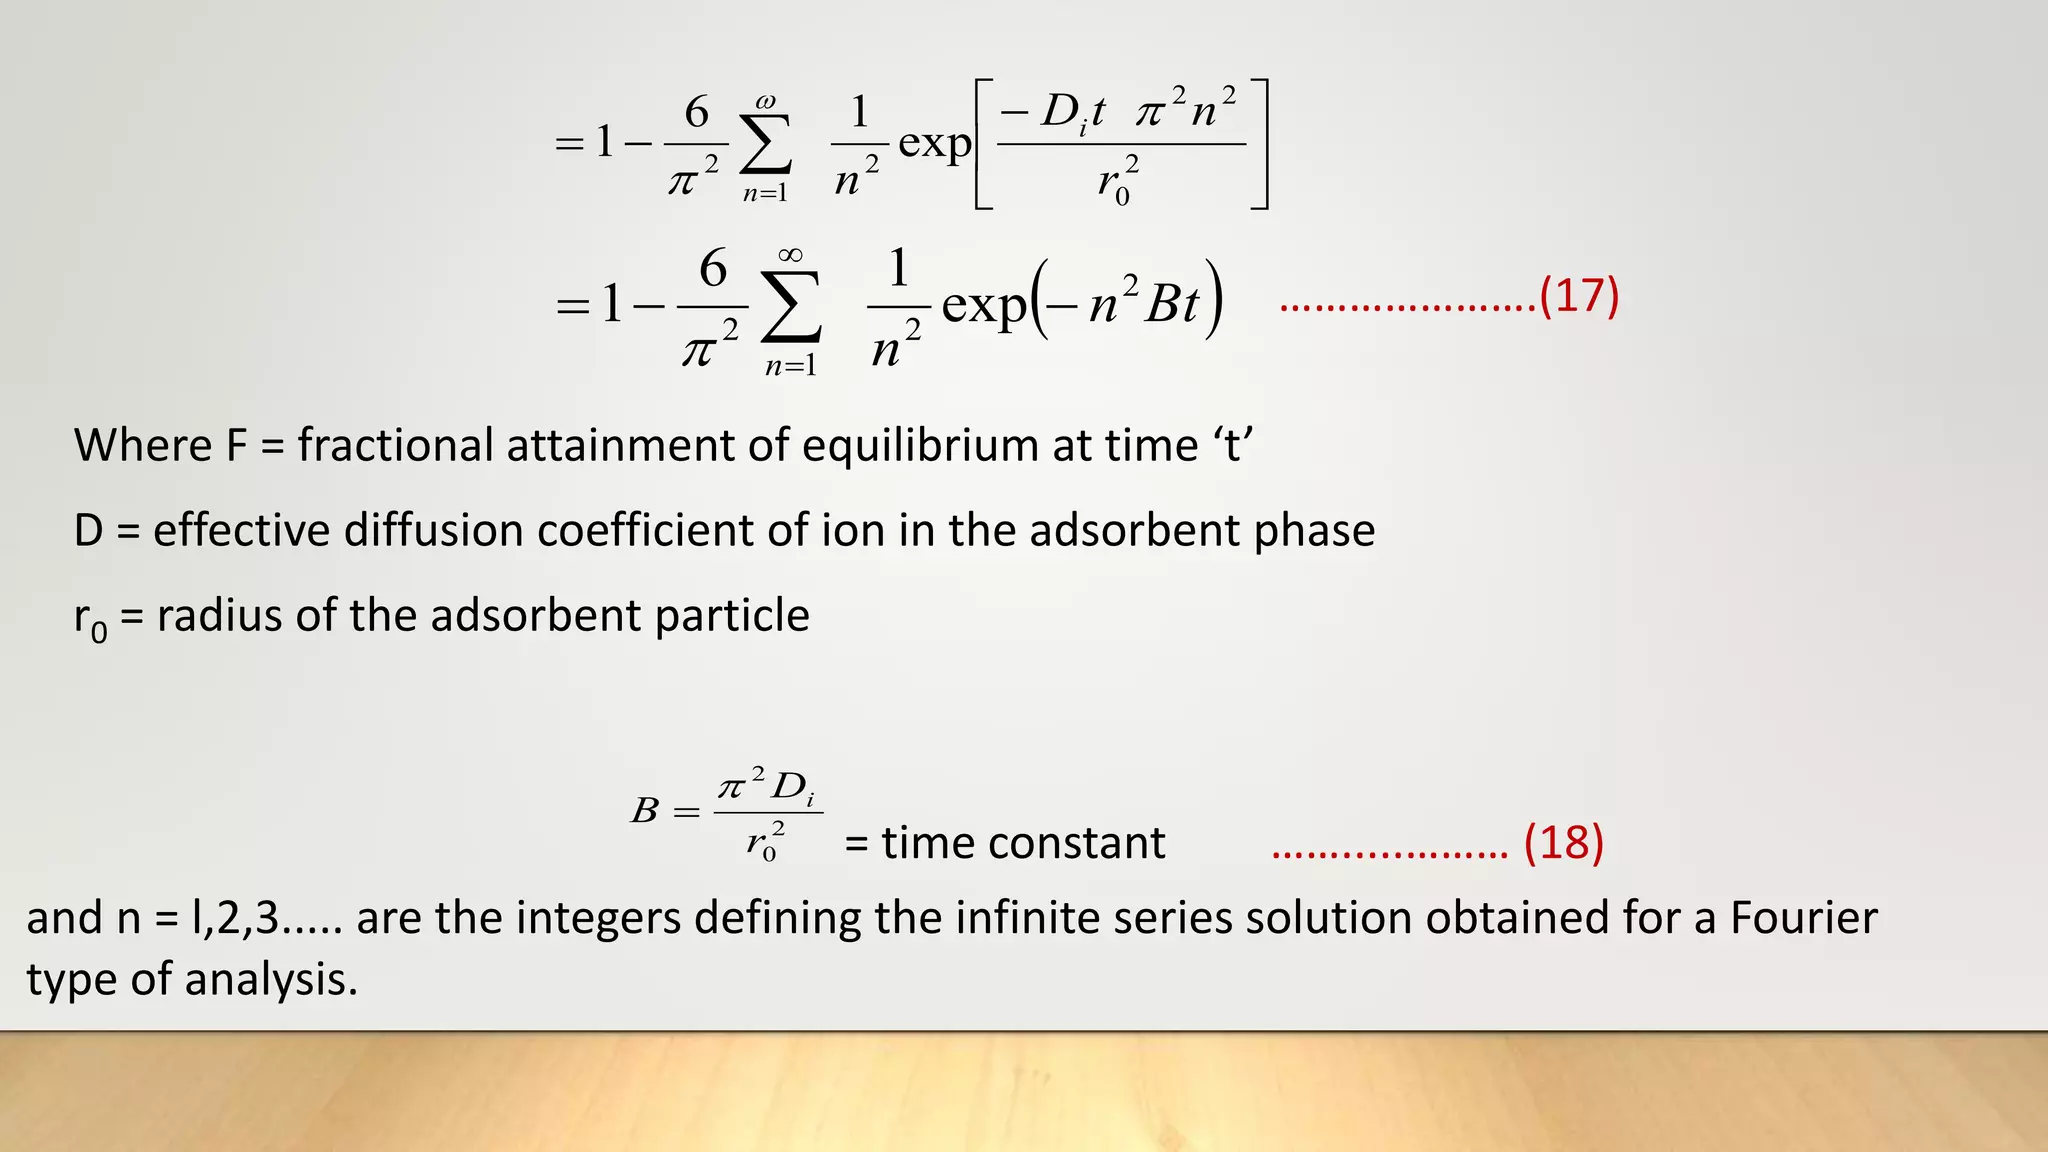
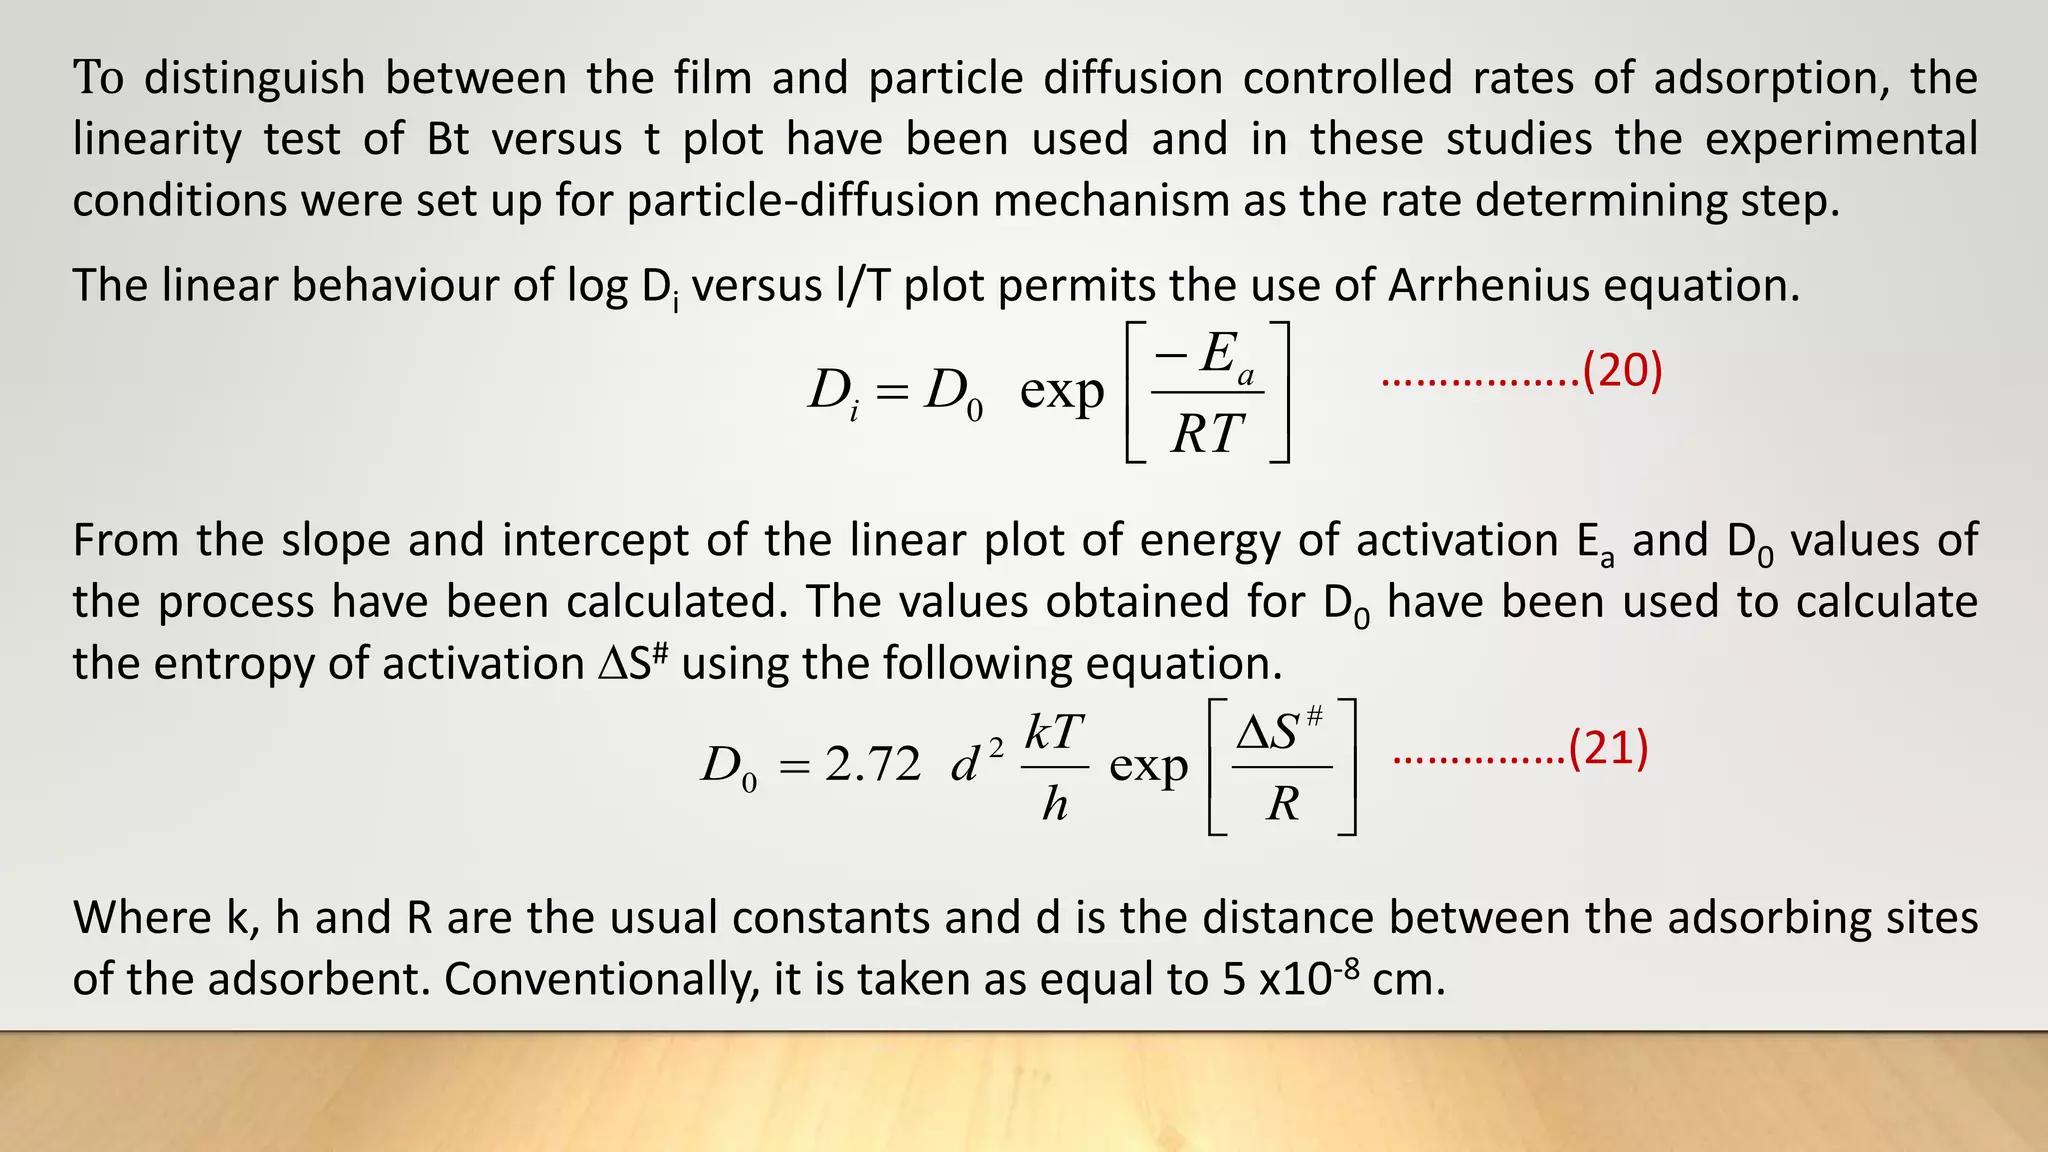
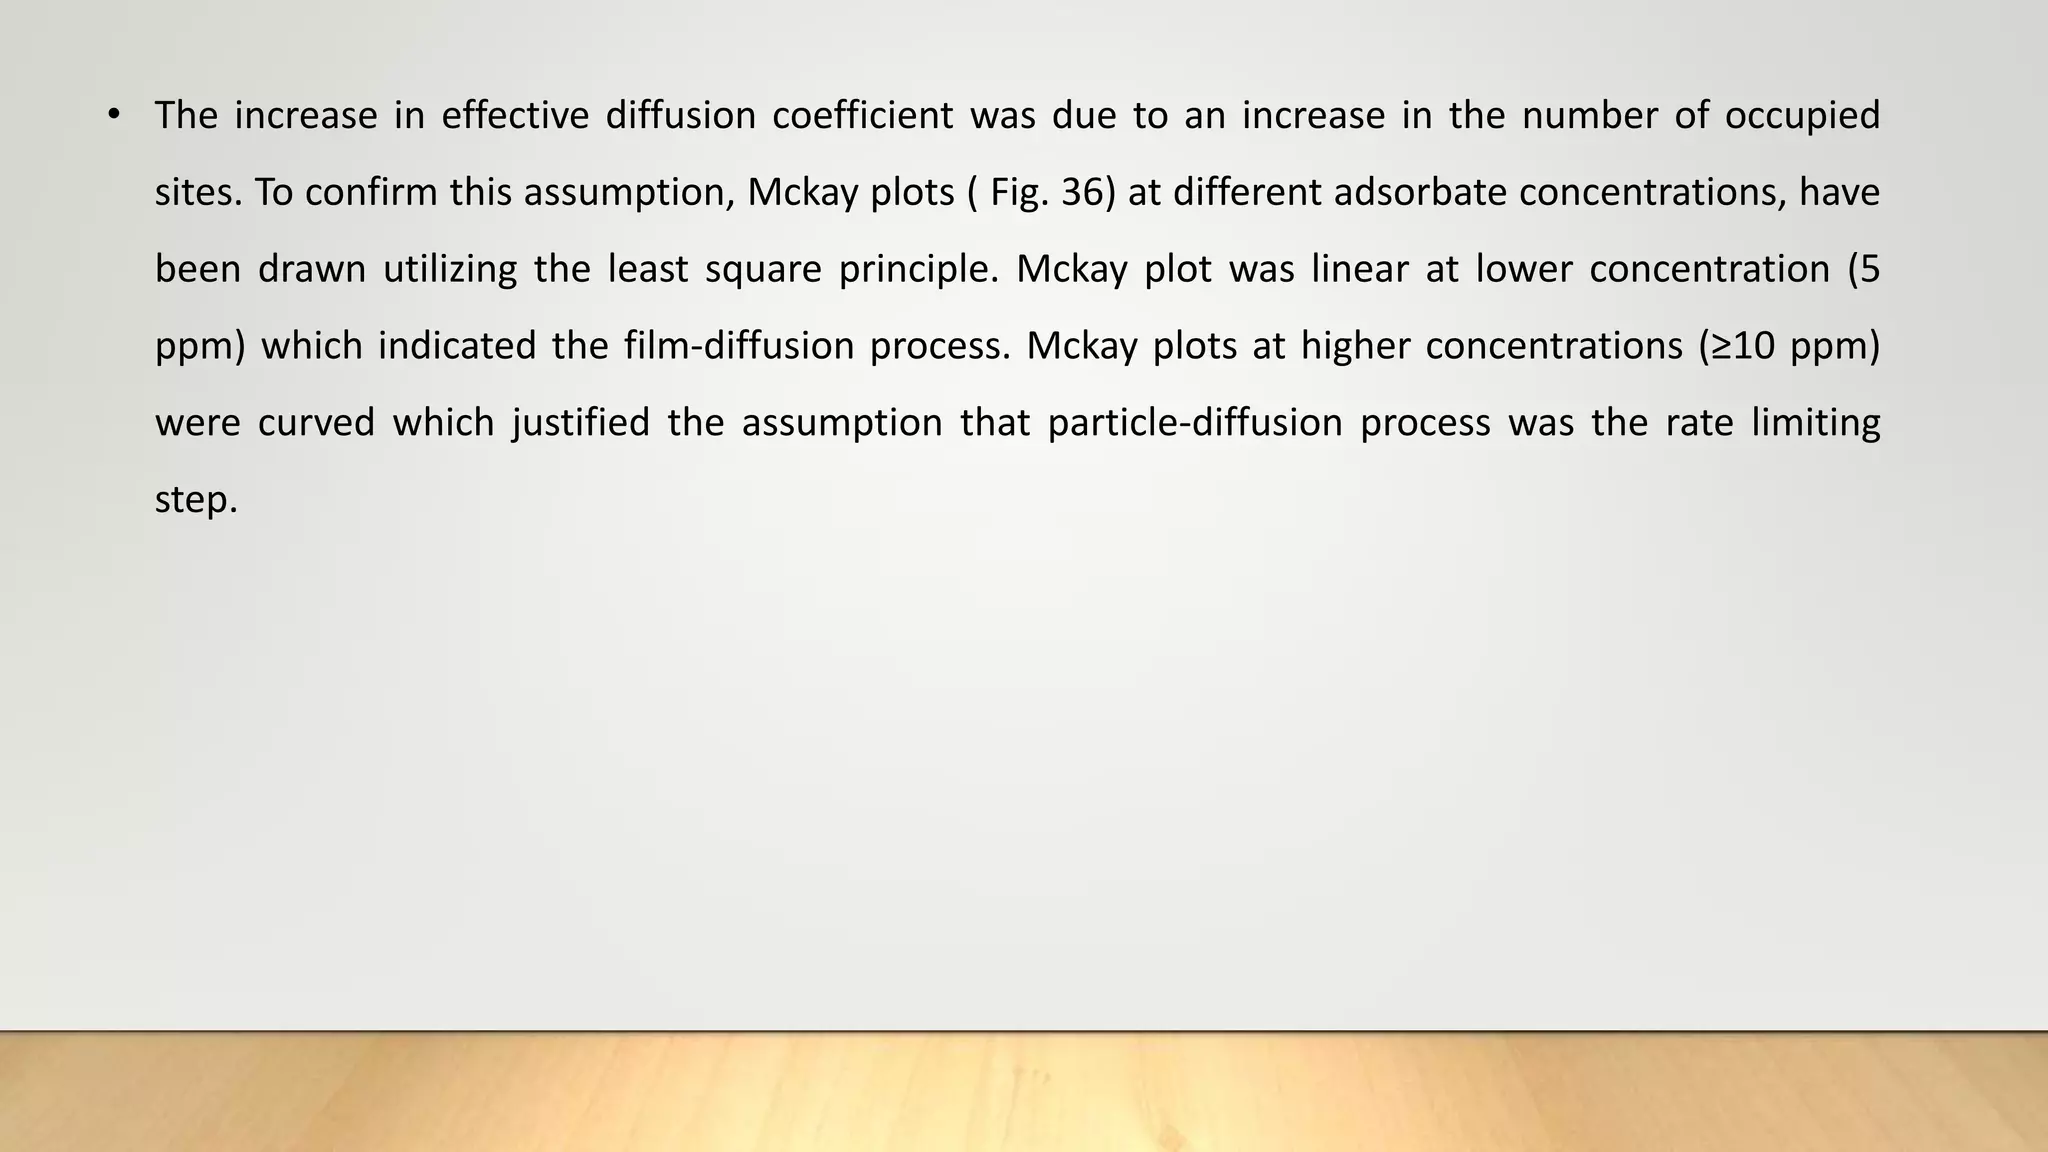
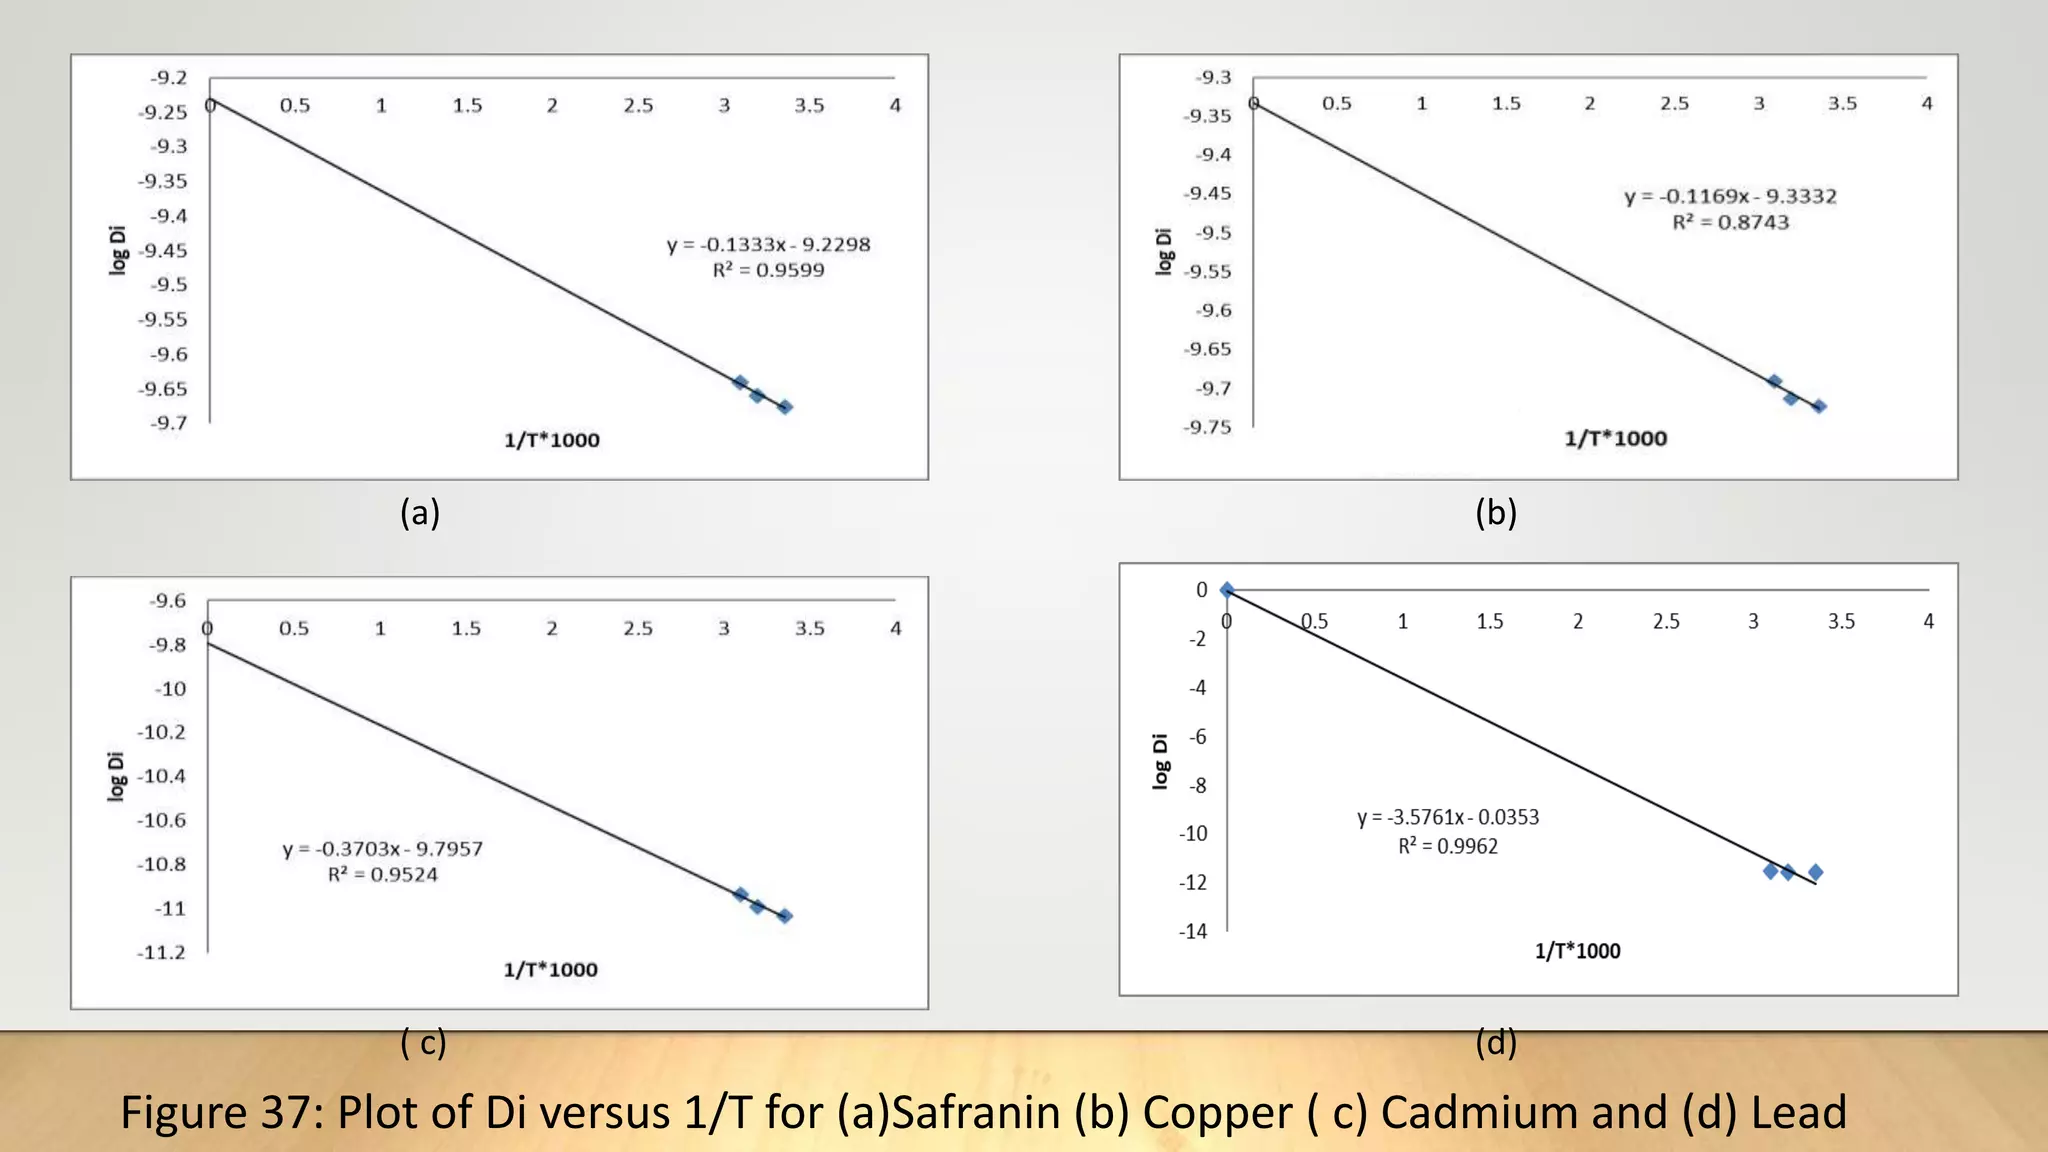
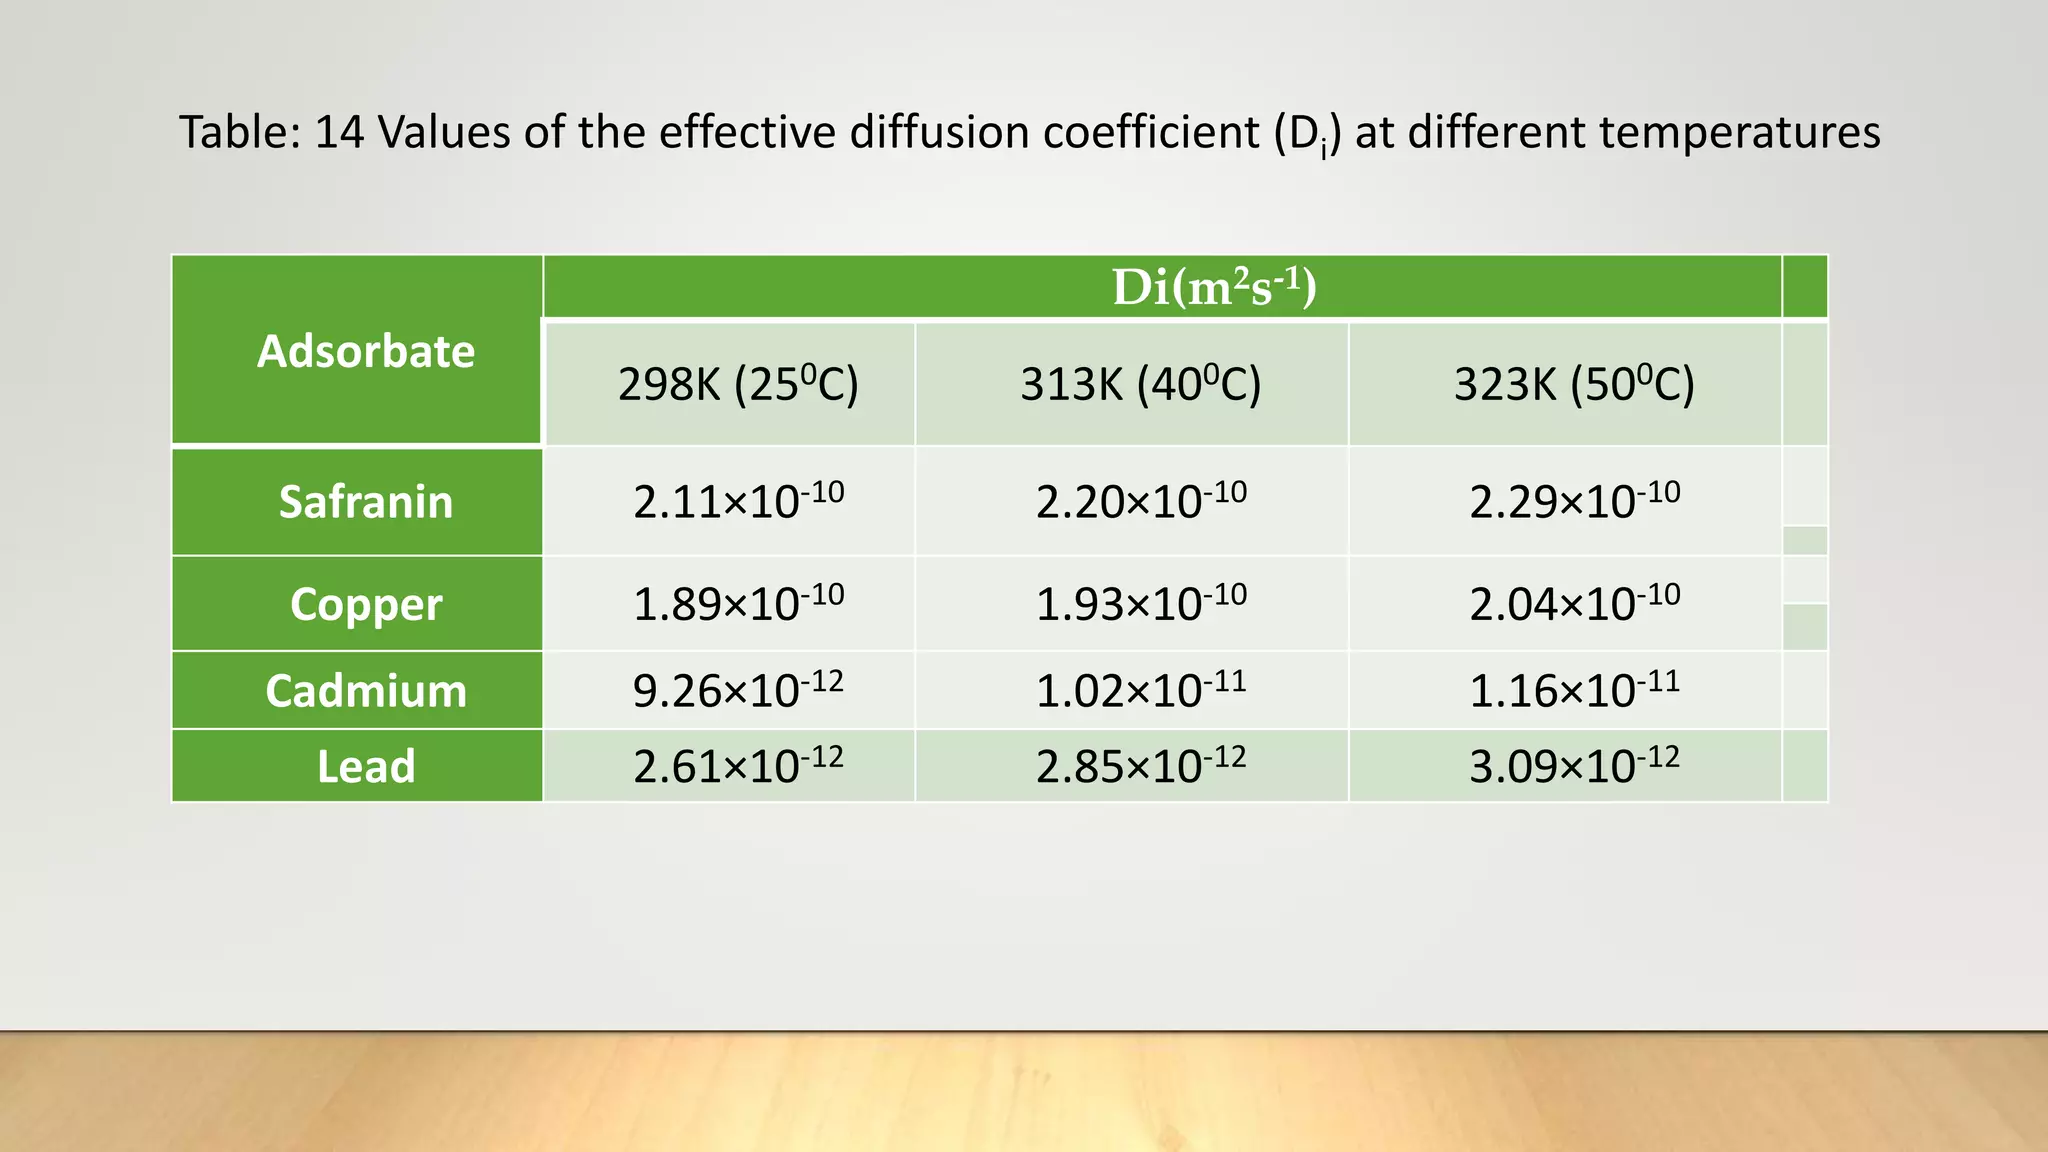
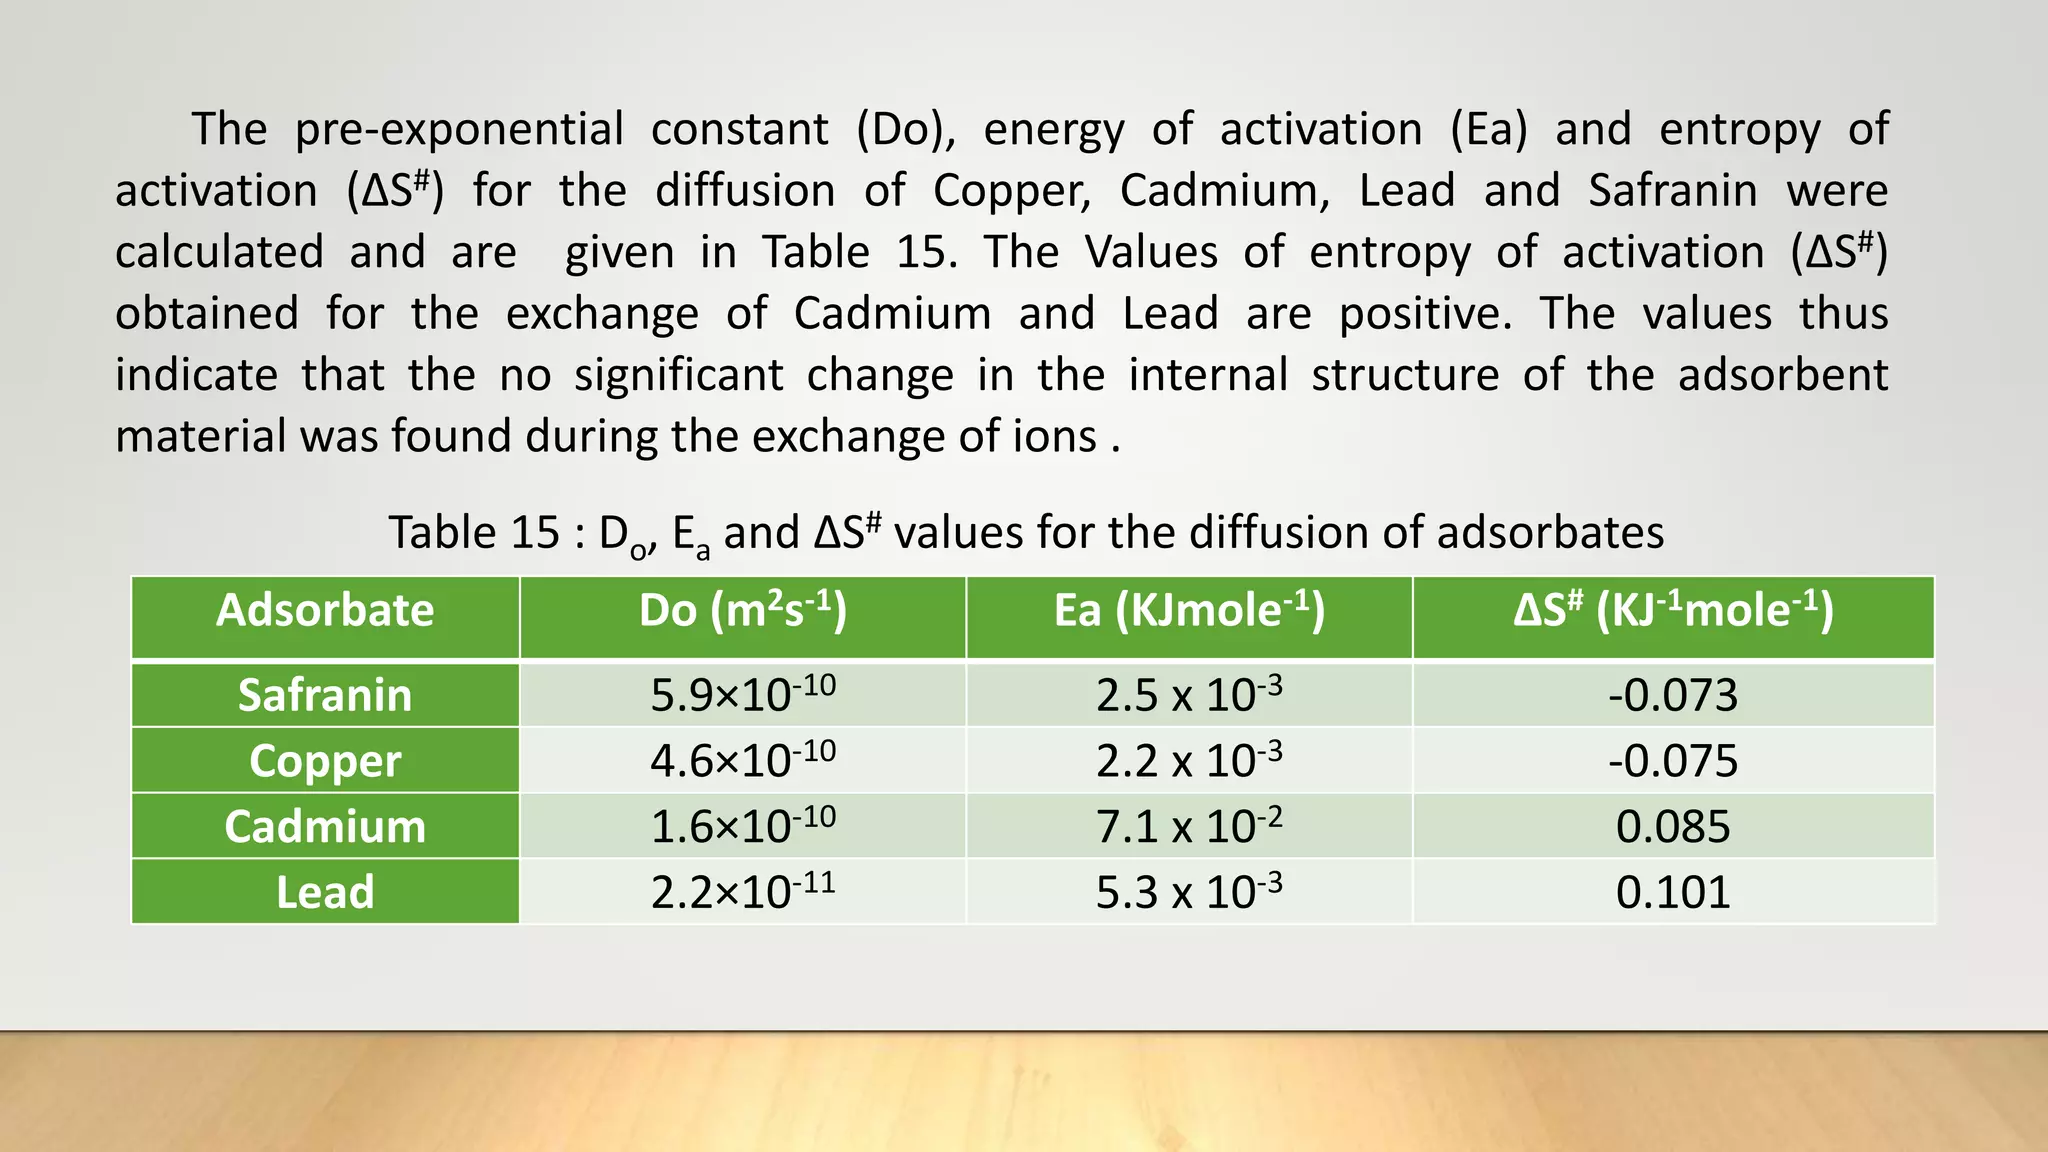
![Thus knowing the value of B and mean particle radius r0 ,the effective diffusion coefficient Di can
be calculated for an adsorption system.
From equation (17), the plot of Bt versus t must be straight line (of slope B) passing through the
origin provided the exchange rate is governed by particle-diffusion mechanism [20].
It is to be noted that the treatment is same with particle diffusion as controlling process as that
for isotopic exchange for which equation (17) is developed except that the self-diffusion
coefficient is replaced by effective diffusion coefficient of exchange ions [21].
The fractional attainment of equilibrium is determined by
…………….(19)
Where Qt= amount adsorbed after time‘t’
Q = amount adsorbed after infinite time or at equilibrium.
Reichenberg’s table[22] is used to obtain the corresponding Bt values for every observed value of
F.
Q
Q
F t](https://image.slidesharecdn.com/payalphdslidesfinal1autosaved-210827172458/75/Payal-phd-slides-final1-autosaved-18-2048.jpg)
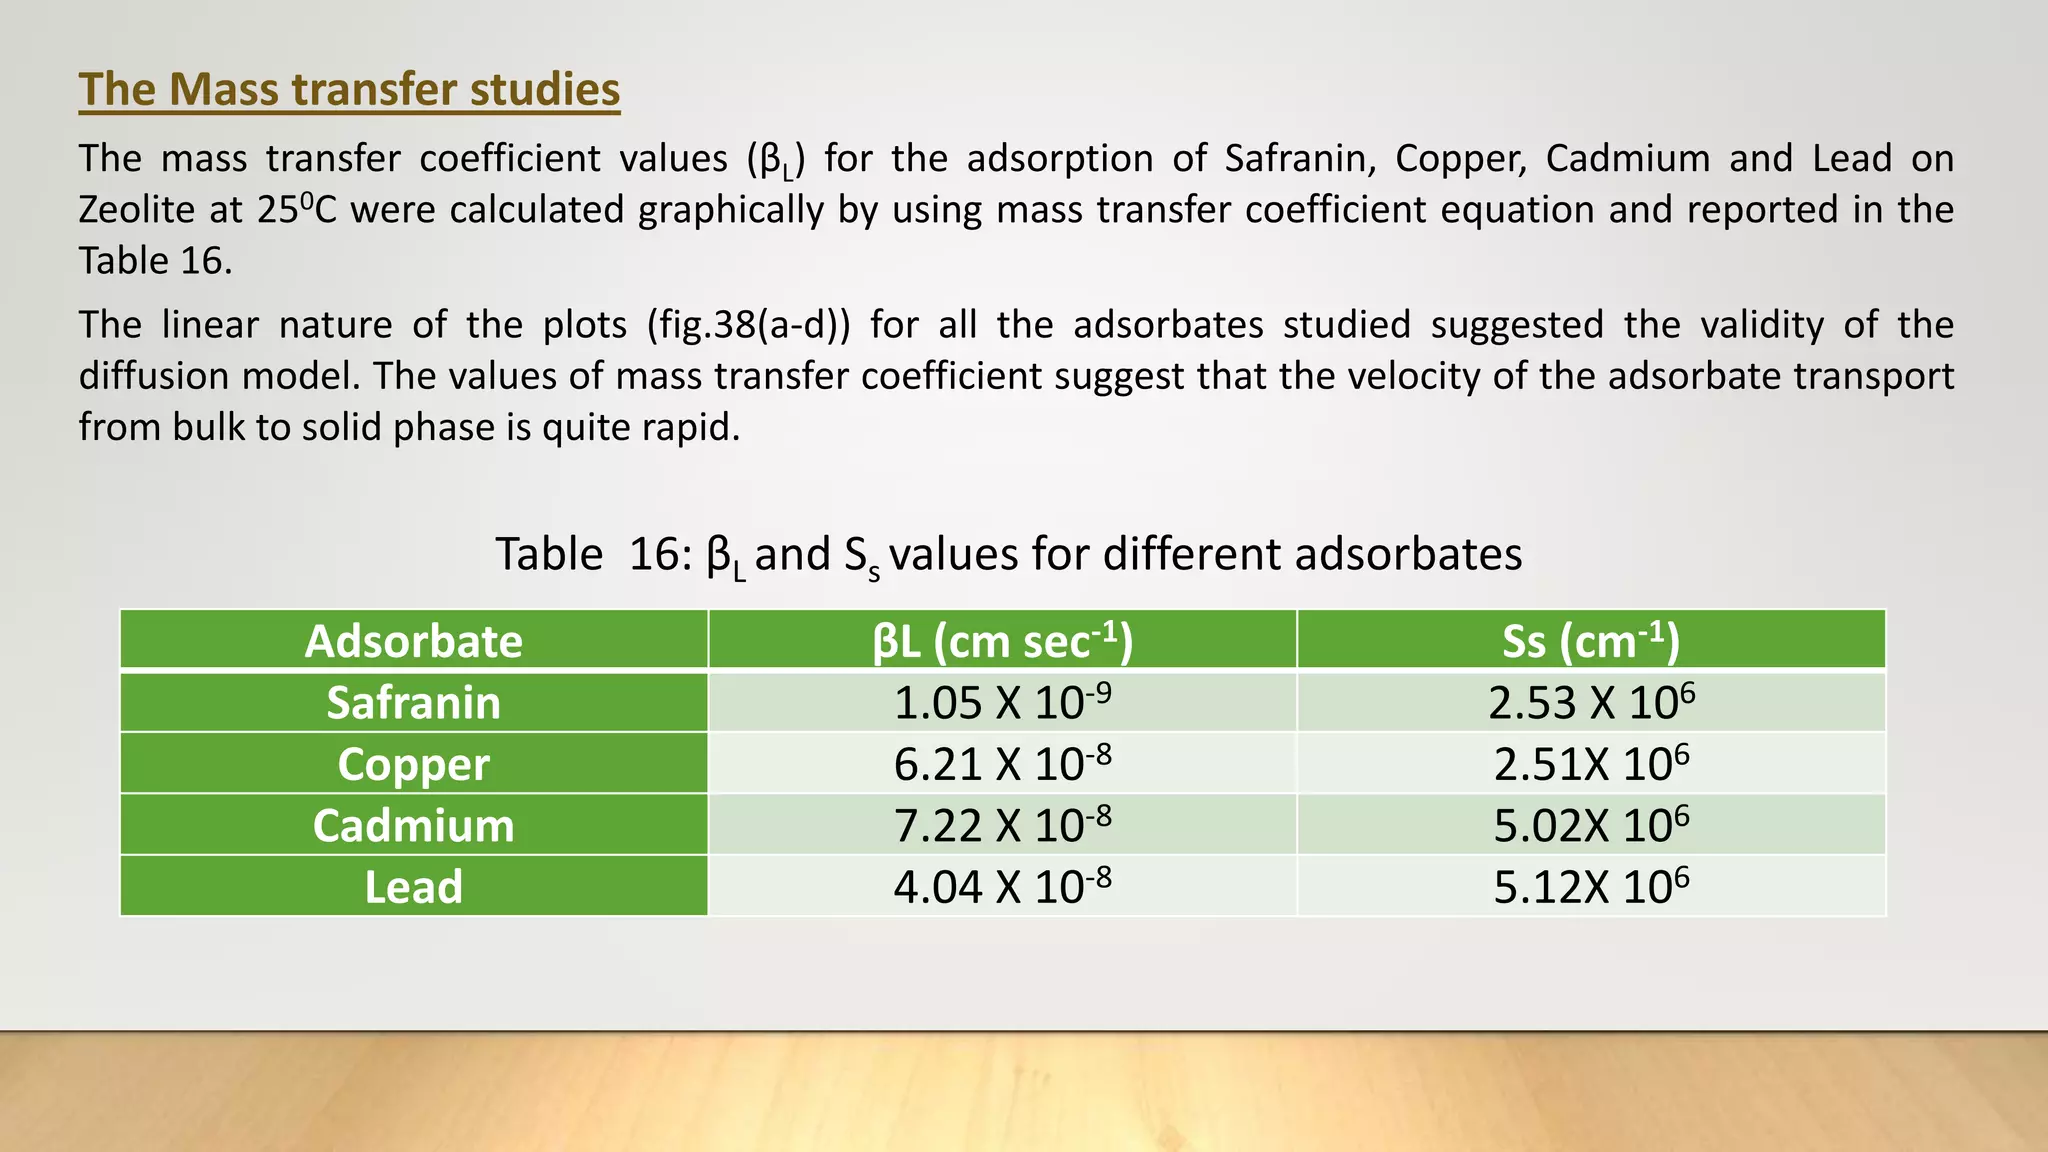
![The mass transfer study: The mass transfer coefficient values (βL) for the adsorption of
Copper, Cadmium, Lead and Safranin on Zeolite at 250 C were calculated graphically (fig.
38, 39 and 40) by using equation (mass transfer coefficient equation) .
ln [Ct/Co – 1/ 1+mk] = ln mk/1+mk – 1+mk/mk βLSst ……………….(22)
Ss = C0m / (1-€p) dpϼp ………………..(23)
Where, Ct = concentration of adsorbate after time t
C0 = Initial adsorbate concentration
M = mass of adsorbent per unit volume of particle free adsorbent solution
k = Langmuir constant obtained by multiplying adsorption capacity Qm and adsorption
energy b
βL = Mass transfer coefficient
Ss = Outer surface of the adsorbent per unit volume
€p = Porosity of adsorbent
dp = Particle diameter (cm)
ϼp = Density of adsorbent](https://image.slidesharecdn.com/payalphdslidesfinal1autosaved-210827172458/75/Payal-phd-slides-final1-autosaved-20-2048.jpg)
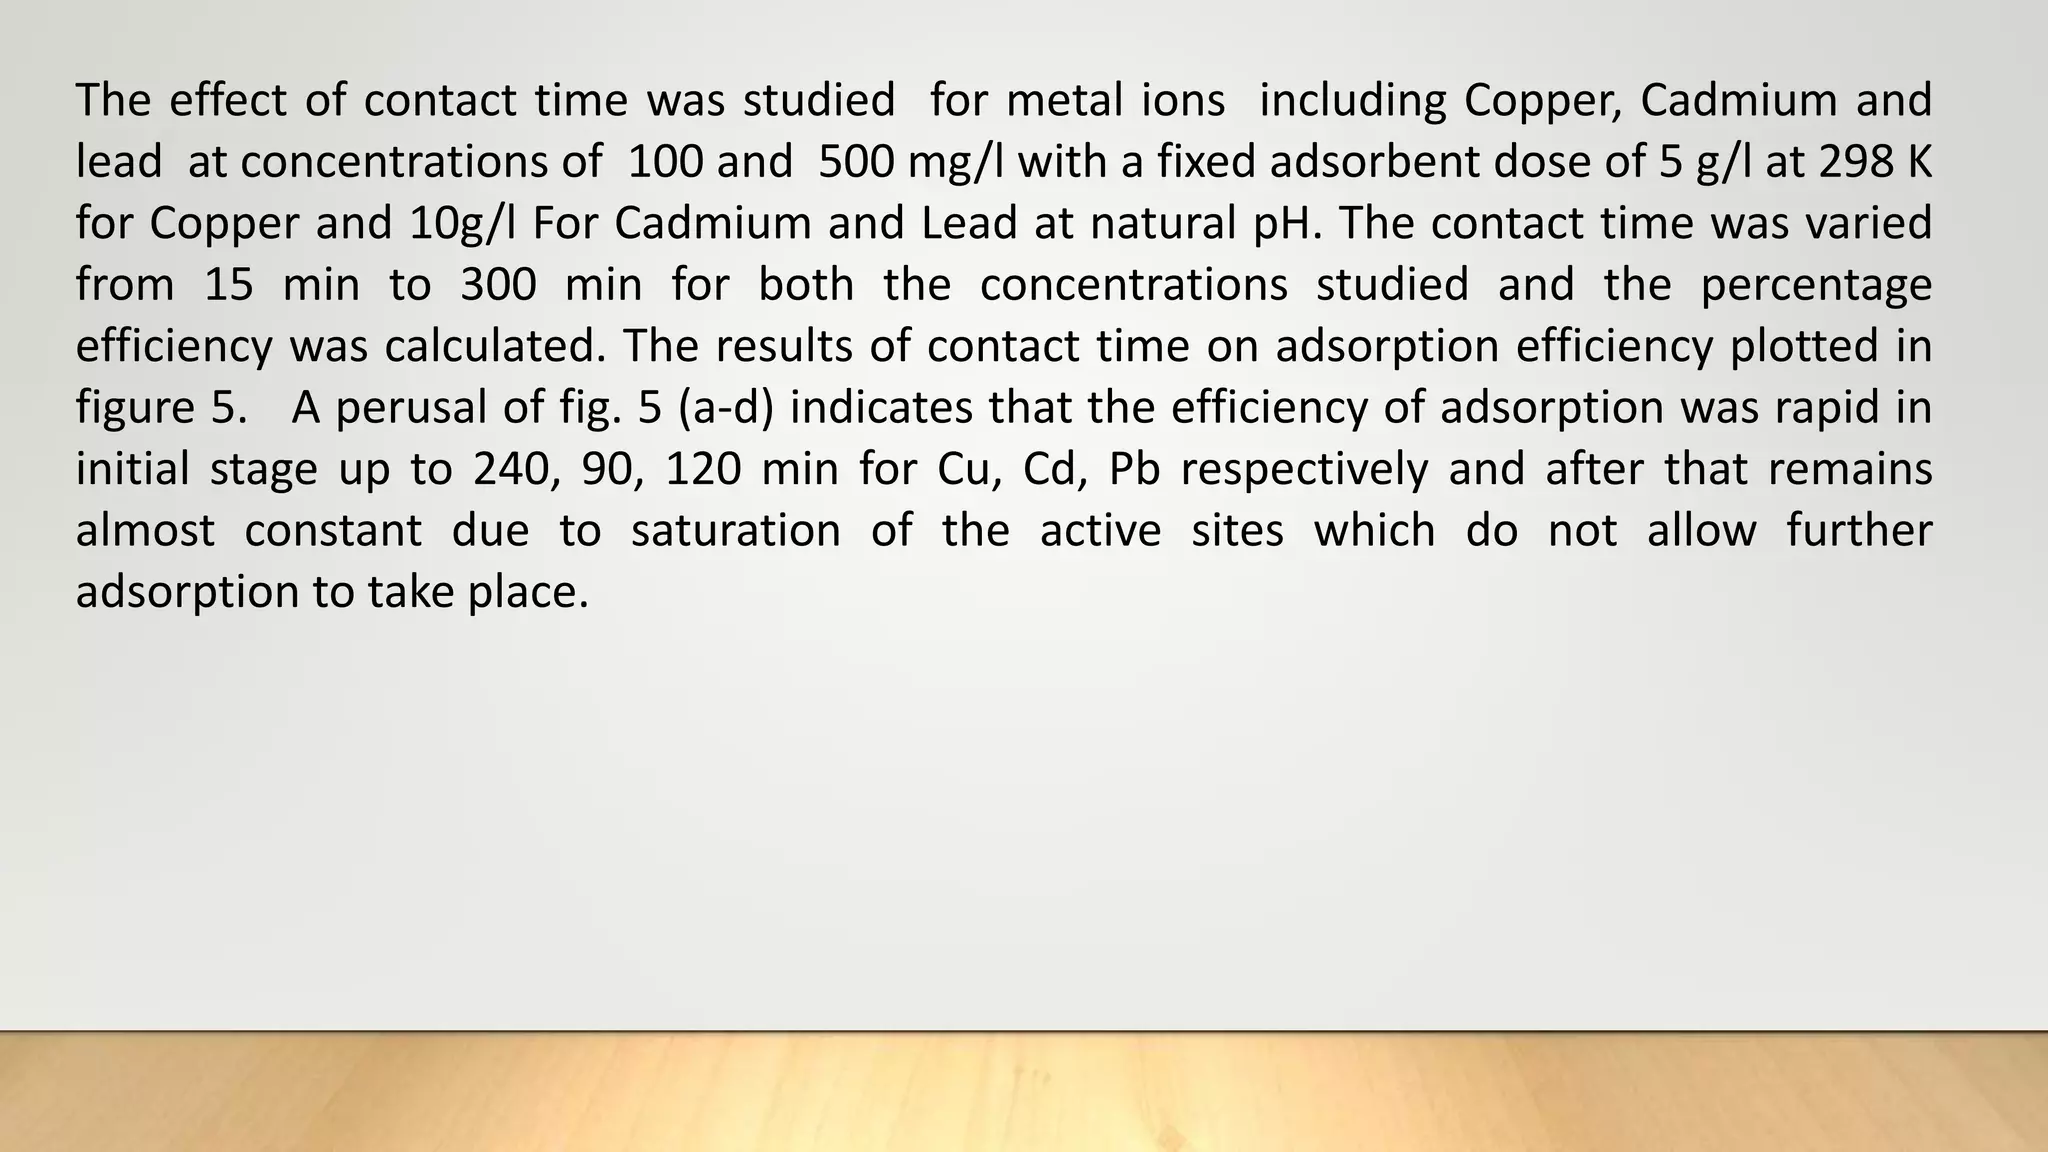
![Figure 38 : ln[Ct / C0 - 1/1+mk] vs. time plot for the mass transfer for (a) Safranin (b) Copper ( c) Cadmium
and (d) Lead at 298 K
(a) (b)
( c) (d)](https://image.slidesharecdn.com/payalphdslidesfinal1autosaved-210827172458/75/Payal-phd-slides-final1-autosaved-74-2048.jpg)