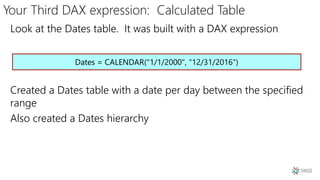
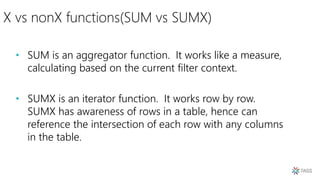
Downloaded 51 times


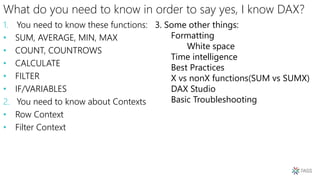


![Your first DAX expression
Check Power BI Desktop tab “Your First DAX Expression”
It’s a calculated column called Order Line Total
Meant to add a column to every record in a table.
Order Line Total = 'Sales OrderDetails'[qty] * 'Sales OrderDetails'[unitprice]](https://image.slidesharecdn.com/pass2018introductiontodax-181107164142/85/Pass-2018-introduction-to-dax-7-320.jpg)
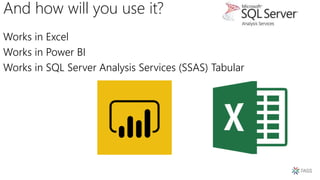
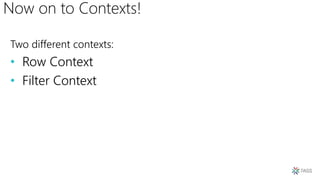
![Your Second DAX Expression
Check Power BI Desktop tab “Your Second DAX Expression”
This is a measure
Meant to perform an aggregation that we can slice & dice
Total Sales = SUM('Sales OrderDetails'[Order Line Total])](https://image.slidesharecdn.com/pass2018introductiontodax-181107164142/85/Pass-2018-introduction-to-dax-8-320.jpg)
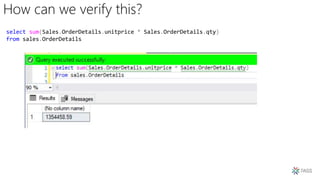
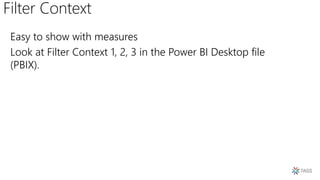
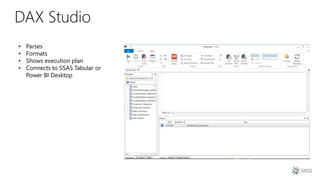
![DAX Expression Breakdown
Name the
measure.
You’ll use
that in the
visualizatio
n
Built in DAX formula
Table name
Column nameEquals sign
separates
expression name
from expression
formula
Total Sales = SUM('Sales OrderDetails'[Ordera Line Total])](https://image.slidesharecdn.com/pass2018introductiontodax-181107164142/85/Pass-2018-introduction-to-dax-10-320.jpg)
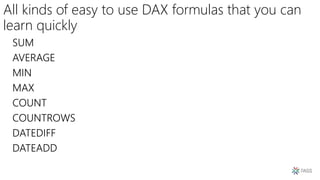
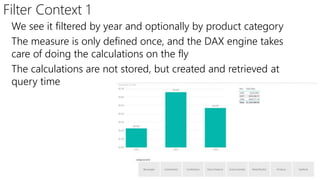
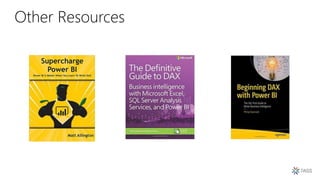
![Look at tab “Easy DAX built-in formulas”
Look under the Orders table for the calculated column “Days to
Ship”
Look under Orders table for measure “Average Days to Ship
Days To Ship = DATEDIFF('Sales Orders'[orderdate], 'Sales Orders'[shippeddate],DAY)
Play again: AVERAGE and DATEDIFF
Average Days to Ship = AVERAGE('Sales Orders'[Days To Ship])](https://image.slidesharecdn.com/pass2018introductiontodax-181107164142/85/Pass-2018-introduction-to-dax-12-320.jpg)
![Row Context
We already know how this works! We’ve been using it for all of
our calculated columns. Let’s revisit our first DAX Expression
Notice we expect a value per row in a table
This runs at import and gets stored
Might increase file size
Order Line Total = 'Sales OrderDetails'[qty] * 'Sales OrderDetails'[unitprice]](https://image.slidesharecdn.com/pass2018introductiontodax-181107164142/85/Pass-2018-introduction-to-dax-15-320.jpg)

![CALCULATE: Breaking out of the filter context
Beverages Total Sales = CALCULATE
(
SUM('Sales OrderDetails'[Order Line Total])
, 'Production Categories'[categoryname] = "Beverages"
)
AGGREGATION
FILTER
Look at the tab CALCULATE](https://image.slidesharecdn.com/pass2018introductiontodax-181107164142/85/Pass-2018-introduction-to-dax-21-320.jpg)
![CALCULATE: Over Multiple Tables
Total Sales - Beverages in USA = CALCULATE(
sum('Sales OrderDetails'[Order Line Total])
, 'Production Categories'[categoryname]= "Beverages"
, 'Sales Customers'[country] = "USA"
)](https://image.slidesharecdn.com/pass2018introductiontodax-181107164142/85/Pass-2018-introduction-to-dax-23-320.jpg)
![VALUES
Returns a virtual table
• A table that’s created in memory, but has a relationship with existing tables
Returns a single column table that respects the current filter
context
Country Count = COUNTROWS(
VALUES('Sales Orders'[shipcountry]))
Country Count wo VALUES = COUNTROWS('Sales Orders’)](https://image.slidesharecdn.com/pass2018introductiontodax-181107164142/85/Pass-2018-introduction-to-dax-26-320.jpg)
![ALL
Removes all current filters from the filter context
Could be renamed “remove filter”
Country Count Total = COUNTROWS(All('Sales
Orders'[shipcountry]))](https://image.slidesharecdn.com/pass2018introductiontodax-181107164142/85/Pass-2018-introduction-to-dax-27-320.jpg)
![FILTER
Total Sales For Customers with Minimum Order Count v2 =
VAR MinimumOrderCount = 10
VAR CustomersWithMinimumOrders = FILTER('Sales Customers', [Number of Orders] >
MinimumOrderCount)
VAR CustomersWithMinimumOrdersResult = CALCULATE
(
sum('Sales OrderDetails'[Order Line Total])
, CustomersWithMinimumOrders
)
RETURN CustomersWithMinimumOrdersResult](https://image.slidesharecdn.com/pass2018introductiontodax-181107164142/85/Pass-2018-introduction-to-dax-29-320.jpg)
![FILTER – Use simple formulas too
Number of Orders = COUNT('Sales Orders'[orderid])
Number of US Orders = CALCULATE
(
COUNT
(
'Sales OrderDetails'[orderid]
)
, FILTER
(
'Sales Customers'
, 'Sales Customers'[country] = "USA"
)
)](https://image.slidesharecdn.com/pass2018introductiontodax-181107164142/85/Pass-2018-introduction-to-dax-30-320.jpg)
![FILTER – Create Table
Minimum Order Customers =
VAR MinimumOrderCount = 10
var CustomersWithMinimumOrders = FILTER('Sales Customers', [Number of Orders] > MinimumOrderCount)
RETURN CustomersWithMinimumOrders](https://image.slidesharecdn.com/pass2018introductiontodax-181107164142/85/Pass-2018-introduction-to-dax-31-320.jpg)
![VARIABLES & RETURN
Total Sales For Customers with Minimum Order Count =
VAR MinimumOrderCount = 5
VAR CustomersWithMinimumOrders = CALCULATE
(
sum('Sales OrderDetails'[Order Line Total])
, FILTER('Sales Customers', [Number of Orders] >
MinimumOrderCount)
)
RETURN CustomersWithMinimumOrders](https://image.slidesharecdn.com/pass2018introductiontodax-181107164142/85/Pass-2018-introduction-to-dax-32-320.jpg)
![Time Intelligence: TOTALYTD
YTD Total Sales = TOTALYTD
(
SUM('Sales OrderDetails'[Order Line Total])
, Dates[Date].[Date]
)](https://image.slidesharecdn.com/pass2018introductiontodax-181107164142/85/Pass-2018-introduction-to-dax-35-320.jpg)
![Time Intelligence: PREVIOUSMONTH
Total Sales Previous Month = CALCULATE
(
sum('Sales OrderDetails'[Order Line Total])
, PREVIOUSMONTH(Dates[Date])
)](https://image.slidesharecdn.com/pass2018introductiontodax-181107164142/85/Pass-2018-introduction-to-dax-36-320.jpg)
![SUM vs SUMX Example
Total Sales SUMX = SUMX(
'Sales OrderDetails'
, 'Sales OrderDetails'[qty] * 'Sales OrderDetails'[unitprice
)
Total Sales = SUM('Sales OrderDetails'[Order Line Total])](https://image.slidesharecdn.com/pass2018introductiontodax-181107164142/85/Pass-2018-introduction-to-dax-38-320.jpg)
![Best Practice: Formatting
• DAX Expressions can have lots of parentheses and square brackets
• Please use white space to control this
• Here’s an example of a properly formatted calculated column
• DaxFormatter.com
Days To Ship = DATEDIFF
(
'Sales Orders'[orderdate]
, 'Sales Orders'[shippeddate]
, DAY
)](https://image.slidesharecdn.com/pass2018introductiontodax-181107164142/85/Pass-2018-introduction-to-dax-41-320.jpg)
![Manipulating the relationships
Total Sales By Ship Year = CALCULATE
(
SUM('Sales OrderDetails'[Order Line Total])
, USERELATIONSHIP('Sales Orders'[shippeddate],
Dates[Date])
)
Only one active relationship at a time](https://image.slidesharecdn.com/pass2018introductiontodax-181107164142/85/Pass-2018-introduction-to-dax-45-320.jpg)


The document is a guide to learning DAX (Data Analysis Expressions), detailing essential functions, contexts, and expressions needed to work effectively with DAX in tools like Power BI, Excel, and SQL Server Analysis Services. It provides practical examples of creating calculated columns and measures, as well as best practices for organizing and naming codes. Additionally, it highlights common troubleshooting issues and directs users to resources for further learning and support.


