Download to read offline
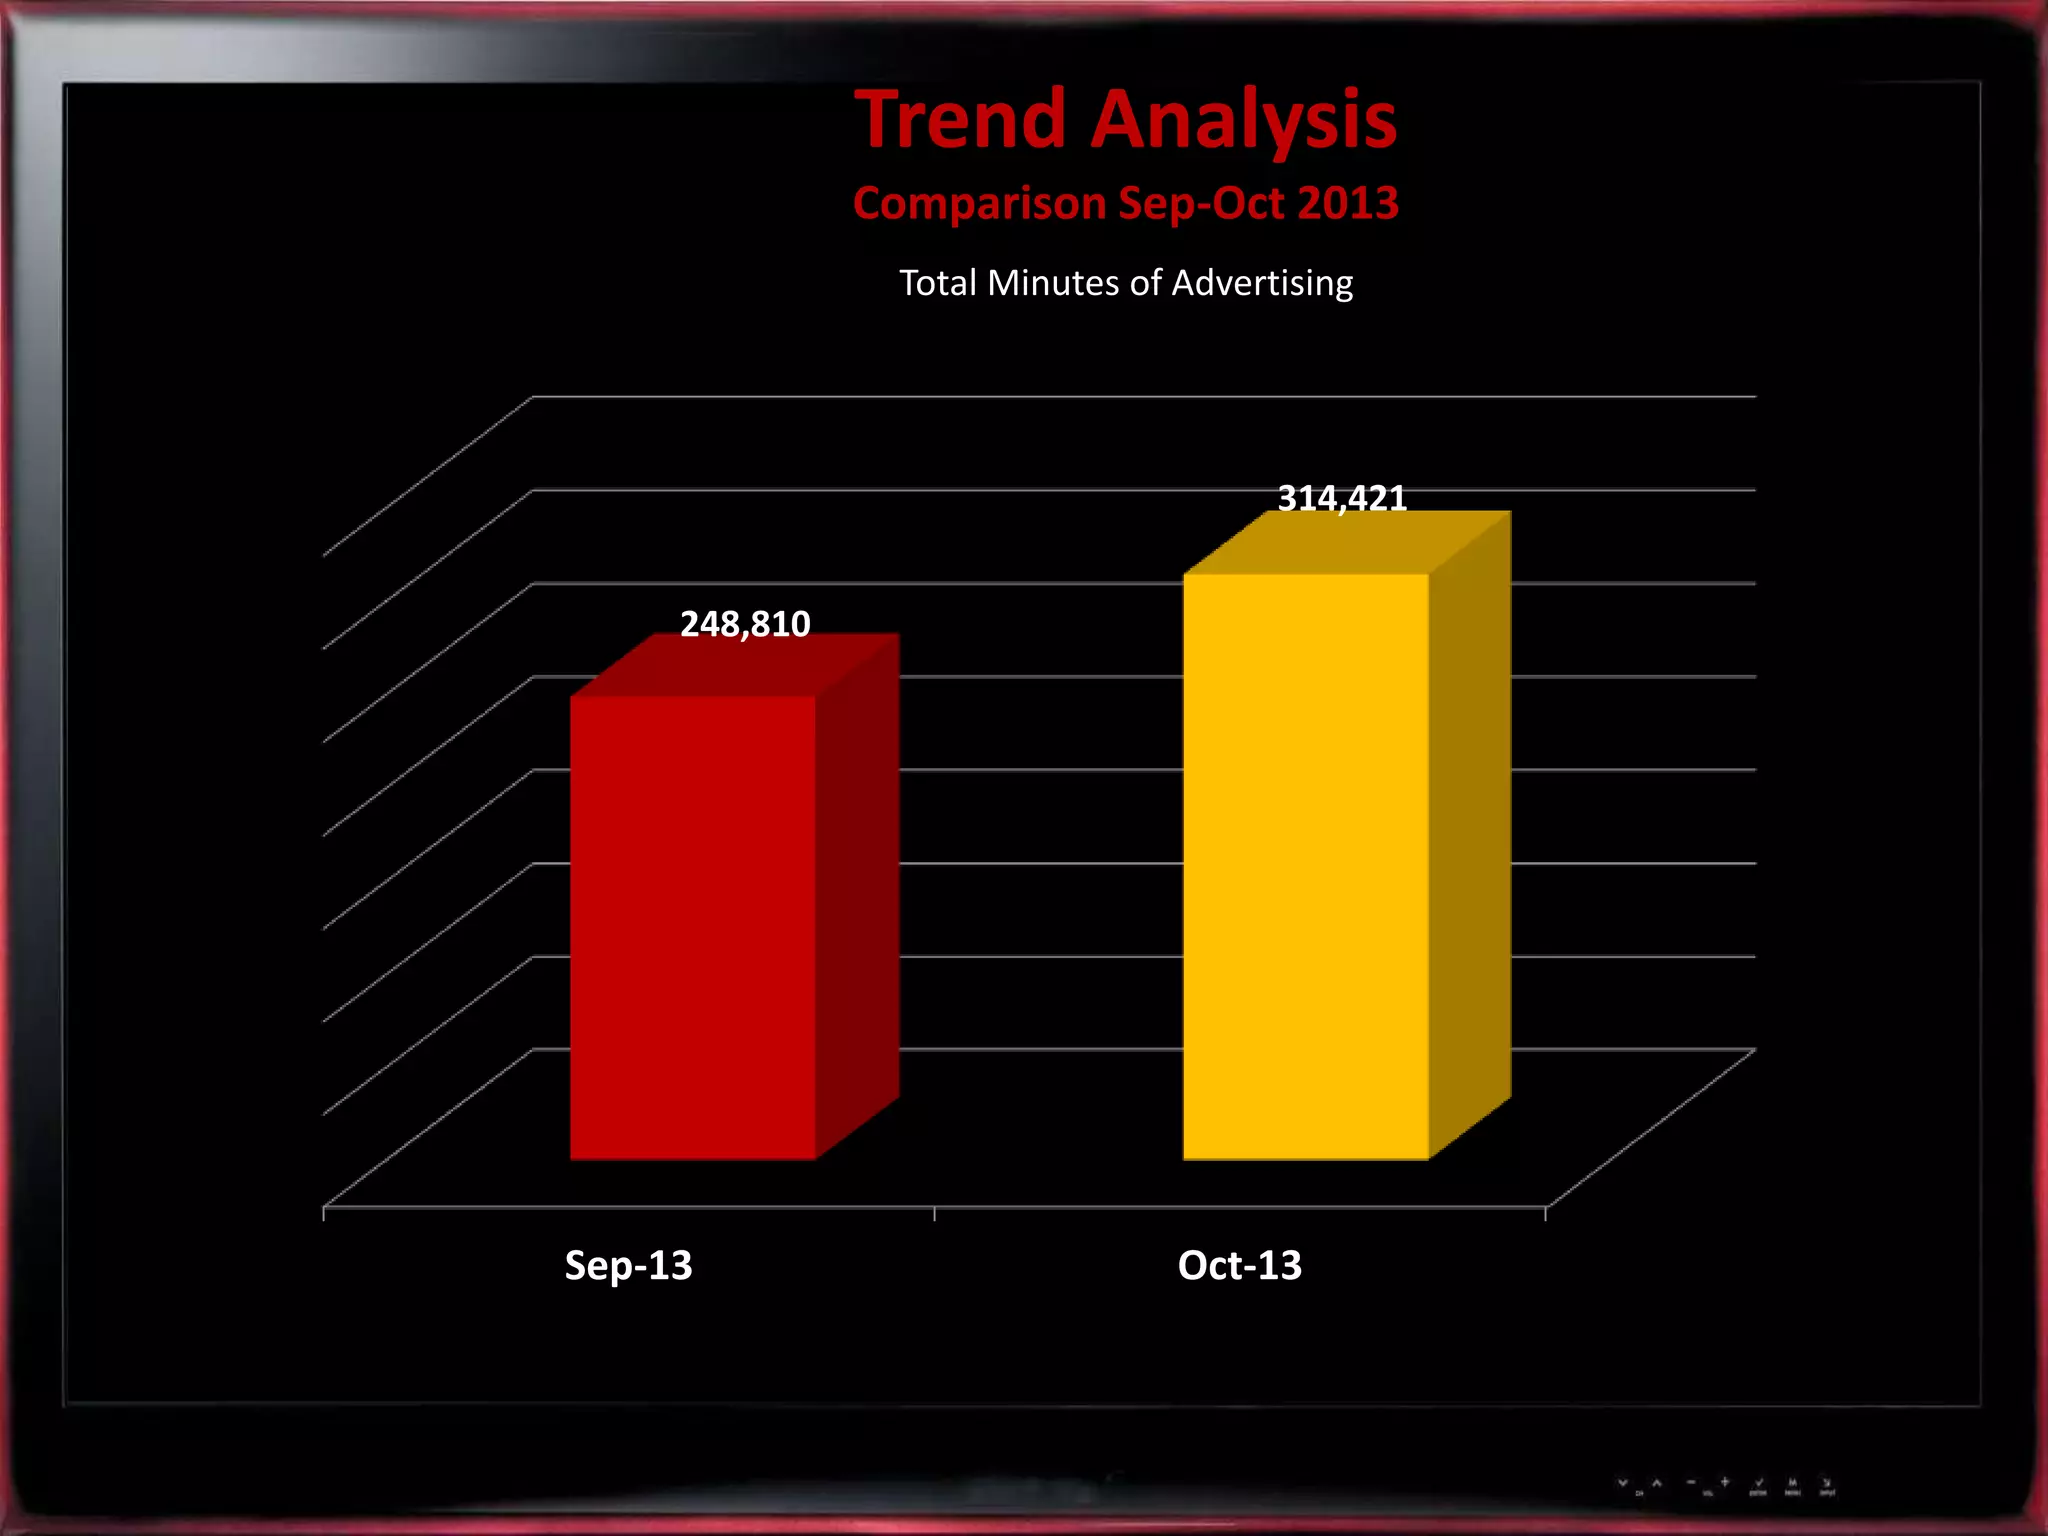
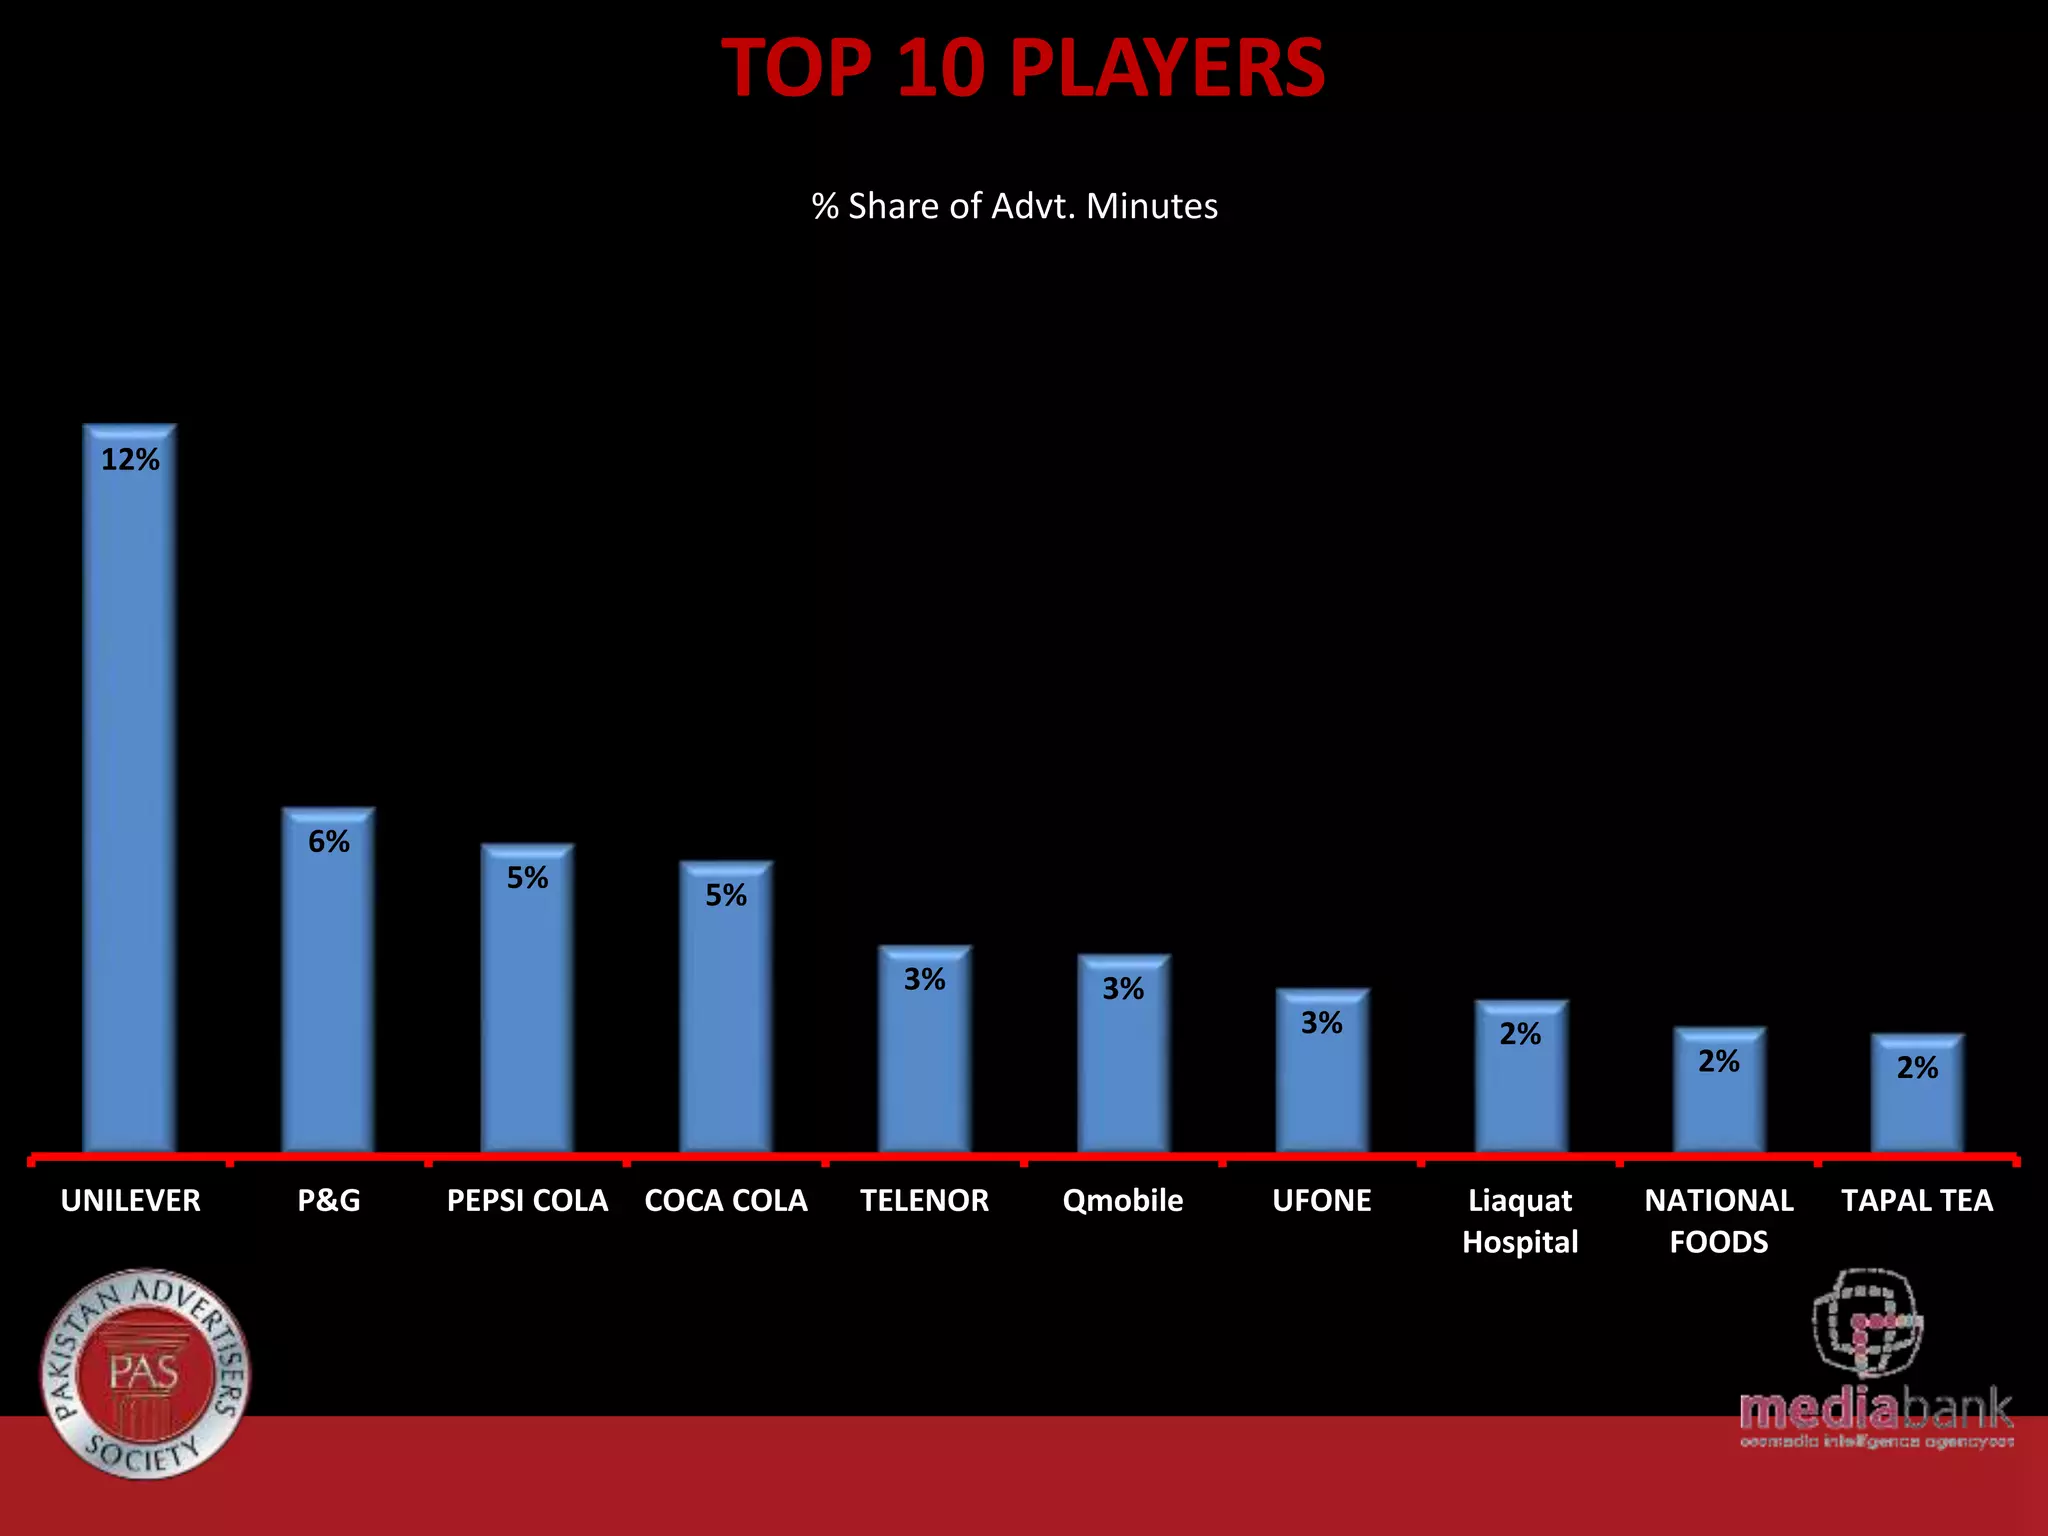
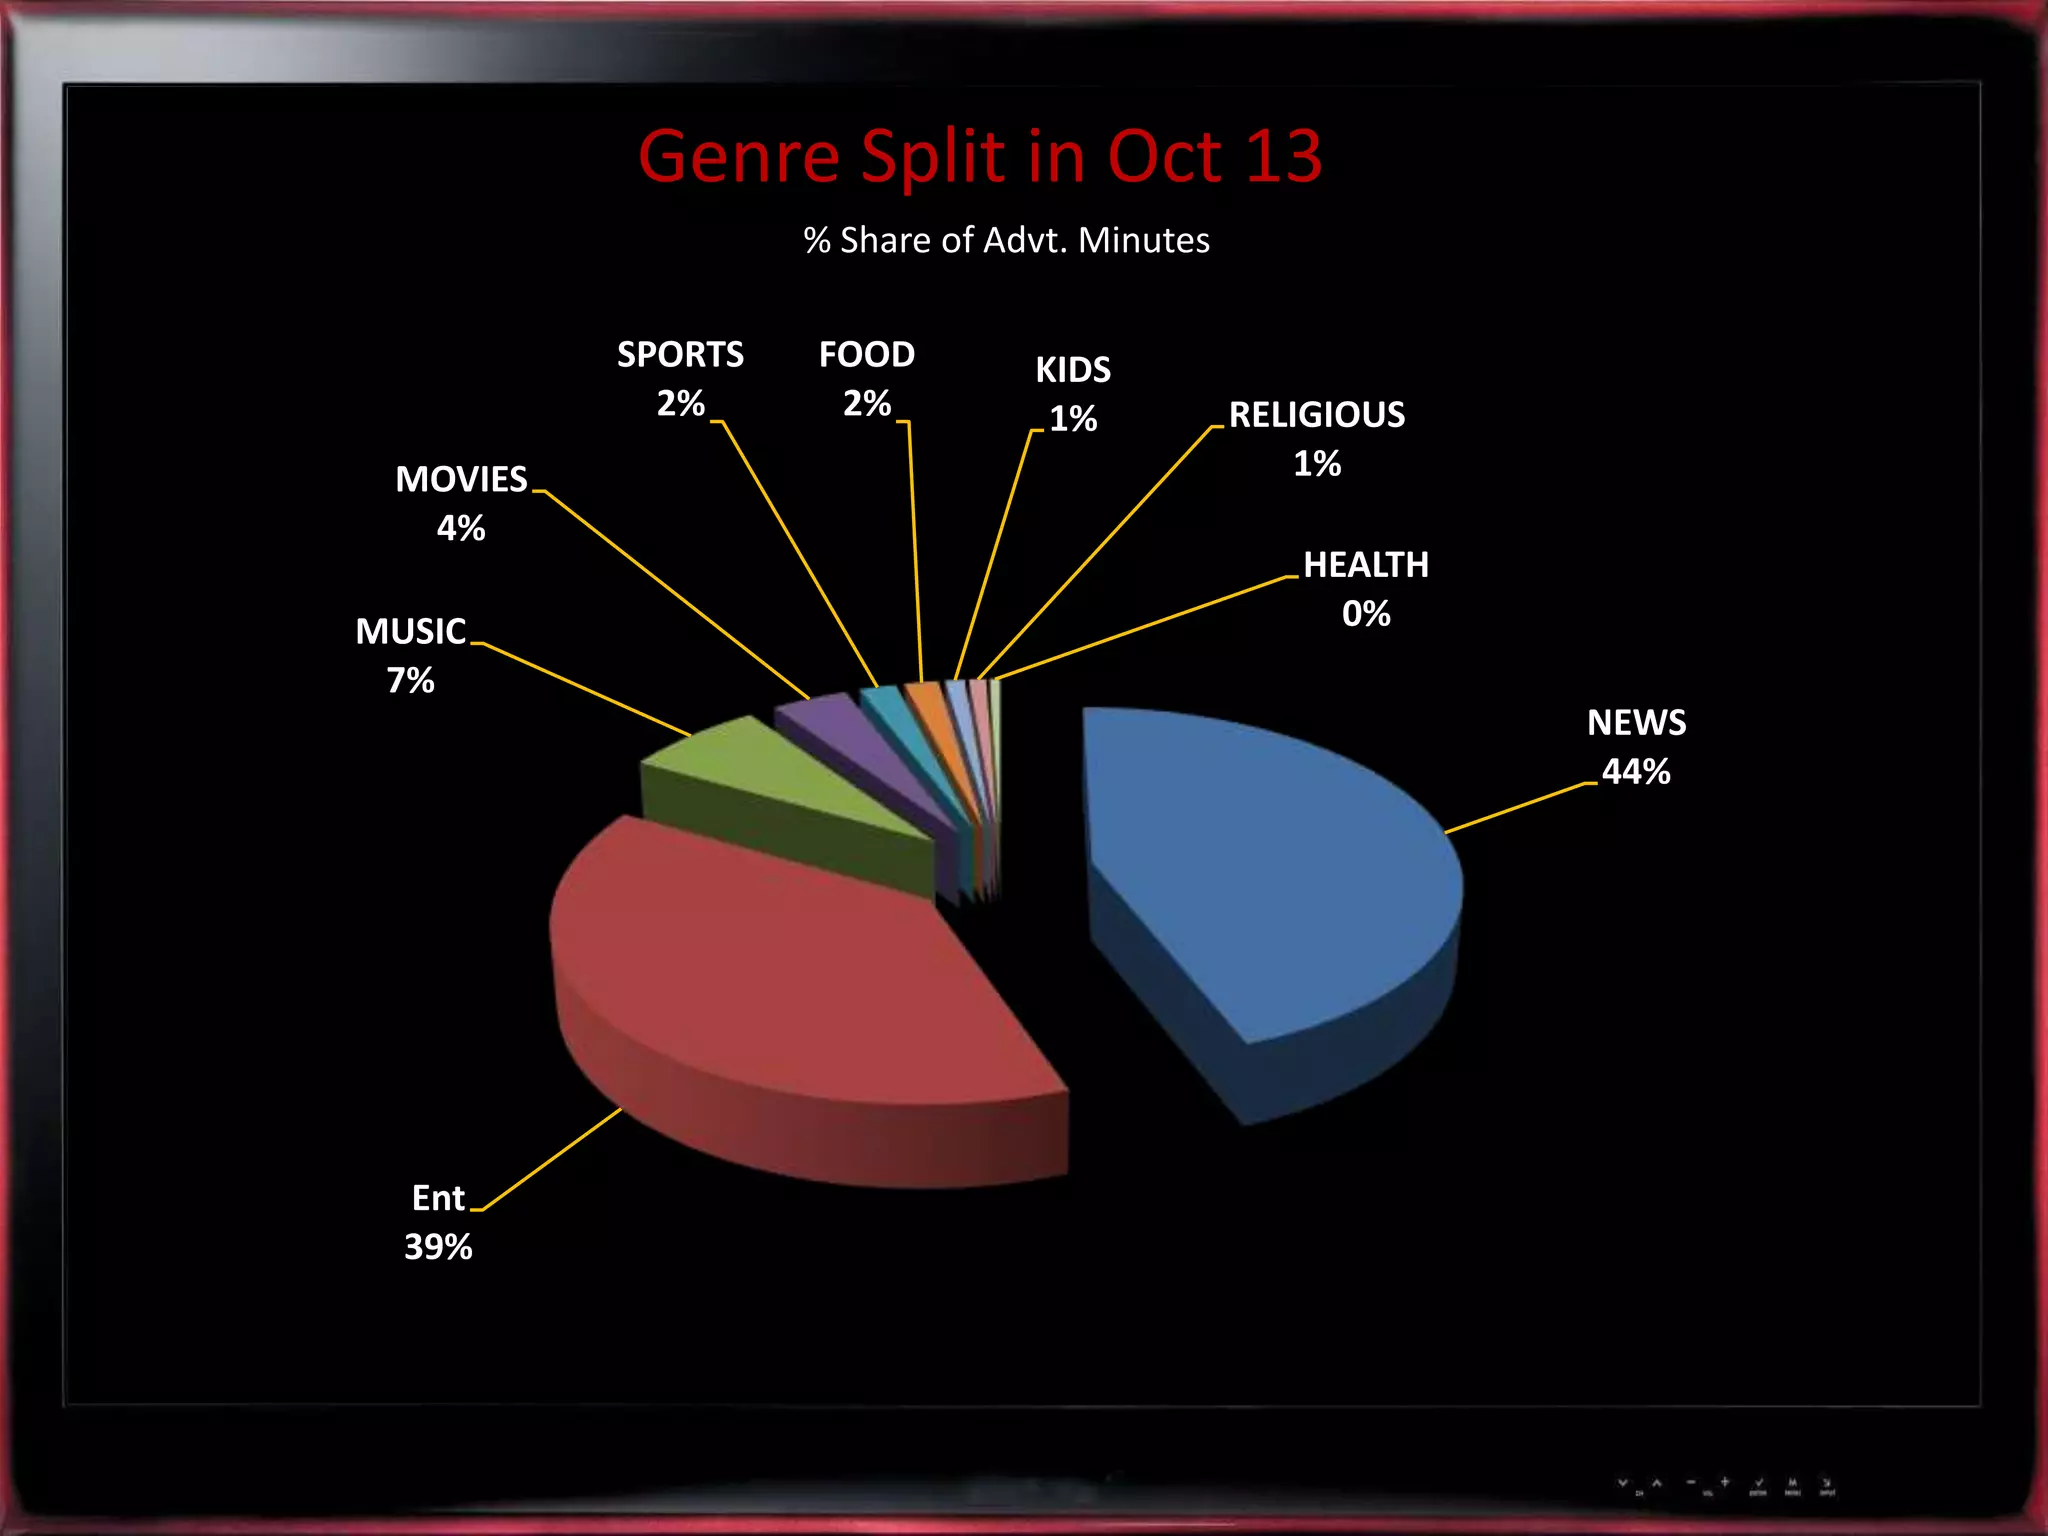

The TV analysis monthly report for October 2013 reveals a significant increase in total advertising minutes, rising to 314,421 from 248,810 in September. Financial services and healthcare lead in advertising share, while news and entertainment dominate the genre split. The report also highlights the top advertisers, with Unilever and P&G leading in market share across various channels and time slots.


