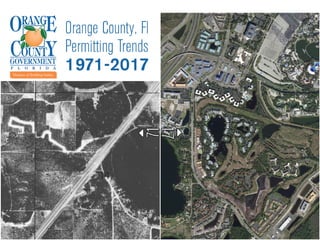
When the Magic Kingdom opened in 1971, it changed Orange County forever. Tourism boomed, with 72 million visitors in 2017, and the population increased nearly 300% to over 1.3 million residents today. This massive growth required permitting over $66 billion of new construction from 1971 to 2017, averaging $1.4 billion per year. Nearly 165,000 single family homes and over 287,000 total residential units have been built. In addition, over $6 billion of hotel construction and $21 billion of commercial construction have occurred to support the tourism industry and local community. The Division of Building Safety has overseen this construction boom to ensure safety for residents and visitors.
The affordable housing challenge: The UK experience (2008)Grant Fitzner
What are the drivers of the UK's affordable housing challenge? What are some of the policy options to tackle it? Presentation to the ULI European Summit in Amsterdam, June 2008, when I was chief economist at the UK Department for Communities and Local Government.
TORONTO REAL ESTATE BOARD'S JUNE 2017 MARKET STATSShawn Venasse
"Recent Ipsos survey results suggest that home buying activity in the GTA will remain strong moving forward. The year-over-year dip in home sales we have experienced over the last two months seem to be the result of would-be buyers putting their decision to purchase temporarily on hold while they monitor the impact of the Fair Housing Plan. On the supply side of the market, it certainly looks as though buyers will benefit from more choice in the second half of 2017 compared to the same period in 2016,"said Jason Mercer, TREB's Director of Market Analysis and Service Channels.
This presentation was given to the Orange County Sheriff's Office on December 8, 2016, in order to update their office on the latest development trends in Orange County.
TORONTO REAL ESTATE BOARD's - MARKET WATCH - MAY 2017 REPORTShawn Venasse
The Toronto Real Estate Board's (TREB) Market Watch report provides the latest real estate prices and sales volume each and every month.
In the May 2017 MARKET WATCH, TREB reports that Toronto's selling prices continued to increase strongly compared to the same month in 2016. The MLS® HPI Composite Benchmark price was up by 29 per cent year-over-year. The average selling price for all home types combined for the TREB Market Area as a whole was up by 14.9 per cent to $863,910. Year-over-year price increases were greater for condominium apartments compared to low-rise home types. This likely reflects the fact that the low-rise market segments benefited most from the increase in listings."
The latest Monthly Housing & Economic Chart Pack from CoreLogic provides a detailed national market update with a focus on capital city housing market conditions and performance over time. • Combined capital city home values increased by 1.4% in December 2016 with values higher across all capital cities except for Adelaide, Darwin and Canberra.
Throughout the 2016 calendar year, dwelling values increased by 10.9% which was their greatest calendar year increase since 2009.
Held on December 13, 2018, the Saratoga County Real Estate Economic Index was hosted by the Saratoga County Prosperity Partnership, the economic development corporation representing Saratoga County, New York.
Our second Housing Summit included current housing trends and a look at our economy.
Our Keynote speaker is Lawrence Yun: Lawrence Yun is Chief Economist and Senior Vice President of Research at the NATIONAL ASSOCIATION OF REALTORS®.
Topics include: Local Residential & Commercial and 2015 Forecast
The Orange County 2019 Development Activity Annual Report provides ten year annual and two year monthly trends for our major development, engineering and permitting review processes.
More Related Content
Similar to Orange County Historic Permitting 1971 - 2017
TORONTO REAL ESTATE BOARD'S JUNE 2017 MARKET STATSShawn Venasse
"Recent Ipsos survey results suggest that home buying activity in the GTA will remain strong moving forward. The year-over-year dip in home sales we have experienced over the last two months seem to be the result of would-be buyers putting their decision to purchase temporarily on hold while they monitor the impact of the Fair Housing Plan. On the supply side of the market, it certainly looks as though buyers will benefit from more choice in the second half of 2017 compared to the same period in 2016,"said Jason Mercer, TREB's Director of Market Analysis and Service Channels.
This presentation was given to the Orange County Sheriff's Office on December 8, 2016, in order to update their office on the latest development trends in Orange County.
TORONTO REAL ESTATE BOARD's - MARKET WATCH - MAY 2017 REPORTShawn Venasse
The Toronto Real Estate Board's (TREB) Market Watch report provides the latest real estate prices and sales volume each and every month.
In the May 2017 MARKET WATCH, TREB reports that Toronto's selling prices continued to increase strongly compared to the same month in 2016. The MLS® HPI Composite Benchmark price was up by 29 per cent year-over-year. The average selling price for all home types combined for the TREB Market Area as a whole was up by 14.9 per cent to $863,910. Year-over-year price increases were greater for condominium apartments compared to low-rise home types. This likely reflects the fact that the low-rise market segments benefited most from the increase in listings."
The latest Monthly Housing & Economic Chart Pack from CoreLogic provides a detailed national market update with a focus on capital city housing market conditions and performance over time. • Combined capital city home values increased by 1.4% in December 2016 with values higher across all capital cities except for Adelaide, Darwin and Canberra.
Throughout the 2016 calendar year, dwelling values increased by 10.9% which was their greatest calendar year increase since 2009.
Held on December 13, 2018, the Saratoga County Real Estate Economic Index was hosted by the Saratoga County Prosperity Partnership, the economic development corporation representing Saratoga County, New York.
Our second Housing Summit included current housing trends and a look at our economy.
Our Keynote speaker is Lawrence Yun: Lawrence Yun is Chief Economist and Senior Vice President of Research at the NATIONAL ASSOCIATION OF REALTORS®.
Topics include: Local Residential & Commercial and 2015 Forecast
The Orange County 2019 Development Activity Annual Report provides ten year annual and two year monthly trends for our major development, engineering and permitting review processes.
This collection contains the process charts for 76 of Orange County's development workflows. Processes include development review, plan review, plat review, permit review, comprehensive planning, addressing, concurrency & impact fee management. Download the PDF document to utilize the hyperlink capabilities by launching SlideShare from the grey LinkedIn icon.
Presentation to the Building Codes Board of Adjustments and Appeals to provide an update on the progress of the Regulatory Streamlining Task Force and the changes in Land Development technology.
The Orange County Developer's Forum held on December 13, 2017, provided an update on the progress made with the recommendations provided by the Regulatory Streamlining Task Force.
This annual report includes the development trends for Unincorporated Orange County, including the ten-year annual trends and two year monthly trends for our major development, engineering and permitting review processes.
This presentation was given at the Central Florida chapter of the Florida Surveying and Mapping Society on May 16, 2017. Topics covered included recent development trends, future development projects, and an overview of the Fast Track Online Services.
Orange County's sixth developer's forum was held on October 13th, 2016, and the focus was on the Fast Track Online Services. The forum provided an overview of the system and the benefits for our users. Topics covered included searching, public records, plans review, inspections, contractor licensing, my services and payments.
The annual Development Activity Report was prepared in order to showcase the major development trends in Unincorporated Orange County. The charts show the past ten years on an annual fiscal basis and the past five year time frame by month.
Orange County's fifth developer's forum was held on June 17th, 2016, and the focus was on the Orange Code initiative to update to the land development code.
Orange Code, a vision for the future of Orange County’s places, creates streamlined processes through an easy-to-use format. It ensures sustainable land development that preserves the character of existing communities, celebrates Orange County's diversity and creates vibrant places to live, work and relax. Every city and county has a land development code that describes where and how new buildings and communities may be built. While there have been many updates since Orange County’s Code was written in 1957, now is the time to look at the big picture. Orange Code will refresh and rethink the County’s place-making law to get it ready for the 21st Century.
The Development Activity Report was prepared in order to showcase the major development trends in Unincorporated Orange County. The charts show the 2015/2016 period by month and the past 10 years on an annual basis.
This collection contains the process charts for 76 of Orange County's development workflows. Processes include development review, plan review, plat review, permit review, comprehensive planning, addressing, concurrency & impact fee management. Download the PDF document to utilize the hyperlink capabilities by launching SlideShare from the grey LinkedIn icon.
Orange County's third developer's forum was held on November 10th, 2015, and the focus was on the concurrency management process and administration. Topics covered in the presentation included the application and encumbrance process, vested rights, technology improvements and customer tips on successfully completing the process. Representatives from Development Services, Transportation Planning, the Legal Department and OCPS participated in the presentation.
This presentation was given at Orange County's Infill and Redevelopment Conference and it explained the tools and techniques used to identify potential locations for infill development.
Presentation to the Orange County BCC providing an update on the activities in Permitting Services. Topics covered include development trends, service initiatives and technology enhancements.
This presentation to the Orange County Board of County Commissioners provided an update on the current state of development and explained how the economic collapse of the housing market impacted our government operations.
What is the point of small housing associations.pptxPaul Smith
Given the small scale of housing associations and their relative high cost per home what is the point of them and how do we justify their continued existance
This session provides a comprehensive overview of the latest updates to the Uniform Administrative Requirements, Cost Principles, and Audit Requirements for Federal Awards (commonly known as the Uniform Guidance) outlined in the 2 CFR 200.
With a focus on the 2024 revisions issued by the Office of Management and Budget (OMB), participants will gain insight into the key changes affecting federal grant recipients. The session will delve into critical regulatory updates, providing attendees with the knowledge and tools necessary to navigate and comply with the evolving landscape of federal grant management.
Learning Objectives:
- Understand the rationale behind the 2024 updates to the Uniform Guidance outlined in 2 CFR 200, and their implications for federal grant recipients.
- Identify the key changes and revisions introduced by the Office of Management and Budget (OMB) in the 2024 edition of 2 CFR 200.
- Gain proficiency in applying the updated regulations to ensure compliance with federal grant requirements and avoid potential audit findings.
- Develop strategies for effectively implementing the new guidelines within the grant management processes of their respective organizations, fostering efficiency and accountability in federal grant administration.
ZGB - The Role of Generative AI in Government transformation.pdfSaeed Al Dhaheri
This keynote was presented during the the 7th edition of the UAE Hackathon 2024. It highlights the role of AI and Generative AI in addressing government transformation to achieve zero government bureaucracy
Jennifer Schaus and Associates hosts a complimentary webinar series on The FAR in 2024. Join the webinars on Wednesdays and Fridays at noon, eastern.
Recordings are on YouTube and the company website.
https://www.youtube.com/@jenniferschaus/videos
Many ways to support street children.pptxSERUDS INDIA
By raising awareness, providing support, advocating for change, and offering assistance to children in need, individuals can play a crucial role in improving the lives of street children and helping them realize their full potential
Donate Us
https://serudsindia.org/how-individuals-can-support-street-children-in-india/
#donatefororphan, #donateforhomelesschildren, #childeducation, #ngochildeducation, #donateforeducation, #donationforchildeducation, #sponsorforpoorchild, #sponsororphanage #sponsororphanchild, #donation, #education, #charity, #educationforchild, #seruds, #kurnool, #joyhome
A process server is a authorized person for delivering legal documents, such as summons, complaints, subpoenas, and other court papers, to peoples involved in legal proceedings.
2. When the Magic Kingdom opened in southwest Orange County in 1971, our community was changed forever.
With 72 million visitors arriving in 2017, we remain America’s most-visited destination. The population of
Orange County in 1970 was 344,311 and today it is estimated at 1,347,975, an increase of nearly 300%. This
increase in population and tourism required massive growth, including housing, retail, office space, public
services and lodging. Originally known as the Building Department, the Division of Building Safety has been
overseeing construction permitting in unincorporated Orange County throughout this period.
During the period from 1971 to 2017, unincorporated Orange County grew in amazing ways. When adjusting
for inflation, this growth equated to $66 billion worth of new construction, an average of $1.4 billion per year
for nearly 50 years. In just the past three years, $7 billion worth of construction was permitted averaging $200
million a month. Nearly 165,000 single family homes have been permitted and over 287,000 total residential
units were constructed.
In support of our tourism industry, over $6 billion worth of hotel construction has occurred in Orange County.
Our commercial construction, which includes retail, industrial, offices, amusement, public works and
education, serves both our visitors and the greater Central Florida community. Permitting for commercial
activities was nearly $21 billion since 1971, averaging $441 million annually and exceeding $2.5 billion over the
past five years. All of this growth needs to be reviewed and permitted to ensure our buildings are safe for our
residents and visitors, and the Orange County Division of Building Safety will continue to provide this service.
3. 0
1,000
2,000
3,000
4,000
5,000
6,000
1971 1974 1977 1980 1983 1986 1989 1992 1995 1998 2001 2004 2007 2010 2013 2016
Single Family
Residential
New Construction
Total Permits
Issued
Average permits/month
Total permits issued
Highest year
2004
Busiest month
June, 366 average permits
Slowest month
November, 250 average permits
300
164,645
5,491
724Lowest year
2009
4. $0
$200
$400
$600
$800
$1,000
$1,200
$1,400
1971 1974 1977 1980 1983 1986 1989 1992 1995 1998 2001 2004 2007 2010 2013 2016
Millions Single Family
Residential
New Construction
Total Project
Valuation
(Adjusted for Inflation)
Total valuation
$29B
Highest Year
2004
Lowest Year
1975
$1.4B
$78M
5. $0
$50,000
$100,000
$150,000
$200,000
$250,000
$300,000
$350,000
$400,000
1971 1974 1977 1980 1983 1986 1989 1992 1995 1998 2001 2004 2007 2010 2013 2016
Single Family
Residential
New Construction
Average Permit
Valuation
(Adjusted for Inflation)
Average permit valuation
Average permit valuation in 1971
Average valuation increase
during period
Average permit valuation in 2017
$190K
308%
$14,479
$90,192
10. 0
200
400
600
800
1,000
1971 1974 1977 1980 1983 1986 1989 1992 1995 1998 2001 2004 2007 2010 2013 2016
Multi-Family
Residential
New Construction
Total Permits
Issued
Total permits issued
Average permits per year
11,233
239
11. $0
$100
$200
$300
$400
$500
1971 1974 1977 1980 1983 1986 1989 1992 1995 1998 2001 2004 2007 2010 2013 2016
Millions Multi-Family
Residential
New Construction
Total Project
Valuation
(Adjusted for Inflation)
Inflation adjusted total valuation
Average per month
$8.5B
$15M
12. 0
1,000
2,000
3,000
4,000
5,000
6,000
7,000
8,000
1971 1974 1977 1980 1983 1986 1989 1992 1995 1998 2001 2004 2007 2010 2013 2016
Multi-Family
Residential
New Construction
Total Permit
Units Issued
Total units
Average units per year
In December 1985, Orange
County experienced the
highest total new home
growth value in the period
with 3,250 units permitted
for a value today of
112,070
2,384
$208M
14. 0
1,000
2,000
3,000
4,000
5,000
6,000
7,000
1971 1974 1977 1980 1983 1986 1989 1992 1995 1998 2001 2004 2007 2010 2013 2016
All Residential
New Construction
Total Permits
Issued
Total residential permits issued
Average units per year
186,826
2,384
Busiest month
December, 1985
Slowest month
February, 1975
1,947
30
15. $0
$200
$400
$600
$800
$1,000
$1,200
$1,400
$1,600
$1,800
$2,000
1971 1974 1977 1980 1983 1986 1989 1992 1995 1998 2001 2004 2007 2010 2013 2016
Millions All Residential
New Construction
Total Project
Valuation
(Adjusted for Inflation)
Total residential construction
Average per month
$40B
$70M
Peak valuation year
2016
Lowest valuation year
1976
$2B
$104M
16. 0
2,000
4,000
6,000
8,000
10,000
12,000
14,000
1971 1974 1977 1980 1983 1986 1989 1992 1995 1998 2001 2004 2007 2010 2013 2016
All Residential
New Construction
Total Permit
Units Issued
Total residential units permitted
Average units per month
287,663
510
Average units per year
6,120
17. $0
$100
$200
$300
$400
$500
$600
$700
$800
$900
$1,000
1971 1974 1977 1980 1983 1986 1989 1992 1995 1998 2001 2004 2007 2010 2013 2016
Millions Hotels
New Construction
Total Project
Valuation
(Adjusted for Inflation)
In hotels have been constructed.
Permitted in April 2007
$6.2B
$362M
Surpassed during 11 different
months
$100M
19. 0
500
1,000
1,500
2,000
2,500
1971 1974 1977 1980 1983 1986 1989 1992 1995 1998 2001 2004 2007 2010 2013 2016
Commercial
New Construction
Total Permits
Issued
Total new commercial
construction permits
Average permits per month
56,889
100
20. $0
$200
$400
$600
$800
$1,000
$1,200
$1,400
$1,600
$1,800
1971 1974 1977 1980 1983 1986 1989 1992 1995 1998 2001 2004 2007 2010 2013 2016
Millions Commercial
New Construction
Total Project
Valuation
(Adjusted for Inflation)
Commercial construction
total valuation
Annual average
July 1985, Orange County
permitted the Stanton
Energy Plant, with an
adjusted value of
$20B
$441M
$1.1B
22. $1,968
$2,147
$1,423
$531
$612
$828
$1,308
$1,471
$1,646
$1,929
$0
$500
$1,000
$1,500
$2,000
$2,500
2006 2007 2008 2009 2010 2011 2012 2013 2014 2015
Millions
$99
$139
$129
$122
$133
$234
$205
$108
$134
$235
$109
$283
$197
$130
$238
$154
$189 $198
$0
$50
$100
$150
$200
$250
$300
$350Millions
2015
2016
Combined
Residential &
Commercial
New Construction
Total Project
Valuation
(Adjusted for Inflation)
$0
$500
$1,000
$1,500
$2,000
$2,500
$3,000
1971 1974 1977 1980 1983 1986 1989 1992 1995 1998 2001 2004 2007 2010 2013 2016
Millions
Total construction value
Annual average
The last three years have
averaged nearly
per month
$66B
$1.4B
$200M
23. Prepared by CEDS Development Services
and the Division of Building Safety
July 2018
Visit the all-new Fast Track Online Services to
submit and obtain permits online and access
the full suite of search and research tools.
Visit FastTrack.OCFL.net to get started.
Fast Track Member Registration
: 407-836-5522
: contractorlicensing@ocfl.net
201 S. Rosalind Avenue • Orlando, FL 32801