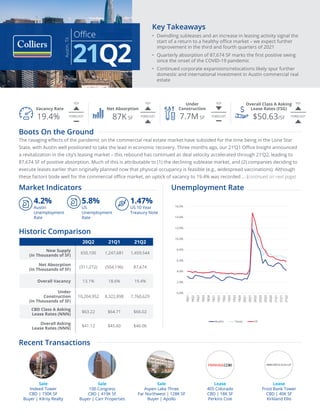
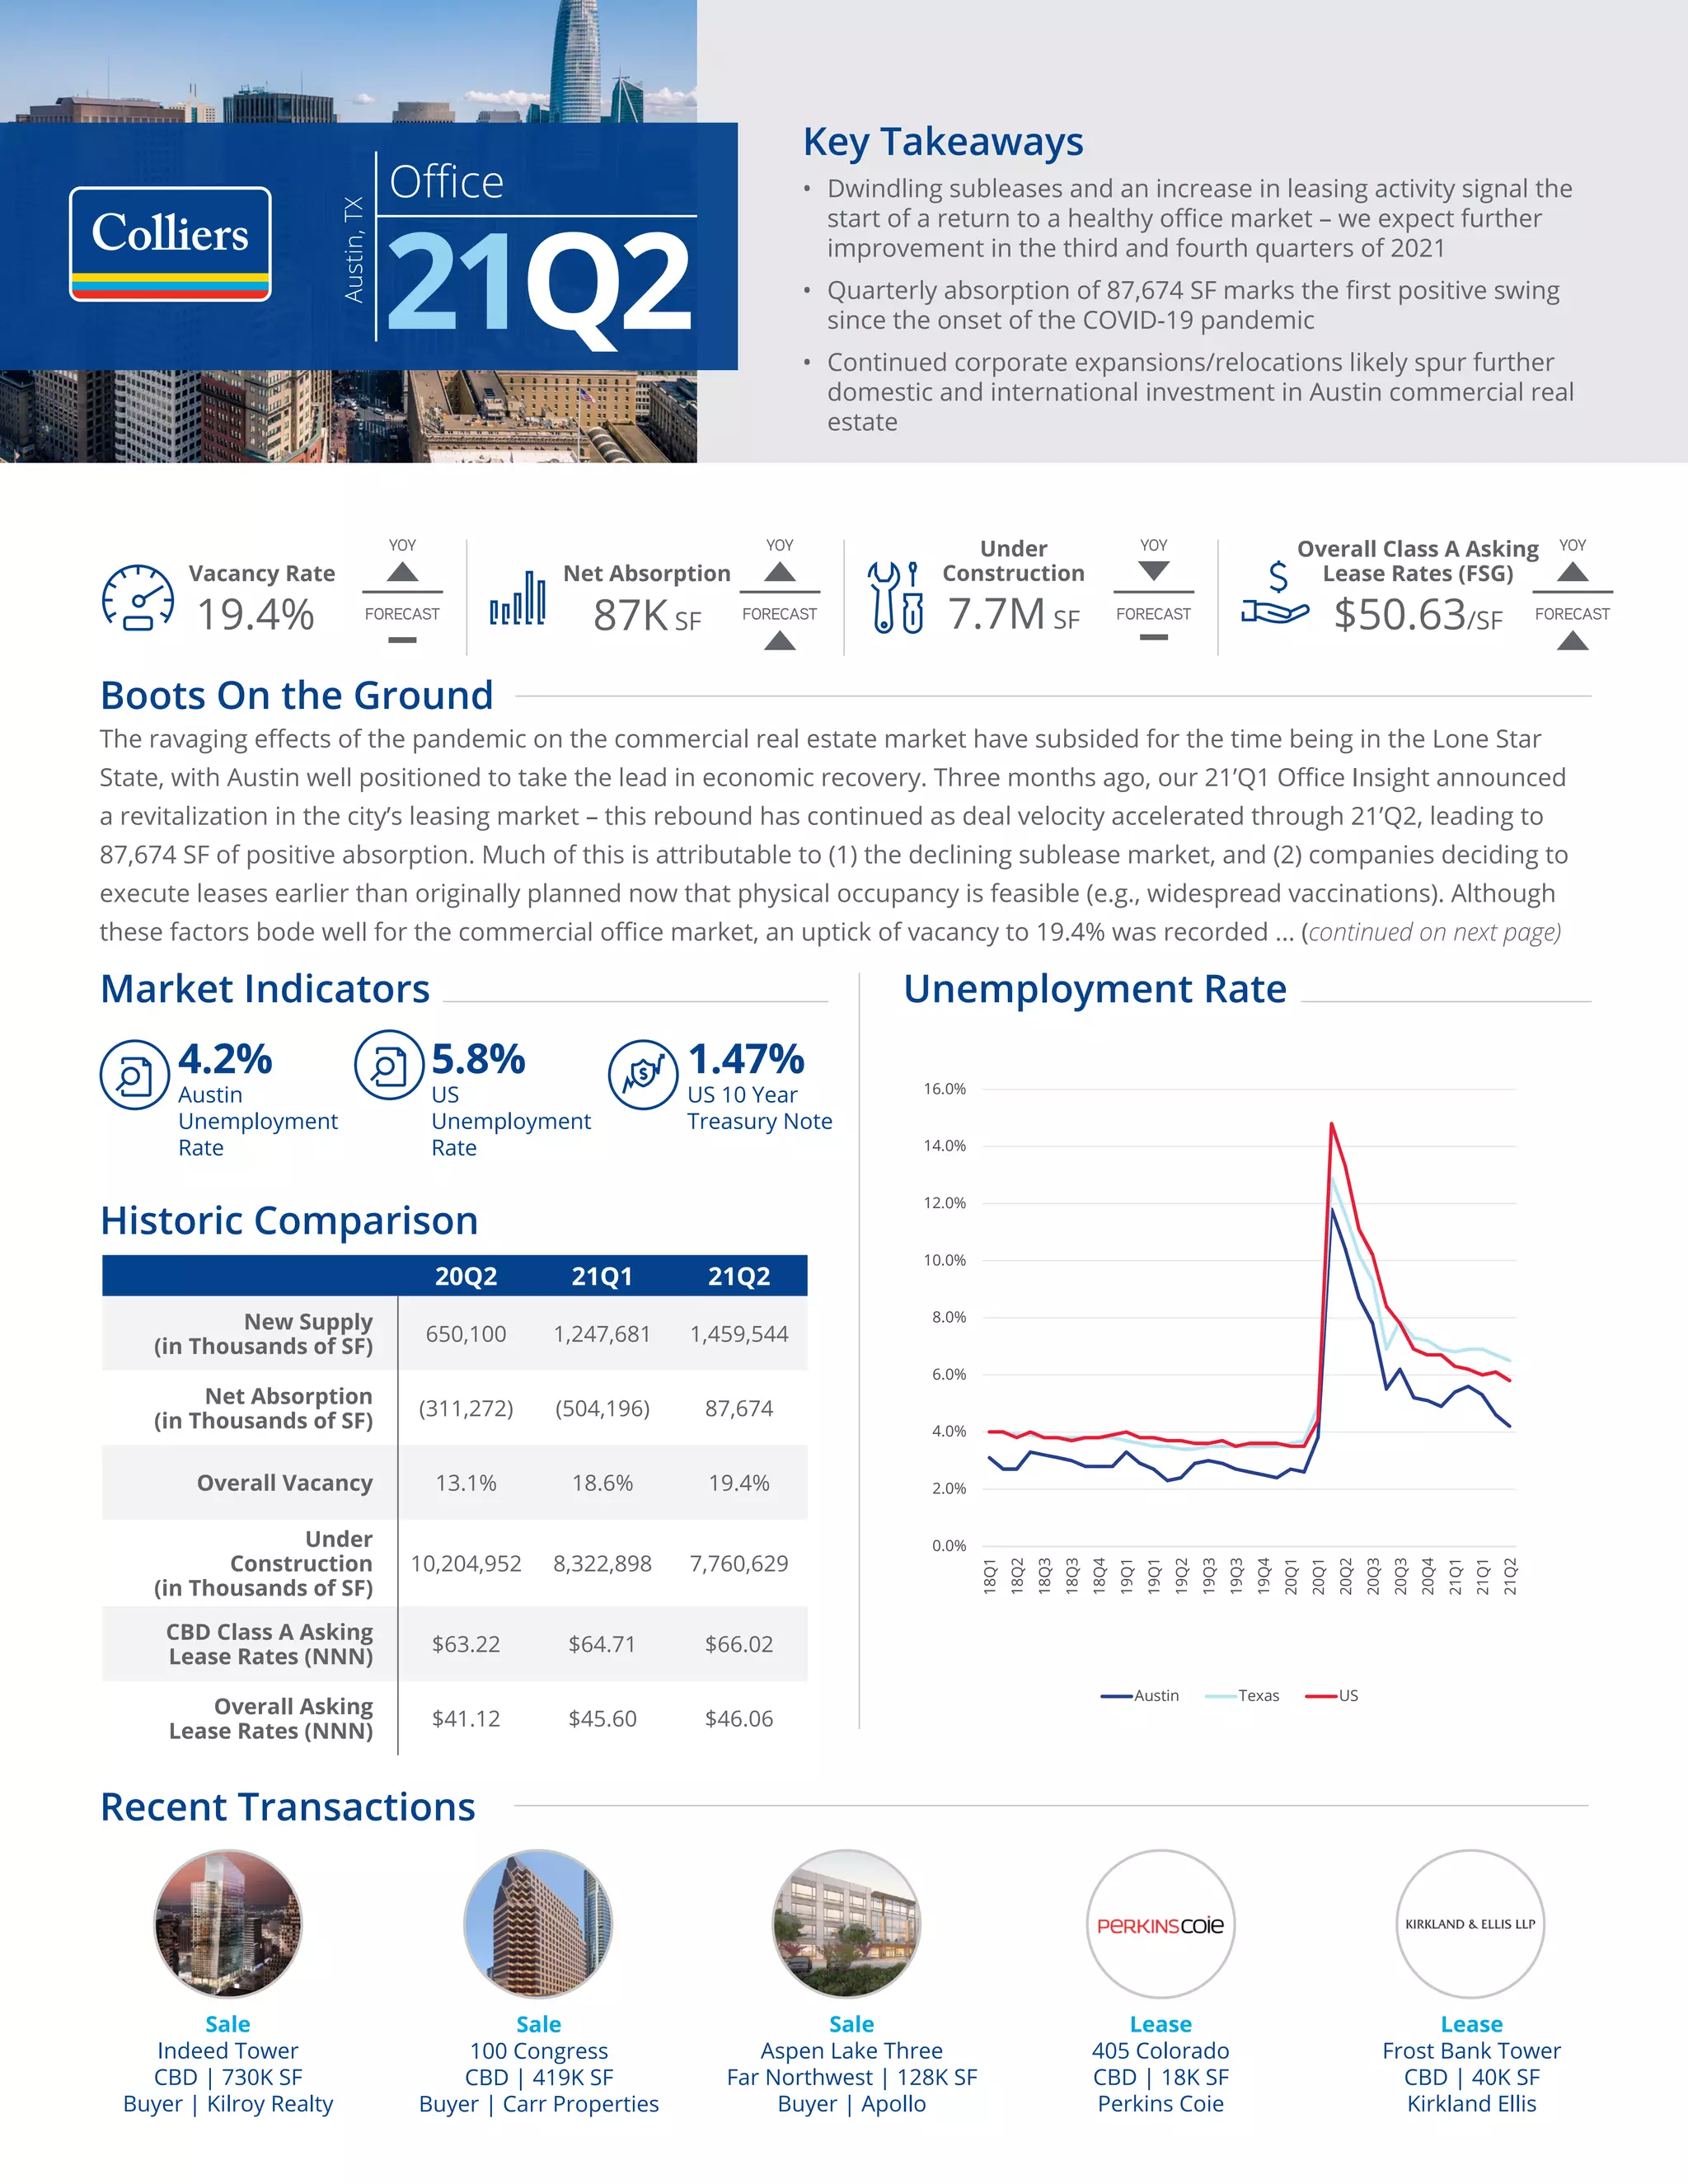
20Q2 21Q1 21Q2
New Supply
(in Thousands of SF)
650,100 1,247,681 1,459,544
Net Absorption
(in Thousands of SF)
(311,272) (504,196) 87,674
Overall Vacancy 13.1% 18.6% 19.4%
Under
Construction
(in Thousands of SF)
10,204,952 8,322,898 7,760,629
CBD Class A Asking
Lease Rates (NNN)
$63.22 $64.71 $66.02
Overall Asking
Lease Rates (NNN)
$41.12 $45.60 $46.06
Sale
Indeed Tower
CBD | 730K SF
Buyer | Kilroy Realty
Lease
405 Colorado
CBD | 18K SF
Perkins Coie
Lease
Frost Bank Tower
CBD | 40K SF
Kirkland Ellis
Sale
100 Congress
CBD | 419K SF
Buyer | Carr Properties
Sale
Aspen Lake Three
Far Northwest | 128K SF
Buyer | Apollo
YOY
FORECAST
YOY
YOY
FORECAST
YOY
FORECAST
FORECAST
Office
Austin,
TX
21Q2
Boots On the Ground
The ravaging effects of the pandemic on the commercial real estate market have subsided for the time being in the Lone Star
State, with Austin well positioned to take the lead in economic recovery. Three months ago, our 21’Q1 Office Insight announced
a revitalization in the city’s leasing market – this rebound has continued as deal velocity accelerated through 21’Q2, leading to
87,674 SF of positive absorption. Much of this is attributable to (1) the declining sublease market, and (2) companies deciding to
execute leases earlier than originally planned now that physical occupancy is feasible (e.g., widespread vaccinations). Although
these factors bode well for the commercial office market, an uptick of vacancy to 19.4% was recorded ... (continued on next page)
Unemployment Rate
Market Indicators
Historic Comparison
4.2%
Austin
Unemployment
Rate
1.47%
US 10 Year
Treasury Note
5.8%
US
Unemployment
Rate
Vacancy Rate
19.4%
Net Absorption
87K SF
Overall Class A Asking
Lease Rates (FSG)
$50.63/SF
Under
Construction
7.7M SF
Key Takeaways
•	 Dwindling subleases and an increase in leasing activity signal the
start of a return to a healthy office market – we expect further
improvement in the third and fourth quarters of 2021
•	 Quarterly absorption of 87,674 SF marks the first positive swing
since the onset of the COVID-19 pandemic
•	 Continued corporate expansions/relocations likely spur further
domestic and international investment in Austin commercial real
estate
Recent Transactions
0.0%
2.0%
4.0%
6.0%
8.0%
10.0%
12.0%
14.0%
16.0%
18Q1
18Q2
18Q3
18Q3
18Q4
19Q1
19Q1
19Q2
19Q3
19Q3
19Q4
20Q1
20Q1
20Q2
20Q3
20Q3
20Q4
21Q1
21Q1
21Q2
Austin Texas US
Colliers | Austin | 21Q2 | Office Report
Office
Austin,
TX
21Q2
Sublease Environment
43%
3%
3%
3%
5%
3%
23%
1%
16%
CBD
Central & West Central
East
North/Domain
Northeast
Far Northwest
Northwest
South
Southwest
20Q2 21Q1 21Q2
CBD 391,943 791,981 911,991
Central & West Central 39,103 65,457 57,710
East 71,646 85,880 56,880
North/Domain 13,018 106,960 64,406
Northeast 153,798 119,636 105,886
Far Northwest 93,141 56,124 56,302
Northwest 279,442 516,968 478,482
Round Rock 13,176 17,271 18,327
South 6,822 35,909 29,877
Southeast - 8,000 8,000
Southwest 173,331 351,962 331,846
TOTAL 1,235,420 2,156,148 2,119,707
Boots on the Ground continued
The Market, at a Glance
As Austin commercial real estate continues to take strides forward, many of the subleases that proliferated in the market during
the height of COVID-19 have started to dissipate at a rapid pace as a number of companies pulled their spaces in order to re-
occupy. Mounting relocations/expansions from other markets have gobbled up significant portions of the remaining attractive
sublease options (F45 Training, Canva, Rev and a host of other players have demonstrated this trend in just the last few months).
Furthermore, with the introduction of vaccinations, many companies who were awaiting post-pandemic clarity have decided to
pull the trigger in 21’Q2 rather than biding their time. It is important to note, however, that this activity has been concentrated
mostly in move-in-ready space on short term leases (three years or under). This is potentially attributable to two factors: (1)
companies need to make real estate decisions as employees begin phasing back into the office, and (2) there remains some
hesitancy as to how the workplace will look in the immediate and long-term, driving the need for shorter-term length. As a result,
tenant appetite for large build-outs on long term leases (five years or more) is very low, forcing many landlords currently sitting
on delivered product or to build out specs suites and negotiate shorter-term leases in order to compete. While this type of user
activity is disadvantageous for landlords in the near term, the eroding subleases will likely improve the market towards the end
of the year.
Future Forecast
Austin continues to attract investments, both domestic and internationally (the city recently ranked as the top target for
international investment according to the AFIRE International Investor Survey) – this interest will likely continue to improve as
additional corporate giants (e.g. Amazon, Tesla, Facebook) continue to establish and grow their presence in the Texas Capital.
Kilroy’s recent entry into the market through its $580M acquisition of Indeed Tower typifies this investor attraction. We generally
expect vacancy levels to diminish, pricing to rise and absorption levels to further increase through the latter half of 2021.
...due to the ±1.5M SF of new space that was delivered over the quarter, of which 51% was pre-leased. A large portion of these
buildings were Class A which, when coupled with ever-increasing operating expenses, led to a slight bump in overall asking rates
to an average of $46.06 (from $45.60 in 21’Q1).
Colliers | Austin | 21Q2 | Office Report
Office
Austin,
TX
21Q2
0.0%
5.0%
10.0%
15.0%
20.0%
25.0%
$0.00
$10.00
$20.00
$30.00
$40.00
$50.00
$60.00
$70.00
Q1 2020 Q2 2020 Q3 2020 Q4 2020 Q1 2021 Q2 2021
CBD Citywide Total Vacancy
Notable Q2 2021 Completions
(1,500,000)
(1,000,000)
(500,000)
0
500,000
1,000,000
1,500,000
2,000,000
Q1 2020 Q2 2020 Q3 2020 Q4 2020 Q1 2021 Q2 2021
Deliveries Net Absorption
Indeed Tower
730,000 SF | CBD
Kilroy Realty
1836 San Jac
206,555 SF | CBD
Employee Retirement
System of Texas
Highland 3
250,000 SF |Central
Redleaf Properties
Eastlake at Tillery
172,423 SF | East
CREA
Foundry II
161,436 SF | East
Tishman Speyer
1204 San Antonio at Capitol West
41,968 SF | CBD
Texas Association of Counties Risk
Management Pool
(1,500,000)
(1,000,000)
(500,000)
0
500,000
1,000,000
1,500,000
2,000,000
Q1 2020 Q2 2020 Q3 2020 Q4 2020 Q1 2021 Q2 2021
Deliveries Net Absorption
Supply & Absorption
The Austin economy is in a stage of revitalization, as
evidenced by fading sublease availability and accelerated
deal velocity. New deliveries of 1,459,544 SF eclipsed 21’Q1
by a narrow margin, resulting in a slight uptick in vacancy.
Absorption of 87,674 SF was recorded in 21’Q2, marking
the first quarter in more than a year in which positive
levels were recorded; mounting confidence in physical re-
occupancy, coupled with a robust relocation & expansion
trend, will likely stimulate a continued upwards trend in
absorption. This is a welcome shift for developers, who are
scheduled to complete 7,760,629 SF of new construction
during the next few years.
Direct Lease Rates
21’Q2 average citywide asking rate of $46.06/SF slightly
exceeds the previous quarter’s rate of $45.60/SF, a bump
that could likely be attributed to an abundance of recently
completed Class-A space in conjunction with growing
operating expenses. As high-quality projects continue to
deliver while leasing velocity intensifies, we can expect
citywide rates to keep climbing.
Colliers | Austin | 21Q2 | Office Report
Office
Austin,
TX
21Q2
Upcoming Projects
Citywide Construction
27%
43%
8%
14%
8%
CBD
East
South
Southeast
Southwest
0
1,000,000
2,000,000
3,000,000
4,000,000
5,000,000
6,000,000
Q3
2021
Q4
2021
2022
2023
Leased Expected Deliveries
Q3 2021 Expected Deliveries
405 Colorado St.
Brandywine Realty Trust
202,138 SF | CBD
Q3 2021 Delivery
22.5% Leased
RiverSouth
Stream Realty Partners
350,661 SF | South
Q3 2021 Delivery
22.5% Leased
Eastbound
Lincoln Property Group
233,577 SF | East
Q3 2021 Delivery
0% Leased
Uplands Corporate Center:
Phase II
Drawbridge Realty
124,081 SF | Southwest
Q3 2021 Delivery
15% Leased
701 Rio
Roscoe Properties
120,954 SF | East
Q3 2021 Delivery
0% Leased
Copyright © 2021 Colliers
The information contained herein has been obtained from sources
deemed reliable. While every reasonable effort has been made to
ensure its accuracy, we cannot guarantee it. No responsibility is
assumed for any inaccuracies. Readers are encouraged to consult
their professional advisors prior to acting on any of the material
contained in this report.
FOR MORE INFORMATION
John O’Sullivan
Research Associate
Austin
+1 512 539 3012
john.o’sullivan@colliers.com
David Bremer
Managing Director
Austin
+1 512 539 3014
david.bremer@colliers.com
Submarket Existing Inventory (SF) Direct Vacancy (SF) Sublease Vacancy (SF) Overall Vacancy Rate
Quarterly Net
Absorption (SF)
Weighted Average
Asking Rate
Downtown
CBD 12,849,342 1,615,254 911,991 19.7% 189,383 $61.56
TOTAL 12,849,342 1,615,254 911,991 19.7% 189,383 $61.56
Market Total
CBD 12,849,342 1,615,254 911,991 19.7% 189,383 $61.56
Suburban 51,509,495 8,743,610 1,207,716 19.3% (101,709) $42.20
TOTAL 64,358,837 10,358,864 2,119,707 19.4% 87,674 $46.07
Suburban
Central & West Central 3,511,565 568,434 57,710 17.8% (18,349) $48.12
East 3,487,208 1,114,226 56,880 33.6% 3,917 $56.62
North / Domain 7,398,086 818,749 64,406 11.9% 131,266 $39.62
Northeast 3,053,636 538,597 105,886 21.1% (25,625) $36.56
Far Northwest 3,651,884 428,050 56,302 13.3% (54,399) $40.06
Northwest 13,254,843 3,058,382 478,482 26.7% (23,687) $38.92
Round Rock 1,418,712 237,976 18,327 18.1% 498 $34.25
South 2,336,140 474,807 29,877 21.6% 5,512 $51.73
Southeast 2,934,399 285,517 8,000 10.0% (26,898) $35.09
Southwest 10,463,022 1,218,872 331,846 14.8% (93,944) $44.73
TOTAL 51,509,495 8,743,610 1,207,716 19.3% (101,709) $42.20
Austin | Q2 2021 | Office | Market Statistics

Q2 2021 Austin Office Report

  • 1.
    20Q2 21Q1 21Q2 NewSupply (in Thousands of SF) 650,100 1,247,681 1,459,544 Net Absorption (in Thousands of SF) (311,272) (504,196) 87,674 Overall Vacancy 13.1% 18.6% 19.4% Under Construction (in Thousands of SF) 10,204,952 8,322,898 7,760,629 CBD Class A Asking Lease Rates (NNN) $63.22 $64.71 $66.02 Overall Asking Lease Rates (NNN) $41.12 $45.60 $46.06 Sale Indeed Tower CBD | 730K SF Buyer | Kilroy Realty Lease 405 Colorado CBD | 18K SF Perkins Coie Lease Frost Bank Tower CBD | 40K SF Kirkland Ellis Sale 100 Congress CBD | 419K SF Buyer | Carr Properties Sale Aspen Lake Three Far Northwest | 128K SF Buyer | Apollo YOY FORECAST YOY YOY FORECAST YOY FORECAST FORECAST Office Austin, TX 21Q2 Boots On the Ground The ravaging effects of the pandemic on the commercial real estate market have subsided for the time being in the Lone Star State, with Austin well positioned to take the lead in economic recovery. Three months ago, our 21’Q1 Office Insight announced a revitalization in the city’s leasing market – this rebound has continued as deal velocity accelerated through 21’Q2, leading to 87,674 SF of positive absorption. Much of this is attributable to (1) the declining sublease market, and (2) companies deciding to execute leases earlier than originally planned now that physical occupancy is feasible (e.g., widespread vaccinations). Although these factors bode well for the commercial office market, an uptick of vacancy to 19.4% was recorded ... (continued on next page) Unemployment Rate Market Indicators Historic Comparison 4.2% Austin Unemployment Rate 1.47% US 10 Year Treasury Note 5.8% US Unemployment Rate Vacancy Rate 19.4% Net Absorption 87K SF Overall Class A Asking Lease Rates (FSG) $50.63/SF Under Construction 7.7M SF Key Takeaways • Dwindling subleases and an increase in leasing activity signal the start of a return to a healthy office market – we expect further improvement in the third and fourth quarters of 2021 • Quarterly absorption of 87,674 SF marks the first positive swing since the onset of the COVID-19 pandemic • Continued corporate expansions/relocations likely spur further domestic and international investment in Austin commercial real estate Recent Transactions 0.0% 2.0% 4.0% 6.0% 8.0% 10.0% 12.0% 14.0% 16.0% 18Q1 18Q2 18Q3 18Q3 18Q4 19Q1 19Q1 19Q2 19Q3 19Q3 19Q4 20Q1 20Q1 20Q2 20Q3 20Q3 20Q4 21Q1 21Q1 21Q2 Austin Texas US
  • 2.
    Colliers | Austin| 21Q2 | Office Report Office Austin, TX 21Q2 Sublease Environment 43% 3% 3% 3% 5% 3% 23% 1% 16% CBD Central & West Central East North/Domain Northeast Far Northwest Northwest South Southwest 20Q2 21Q1 21Q2 CBD 391,943 791,981 911,991 Central & West Central 39,103 65,457 57,710 East 71,646 85,880 56,880 North/Domain 13,018 106,960 64,406 Northeast 153,798 119,636 105,886 Far Northwest 93,141 56,124 56,302 Northwest 279,442 516,968 478,482 Round Rock 13,176 17,271 18,327 South 6,822 35,909 29,877 Southeast - 8,000 8,000 Southwest 173,331 351,962 331,846 TOTAL 1,235,420 2,156,148 2,119,707 Boots on the Ground continued The Market, at a Glance As Austin commercial real estate continues to take strides forward, many of the subleases that proliferated in the market during the height of COVID-19 have started to dissipate at a rapid pace as a number of companies pulled their spaces in order to re- occupy. Mounting relocations/expansions from other markets have gobbled up significant portions of the remaining attractive sublease options (F45 Training, Canva, Rev and a host of other players have demonstrated this trend in just the last few months). Furthermore, with the introduction of vaccinations, many companies who were awaiting post-pandemic clarity have decided to pull the trigger in 21’Q2 rather than biding their time. It is important to note, however, that this activity has been concentrated mostly in move-in-ready space on short term leases (three years or under). This is potentially attributable to two factors: (1) companies need to make real estate decisions as employees begin phasing back into the office, and (2) there remains some hesitancy as to how the workplace will look in the immediate and long-term, driving the need for shorter-term length. As a result, tenant appetite for large build-outs on long term leases (five years or more) is very low, forcing many landlords currently sitting on delivered product or to build out specs suites and negotiate shorter-term leases in order to compete. While this type of user activity is disadvantageous for landlords in the near term, the eroding subleases will likely improve the market towards the end of the year. Future Forecast Austin continues to attract investments, both domestic and internationally (the city recently ranked as the top target for international investment according to the AFIRE International Investor Survey) – this interest will likely continue to improve as additional corporate giants (e.g. Amazon, Tesla, Facebook) continue to establish and grow their presence in the Texas Capital. Kilroy’s recent entry into the market through its $580M acquisition of Indeed Tower typifies this investor attraction. We generally expect vacancy levels to diminish, pricing to rise and absorption levels to further increase through the latter half of 2021. ...due to the ±1.5M SF of new space that was delivered over the quarter, of which 51% was pre-leased. A large portion of these buildings were Class A which, when coupled with ever-increasing operating expenses, led to a slight bump in overall asking rates to an average of $46.06 (from $45.60 in 21’Q1).
  • 3.
    Colliers | Austin| 21Q2 | Office Report Office Austin, TX 21Q2 0.0% 5.0% 10.0% 15.0% 20.0% 25.0% $0.00 $10.00 $20.00 $30.00 $40.00 $50.00 $60.00 $70.00 Q1 2020 Q2 2020 Q3 2020 Q4 2020 Q1 2021 Q2 2021 CBD Citywide Total Vacancy Notable Q2 2021 Completions (1,500,000) (1,000,000) (500,000) 0 500,000 1,000,000 1,500,000 2,000,000 Q1 2020 Q2 2020 Q3 2020 Q4 2020 Q1 2021 Q2 2021 Deliveries Net Absorption Indeed Tower 730,000 SF | CBD Kilroy Realty 1836 San Jac 206,555 SF | CBD Employee Retirement System of Texas Highland 3 250,000 SF |Central Redleaf Properties Eastlake at Tillery 172,423 SF | East CREA Foundry II 161,436 SF | East Tishman Speyer 1204 San Antonio at Capitol West 41,968 SF | CBD Texas Association of Counties Risk Management Pool (1,500,000) (1,000,000) (500,000) 0 500,000 1,000,000 1,500,000 2,000,000 Q1 2020 Q2 2020 Q3 2020 Q4 2020 Q1 2021 Q2 2021 Deliveries Net Absorption Supply & Absorption The Austin economy is in a stage of revitalization, as evidenced by fading sublease availability and accelerated deal velocity. New deliveries of 1,459,544 SF eclipsed 21’Q1 by a narrow margin, resulting in a slight uptick in vacancy. Absorption of 87,674 SF was recorded in 21’Q2, marking the first quarter in more than a year in which positive levels were recorded; mounting confidence in physical re- occupancy, coupled with a robust relocation & expansion trend, will likely stimulate a continued upwards trend in absorption. This is a welcome shift for developers, who are scheduled to complete 7,760,629 SF of new construction during the next few years. Direct Lease Rates 21’Q2 average citywide asking rate of $46.06/SF slightly exceeds the previous quarter’s rate of $45.60/SF, a bump that could likely be attributed to an abundance of recently completed Class-A space in conjunction with growing operating expenses. As high-quality projects continue to deliver while leasing velocity intensifies, we can expect citywide rates to keep climbing.
  • 4.
    Colliers | Austin| 21Q2 | Office Report Office Austin, TX 21Q2 Upcoming Projects Citywide Construction 27% 43% 8% 14% 8% CBD East South Southeast Southwest 0 1,000,000 2,000,000 3,000,000 4,000,000 5,000,000 6,000,000 Q3 2021 Q4 2021 2022 2023 Leased Expected Deliveries Q3 2021 Expected Deliveries 405 Colorado St. Brandywine Realty Trust 202,138 SF | CBD Q3 2021 Delivery 22.5% Leased RiverSouth Stream Realty Partners 350,661 SF | South Q3 2021 Delivery 22.5% Leased Eastbound Lincoln Property Group 233,577 SF | East Q3 2021 Delivery 0% Leased Uplands Corporate Center: Phase II Drawbridge Realty 124,081 SF | Southwest Q3 2021 Delivery 15% Leased 701 Rio Roscoe Properties 120,954 SF | East Q3 2021 Delivery 0% Leased
  • 5.
    Copyright © 2021Colliers The information contained herein has been obtained from sources deemed reliable. While every reasonable effort has been made to ensure its accuracy, we cannot guarantee it. No responsibility is assumed for any inaccuracies. Readers are encouraged to consult their professional advisors prior to acting on any of the material contained in this report. FOR MORE INFORMATION John O’Sullivan Research Associate Austin +1 512 539 3012 john.o’sullivan@colliers.com David Bremer Managing Director Austin +1 512 539 3014 david.bremer@colliers.com Submarket Existing Inventory (SF) Direct Vacancy (SF) Sublease Vacancy (SF) Overall Vacancy Rate Quarterly Net Absorption (SF) Weighted Average Asking Rate Downtown CBD 12,849,342 1,615,254 911,991 19.7% 189,383 $61.56 TOTAL 12,849,342 1,615,254 911,991 19.7% 189,383 $61.56 Market Total CBD 12,849,342 1,615,254 911,991 19.7% 189,383 $61.56 Suburban 51,509,495 8,743,610 1,207,716 19.3% (101,709) $42.20 TOTAL 64,358,837 10,358,864 2,119,707 19.4% 87,674 $46.07 Suburban Central & West Central 3,511,565 568,434 57,710 17.8% (18,349) $48.12 East 3,487,208 1,114,226 56,880 33.6% 3,917 $56.62 North / Domain 7,398,086 818,749 64,406 11.9% 131,266 $39.62 Northeast 3,053,636 538,597 105,886 21.1% (25,625) $36.56 Far Northwest 3,651,884 428,050 56,302 13.3% (54,399) $40.06 Northwest 13,254,843 3,058,382 478,482 26.7% (23,687) $38.92 Round Rock 1,418,712 237,976 18,327 18.1% 498 $34.25 South 2,336,140 474,807 29,877 21.6% 5,512 $51.73 Southeast 2,934,399 285,517 8,000 10.0% (26,898) $35.09 Southwest 10,463,022 1,218,872 331,846 14.8% (93,944) $44.73 TOTAL 51,509,495 8,743,610 1,207,716 19.3% (101,709) $42.20 Austin | Q2 2021 | Office | Market Statistics