Download to read offline


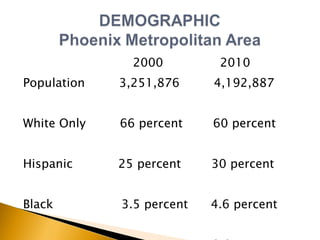
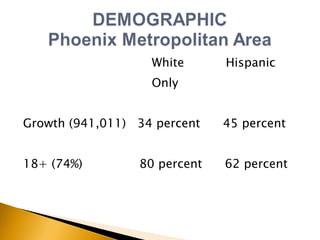
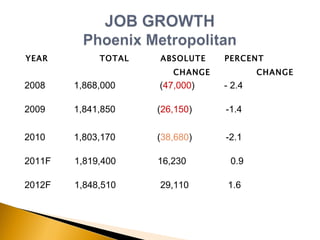
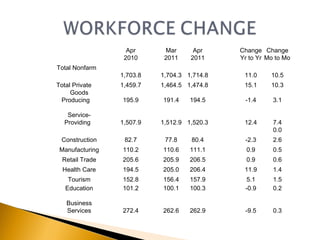
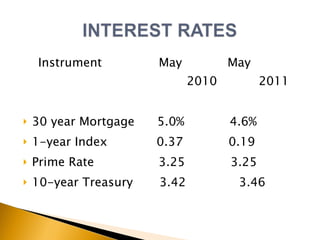
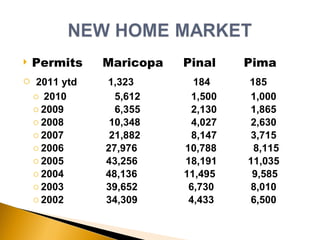
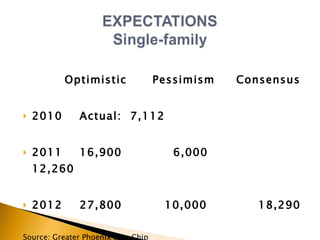
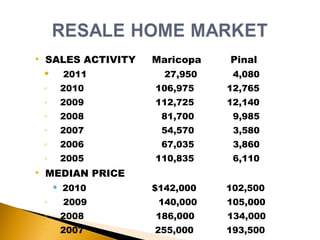
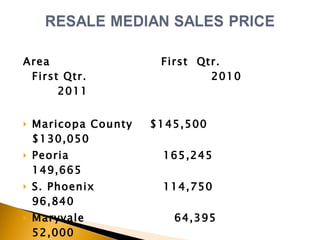
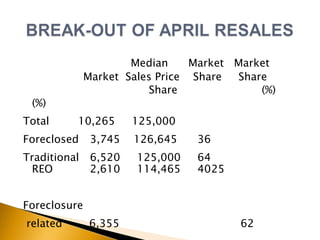
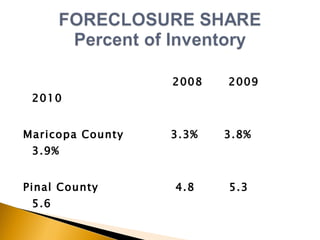
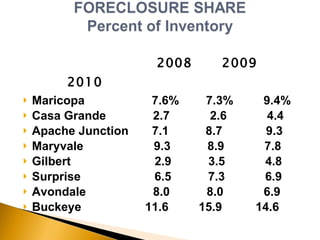
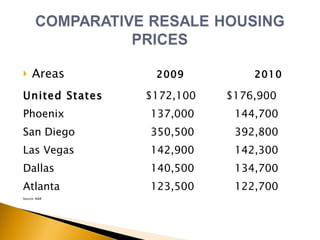
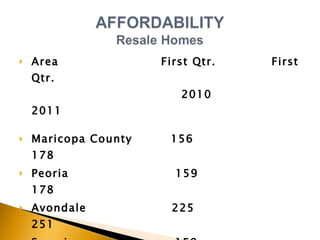
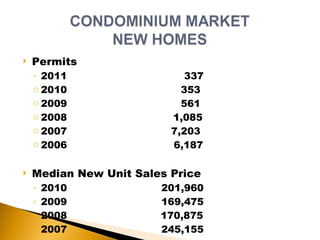
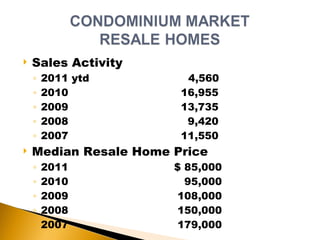
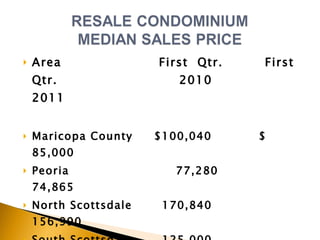
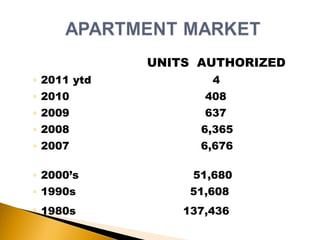

The document summarizes real estate market trends in Maricopa County, Arizona from 2008 to 2011. It notes that after a slow start, the local economy and real estate market were expected to strengthen throughout 2011. It also discusses factors like increasing foreclosures, declining home sales and prices from 2008 to 2010, and projections for modest recovery and growth in 2011-2012.


